Journal of Fluid Mechanics
http://journals.cambridge.org/FLMAdditional services for Journal of Fluid Mechanics:
Email alerts: Click here
Subscriptions: Click here
Commercial reprints: Click here
Terms of use : Click here
The interaction between waves and a turbulent current:
waves propagating with the current
P. H. Kemp and R. R. Simons
Journal of Fluid Mechanics / Volume 116 / March 1982, pp 227 250 DOI: 10.1017/S0022112082000445, Published online: 20 April 2006
Link to this article: http://journals.cambridge.org/abstract_S0022112082000445
How to cite this article:
P. H. Kemp and R. R. Simons (1982). The interaction between waves and a turbulent current: waves propagating with the current. Journal of Fluid Mechanics, 116, pp 227250 doi:10.1017/
S0022112082000445
Request Permissions : Click here
J . Fluid Mech. (1982), vol. 116, p p . 227-250 Printed in Great Britain
227
The interaction between waves and a turbulent current
:
waves propagating with the current
By
P. H. KEMP
A N DR. R. SIMONS
Department of Civil and Municipal Engineering, University College London, Gower Street, London WClE 6 BT
(Received 24 December 1980 and in revised form 23 July 1981)
This paper describes an experimental programme carried out in a laboratory channel with rough and smooth beds, to investigate the interaction between gravity waves and a turbulent current. In particular, changes induced in the mean-velocity profiles, turbulent fluctuations, bed shear stresses and wave attenuation rates are considered for a range of wave heights, keeping the wave period constant. The smooth-boundary tests were carried out as a necessary preliminary to the more-realistic rough-boundary condition.
A directionally sensitive laser anemometer was used to measure horizontal, vertical, and 45' velocity components in the oscillating fluid, and an on-line mini- computer was programmed to produce ensemble averages of velocities, Reynolds stresses and wave-elevation data, The cycle was sampled at 200 separate phase positions, with 180 observations at each position. Measurements were made at up to
30 points in the vertical.
Preliminary tests were carried out on the unidirectional current and on the waves alone. These show that mean-velocity profiles and turbulence parameters of the current agree satisfactorily with previous experiments, and that the waves are approximated closely by Stokes' second-order theory.
For combined wave and current tests, mean-velocity profiles are generally found to differ from those suggested by a linear superposition of wave and current velocities, a change in boundary-layer thickness being indicated. However, shear stresses at the smooth boundary are found to be described by such a linear addition.
1. Introduction
While considerable research has gone into the study of waves and currents separately, little is known about the way in which the combined flows interact, particularly close to the bed.
228
sump 2.45 m
I
3.95 m~
P.
H . Remp
andR.
R.
Simon84.51 3 5 0 m Outlets to Inflow from
header tank
Inflow from header tank
I I
Un/ol )If b valve
valve
Outleis t o
1
overall reduction in mean velocity over depth when waves are superimposed on the current, although their outer flow measurements were not reliable.
George & Sleath (1979) measured the flow over an oscillated bed of spheres with a weak current superimposed, and described the cycle of vortex formation and ejection around the roughness elements. The stronger downstream vortex was found to induce
a weak reverse mean current just above the roughness elements. This is consistent with the observations of Inman & Bowen (1963) and Bijker, Hijum & Vellinga (1976),
who both reported enhanced upstream sediment transport when a weak current was superimposed on waves. The latter paper also observes that insight into the vortex formation as a function of wave and flow parameters is essential for an understanding of sand transport by waves and currents.
Over smooth boundaries, there is very little previous data on the wave-current interaction relevant to bed shear stress or turbulence intensities, although Binder &
Favre-Martinet (1979) have reported a retardation in phase of wave-induced velocities near the bed when currents are imposed on a pulsed duct flow, contrary to the phase advance that occurs for waves alone.
The aim of the authors' research was to provide experimental data for the turbulent- current interaction with waves over both rough and smooth boundaries, and to observe any discrepancy between the measured mean- and turbulent-velocity distri- butions and those predicted by an assumption of linear superposition. Particular interest was paid to the near-boundary turbulent flow, with its implications for
sediment motion.
2.
Apparatus
The investigation was carried out in a specially constructed channel 14.5 m long,
457 mm wide and 690 mm deep, with provision for flow in either direction and wave generation by a bottom-hinged paddle at one end. Flow was supplied by a recirculating system with header tanks 16 m above. Inflow to the channel was controlled at a steel gate valve, while outflow was adjusted at three diaphragm valves-see figure 1.
Interaction between waves and a turbulent current 229
0' 50 100 150 200 (mm/s)
FIQURE 2. Mean-velocity profiles: current alone. x
-
x smooth-boundary run CA;A-A,
rough-boundary run CR.of flow. The latter was chosen so as to generate a rough turbulent boundary layer both with the unidirectional current, and also with the larger waves in the absence of
a current.
It
was also of a similar geometric form to that used by Jonsson & Carlsen(1976) in their tests in an oscillating water tunnel.
3. Instrumentation and analysis
Fluid velocities were measured using a laser-Doppler anemometer, thus avoiding the introduction of a measuring probe into the reversing flow. Since a single-channel laser anemometer was used, average Reynolds stresses were determined from velocity measurements in two orthogonal directions a t 45' to the horizontal (see appendix).
Analysis of turbulent and wave-induced velocities was carried out by an on-line PDPSE minicomputer. This was programmed to compute ensemble averages of the wave-induced velocity, the initial phases of which were synchronized by a 5
V
trigger pulse, actuated by the wave generator. The r.m.s. fluctuations il' about the ensemble averages ii of the horizontal velocity component were also derived,? and both time- and frequency-domain analysis was carried out on the turbulent fluctuations remainingt
Throughout this paper, for a quantity M , M N is the ensemble-average of M with 2 sub- tracted (% is the mean value over the full sample period) :N-1
0
%(t) = N-l I; M ( t + n T ) - B .
N N
M' is the turbulence r.m.s. of M about periodic M :
N N - 1 N
230
P.
H .
Kemp
andR. R.
Simons
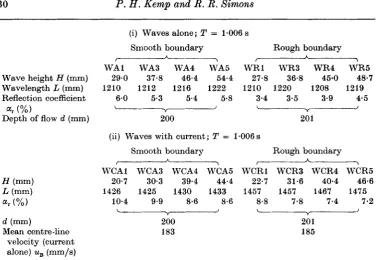
(i) Waves alone; T = 1.006 s
Smooth boundary Rough boundary
WA1 WA3 WA4 WA5 WR1 WR3 WR4 WR5
Wave height H (mm) 29.0 37.8 46.4 54.4 27.8 364 45.0 48.7
WavelengthL(mm) 1210 1212 1216 1222 1210 1220 1208 1219
A A
r > r 7
Reflection coefficient 6.0 5.3 544 5.8 3.4 3-5 3.9 4.5
a, 1%) Y -Y-
Depth of flow d (mm) 200 201
(ii) Waves with current; T = 1.006 s Smooth boundary
-
WCAl WCA3 WCA4 WCA5 20.7 30.3 39.4 44.4
1426 1425 1430 1433
10.4 9.9 8.6 8.6
Rough boundary
WCRl WCR3 WCR4 WCR5
22.7 31.6 40.4 46.6
1457 1457 1467 1475
8.8 7.8 7.4 7.2
d (mm)
Mean centre-line velocity (current alone) uB (mm/s)
200
183 201 185
TABLE 1. Wave characteristics with and without current imposed
after the ensemble averages had been removed from the full velocity signal. The computer also proved invaluable in constructing ‘instantaneous
’
velocity profiles a tphases through the wave cycle from sets of ensemble-average velocities.
Wave heights were found by ensemble-averaging the output of a resistance-type wave monitor, and wave period timed against the computer’s real-time crystal clock.
4. Results for unidirectional current and wave alone
It
was decided to keep the flow depth at the measuring section constant a t 200 mmfor all tests, and to use one overall flow rate through the channel. It was found that, to achieve this, only slight adjustments were necessary over the whole range of tests. Run CA was for unidirectional current over the smooth bed, run CR over the rough bed-see figure 2.
When scaled on suitable flow parameters, a logarithmic mean velocity profile was found to follow the universal law of the wall for both rough and smooth boundaries, with von KbrmBn’s constants of 0-36 and 0.4 respectively. Average centre-line velocities
uB were deduced from the measured profiles. Horizontal and vertical turbulence intensities, and Reynolds-stress measurements in the wall layer were in good agreement with previous research (Laufer 1950; Grass 1971).
Runs WAl-WA5 were for waves alone of increasing height over the smooth bed; WRI-WR5 were for waves over the rough bed. All waves tested were of 1 s period, and varied in height between 25 and 55 mm. This gives a range of a b m / k s of 0-35-0.75, or
ab,/k, of 1.75-3-7. Here abm is the orbital amplitude of a particle a t the outer edge of
the wave boundary layer,
k,
is the Nikuradse equivalent sand roughness, andkt
is the physical height of the triangular roughness elements. Reflection coefficients, derivedInteraction between waves and a turbulent current 23 1
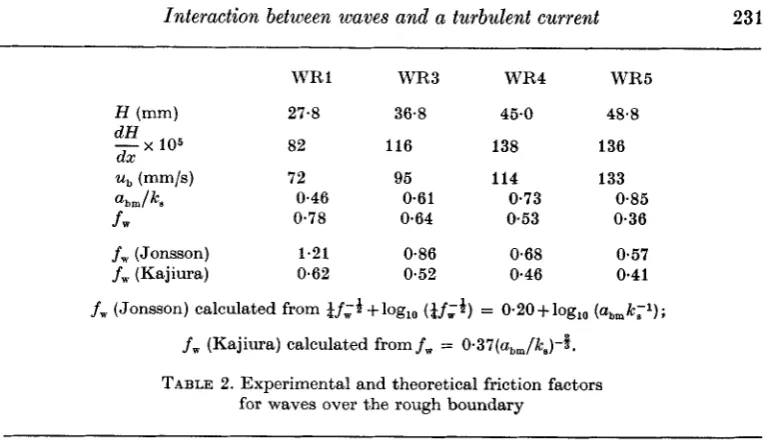
WR 1 WR3 WR4 WR5
H (mm) 27.8 36.8 45.0 48.8
dH
--x dx 1 0 5 82 116 138 136
ub (mm/s) 72 95 114 133
a b m l k a 0.46 0.61 0.73 0.85
f w 0.78 0.64 0.53 0.36
f, (Jonsson) 1.21 0.86 0.68 0.57
f, (Kajiura) 0.62 0.52 0.46 0.41
f, (Jonsson) calculated from $f;*+log,,
(if;*)
= 0~20+10g,, (abmk;l);f, (Kajiura) calculated from f, = 0.37(abm/lc,)-%,
TABLE 2. Experimental and theoretical friction factors for waves over the rough boundary
by measuring wave heights a t regular intervals less than a quarter of a wavelength apart, were of the order of 5
yo
(see table 1).Wave-surface profile and wave-induced periodic velocities corresponded to Stokes’ second-order theory, except close to the smooth boundary, where Lamb’s (1932)
viscous oscillatory boundary-layer theory described the amplitude and phase shift
of the velocities.
Turbulence intensity measured in the waves alone over the smooth bed was of the same low order as the electronic noise of the anemometer ( < 5 % ) . However, within
4 roughness heights of the rough bed, for all waves tested values were obtained far in excess of those measured in the turbulent unidirectional currents. Intensities varied considerably through the wave cycle, the greatest fluctuation being measured in the vertical component over the roughness trough. Maximum intensities over the rough- ness apex tended to occur simultaneously with minima over the trough. This was because of vortices forming and residing for most of the wave period in the trough, but being rapidly ejected over the apex each half-cycle.
The test programme included measurement of wave-height attenuation along the channel, from which the rough boundary friction factor f w was determined, using equation (11) of Kamphuis (1978). This assumes first-order waves, and neglects side- friction. The results are set out in table 2, together with values derived from the turbulent oscillatory boundary-layer theories of Jonsson & Carlsen ( 1976) and Kajiura
(1968). It should be pointed out that the waves under test had abm/ks values smaller than the ranges of validity of these two theories. Nevertheless, the experimental results lie between those predicted by the two theories.
5.
Results
-
combined current and waves
232
P .
H .
Kernp andR. R.
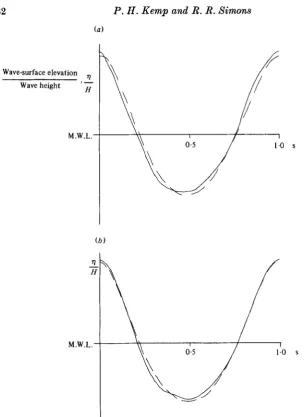
Sirnons ( a )I
FIGURE 3. Wave profiles with and without current. (a) Rough-boundary runs WR3 and WCR3; ( b ) smooth-boundary runs WA4 and WCA4.
--,
wave with current ;-
- -, wave alone.measuring section was also maintained constant with only slight adjustment of outlet valves.
Interaction between waves and a turbulent current 233
I -
%,+
I
p.
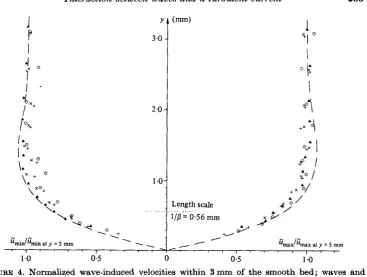
FIGURE 4. Normalized wave-induced velocities within 3mm of the smooth bed; waves and current.
B
= (r/vT)* is the viscous-boundary wavenumber. Wave period T = 1 s, d = 200 mm, T i , = 183 mm/s. 0, WCAl;+,
WCA3; x , WCA4;A,
WCA6;- -
-
Lamb's theory.current. The height and phase of the reflected waves at the anemometer position have to be considered when interpreting wave-induced horizontal and vertical velocities ii and B respectively.
A
notable feature of the results from tests over both rough and smooth beds is the reduction in maxima and minima of the periodic wave-induced velocity 0 near the bed. This reduction is seen to extend further from the bed and to a greater degree in the steeper waves, the layer of reduced velocities extending 30mm from the bed in run WCA5. Figure 4 contains normalized and iimin very close to the smooth bed for all the waves on the current, together with the theoretical solution taken from Lamb(1932).
It
can be seen that there is good agreement, as for waves alone, with maximum amplitude reached a t 1.4mm from the bed level, despite the fact that there was now turbulence in the near-bed wave boundary layer.5.1. Mean velocities
Mean velocities in the combined wave and current tests were obtained in the same way
as for the waves alone, by averaging the anemometer signal over 180 wave cycles.
234
P . H .
Kemp andR. R.
Simon81001
0
L
FIGURE 6 . Mean-velocity profiles over smooth bed: experimental and theoretical. (a) WCA 1,
H = 20.7 mm; (b) WCA3, 30.3 mm; ( c ) WCA4, 39-4 mm; (d) WCA5, 44-4 mm. x
-
x , experi- mental results ; 0- - -
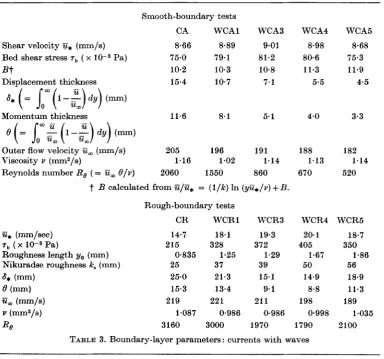
0, theoretical superposition of wave alone and current alone.Smooth-boundary tests
CA WCAl WCA3 WCA4 WCA5
Shear velocity ?& (mm/s) 8.66 8.89 9.01 8.98 8.68
Bed shear stress 7b ( x Pa) 75.0 79.1 81.2 80.6 75.3
Bt 10.2 10.3 10.8 11.3 11.9
Displacement thickness 15.4 10.7 7.1 5.5 4.5
Momentum thickness 11.6 8.1 5.1 4.0 3.3
Outer flow velocity ;ii, (mm/s) 205 196 191 188 182
Viscosity v (mmZ/s) 1.16 1.02 1.14 1.13 1.14
Reynolds number Re ( = ;ii, B/v) 2060 1550 860 670 520
t
B calculated from Ti/?& = (l/k) In (y;ii,/v)+
B. Rough-boundary testsCR WCRl WCR3 WCR4 WCR5
-
u* (mmlsec)
7, ( x 10-9 Pa)
Roughness length yo (mm) Nikuradse roughness k, (mm)
a*
(mm)6 (mm) (mm/s)
Y (mmZ/s)
Re 14.7 215 25 25.0 15.3 0.835 219 1.087 3160 18.1 328 37 21.3 13.4 1-25 221 3000 0.986 19.3 372 39 15.1 9.1 1.29 21 1 0.986 1970 20.1 405 50 14.9 8.8 1.67 198 0.998 1790 18.7 350 56 18.9 11.3 1.86 189 2100 1.035
Interaction between waves and a turbulent current 235
0
0
+
x
A
' A 0
+ x 9
Y (mm)
I 1
-FIGURE 6. Semi-logarithmic velocity profiles over smooth boundary: Ti vs. log y. 0, current alone CA. Wave and current : 0, WCAl ;
+
, WCA3; x , WCA4;A)
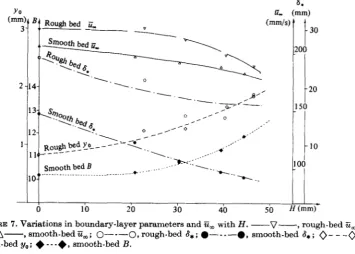
WCA5.FIGURE 7. Variations in boundary-layer parameters and Ti, with H. -V-, rough-bed 5,;
-A-)
smooth-bed Tim; 0--- 0,rough-bed 8,; .---@, smooth-bed &;0-
--0,
rough-bed yo;+
---+,
smooth-bed 3.with the experimental results, from which it can be seen that a simple law of super- position does not hold. Measured velocities are larger near the boundary and smaller in the outer flow than for the added component flows, with the latter trend becoming more pronounced in the highest wave. These results suggest that the boundary-layer thickness has been diminished by the addition of the waves, a finding reinforced by
the reduction in displacement and momentum thickness calculated - see table 3.
236 P .
H .
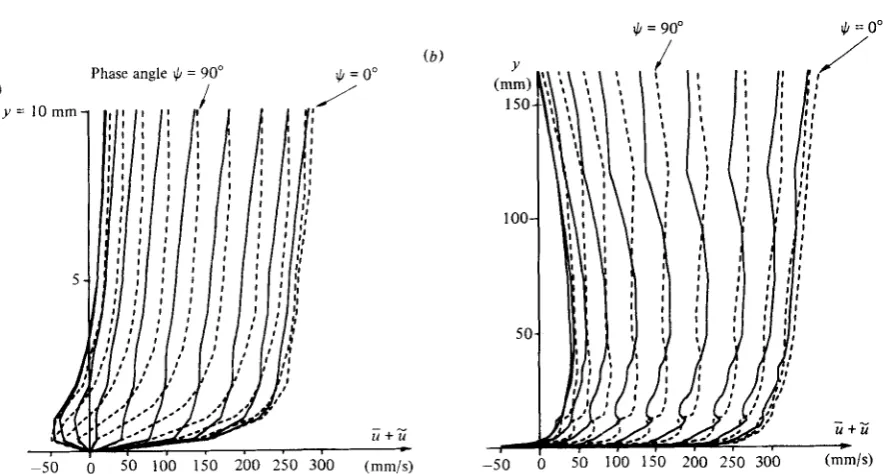
Kemp and R. R. XimonsJ, = 90" $ = 0" ( 6 )
Phase angle $ = 90" ii/ = 0"
-50 0 SO I00 150 200 250 300 (mm/s)
FIGURE 8. ;ii+.ii vs. y at 18' intervals: run WCAB (smooth bed). (a) near bed;
(a)
full depth.there is a noticable reduction in ii with increasing
H ,
as for the smooth bed tests. But near the roughness elements a t the bed, there is a more complex change. Within two roughness heights of the apex level there is a reduction inU
with increasing H , as found in the outer flow. However, a reduction was found in the boundary-layer thickness a t the side walls from 30 to 5mm when the largest wave WCR5 was imposed on the current, and it was also noted that the secondary flow cells had moved. From these findings it was concluded that a comparison of outer flow velocities would be influenced by the side walls. Thus, the main study of the changes in characteristics of the turbulent boundary layer has to be limited to the near-bed layer, less influenced by side-wall boundary layers.5.1.2. Boundary-layer profiles. I n the unidirectional-current tests, the logarithmic law of the wall was found to hold good over both rough and smooth beds. Over the smooth bed, the same is found when waves are superimposed -see figure 6. However, certain differences in the profiles are apparent. For the three smaller waves over the smooth boundary, the effect of increasing wave height is to give a uniform increase to the mean velocity through the logarithmic region. The largest wave, WCA5, produces no further increase in U, however, and the curve drops off beyond the outer edge of the logarithmic layer. The mean-velocity profiles in the bottom 3 mm of flow for all tests with and without waves each exhibit parallel, linear regions indicating that the shear stress ?b a t the channel bed is unaffected by the oscillatory motion. It also seems, however, that the viscous stresses are effective further from the boundary as H
increases, although the extent of the linear portion does not increase.
A
common feature of all the rough boundary tests is that although they exhibita logarithmic layer, the mean shear stress deduced from the slope of the logarithmic profile is significantly higher than that for the current alone. It is also seen (see table 3
Interaction between waves and a turbulent current
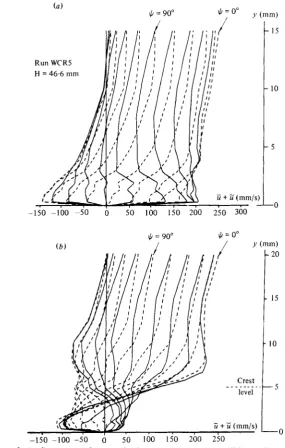
Run WCRS H = 46.6 mm
-150 -100 -50 0 50 100 150 200 250 300
II, = 90"
/
J, = 0"
-150 -100 -50 0 50 100 150 200 250
237
FIGURE 9. t+C vs. y a t 18" intervals through the cycle; run WCR5, H = 46.6 mm;
( a ) Over roughness crest; ( b ) over trough.
ii = 0) increases with wave height up to two times the current-only value. However, the cross-channel redistribution of flow for the larger waves makes too close an analysis of the profiles questionable, and the evaluation of the mean of the shear velocity ii,
from the logarithmic region is sensitive to the number of measurements in the layer.
(u* = ~ t p - 4 , where p is density.)
238
P.
H.
Kemp and
R. R.
Simons
Measurements in viscous layer
a* fmm/s)
G*lUSX
%,in
? x 10-8 Pa
TUWX
Fmin
Measurements in logarithmic layer
TmSX
Theoretical addition of wave and current velocities in the viscous layer
I
'%ma, 7max
CA WCAl WCA3 WCA4 WCA5
8.6 8.9 8.9 9.3 8.9
-
13.4 16.2 16.8 18.2-
-
3.7-
7.8-
9.1-
12.474 79 80 86 79
- 180 262 283 332
-
-
14-
61-
83-
1538.7 8.9 9.0 9.0 8.7
-
9.9 9.8 10.3 10.475 79 81 81 75
-
98 97 107 1088.6 14.2 16.0 17.7 18.5
74 203 257 315 344
TABLE 4. Mean and periodic shear-stress parameters
there is a reduction in the return flow. This decrease is a consequence of the increased part of the wave cycle during which flow above the bed is against the current. The duration of this reverse flow increases with
H ,
thus allowing the formation of 'upstream'
vortices, which induce downstream velocities in the roughness troughs. The extentof flow reversal is made more clear in ensemble-average velocity profiles such as those in figures 8 and 9.
It is of interest to note that flow reversal takes place near the smooth bed for all the waves tested, in the smallest,
WCA1,
within only 0-4 mm, but for the largest,WCA5,
over 3 mm. Such reversal involves an inflection in the velocity profile, normally a sign of instability in steady flow. Over the rough bed the reversal layer is thicker, varying between 3 and 15 mm above apex level.
From the velocity profiles close to the smooth bed, it is possible to calculate the maximum and minimum bed shear stress, Tmax and induced periodically by the waves and currents. These are presented in table 4, with corresponding values of
G,.
Also included are measurements of B, derived from the slope of the logarithmic velocity profile.
It
is seen that the maximum bed shear velocity is approximately double the mean-over-the-wave-cycle estimateU,
for the larger waves.It
is also apparent that the large periodic variations inB, close
to the bed are not transmitted out into the logarithmic region, although the value of B* was found to vary from 4, in this layer by 20Ya
in the larger waves, and 10 in the smaller. This indicates a wave-influenced turbulence, apparent from the maximum periodic velocities, Giimax, discussed in § 5.2,although no such turbulence was found in the tests on waves alone.
Interaction between waves and a turbulent current 2 39
ii+ii
(mm/s)
300
200
100
I
-100
.
0.
0 . 0 0
.
.
.
.
Symbols _.... x - - WCRl
--e. WCR3
-0- WCR4
-
WCR5FIQURE 10. Semi-logarithmic velocity profiles over rough bed at phases corresponding to wave crest and wave trough (measured over roughness apex). x
- - -
x , WCRl ; V----V ; WCR3;0-n,
WCR4; .-@, WCR5.line, as seen in figure 11, although the logarithmic portion occurs a t differing y/&, for wave crests and troughs.
The phase of the horizontal periodic velocity component was also measured, relative to the wave-surface profile. It was found that the phase advance near the rough bed was slightly less than for the case of waves alone, but was still of the order of 25".
5.2. Turbulence characteristics
2 40
h
.
E.s
20- I."
1- E ?X
P.
H . Kemp
andR.
R.
Simons
10-
I
-10
i
FIQURE 1 1, Normalized semi-logarithmic velocity profiles measured over rough-bed apex, at
phases corresponding to wave crest and trough. Symbols as in figure 10.
'"1
0
o / /
O / '
/ /
+ ,
+ P'"
0 1 I
/ / /
0
01 I -
0.1 1 10 50 mm
y (with corrected origin)
FIQURE 12. .ii' vs. log y: smooth-bed tests with current.
- -
-, current alone CA; u'.Wave and current;.iiL,,: 0, WCAl;
+,
WCA3; x , WCA4; A , WCA5.logarithmic layer. However, further from the bed the combined flow intensities fall below the values for current alone as far as the edge of the boundary layer. This bears out the results of the mean-velocity profiles, that the addition of waves reduces the thickness of the boundary layer.
Interaction between waves and a turbulent current 241
A
100-
h
E E
v
A
50-
0
X A
50
-
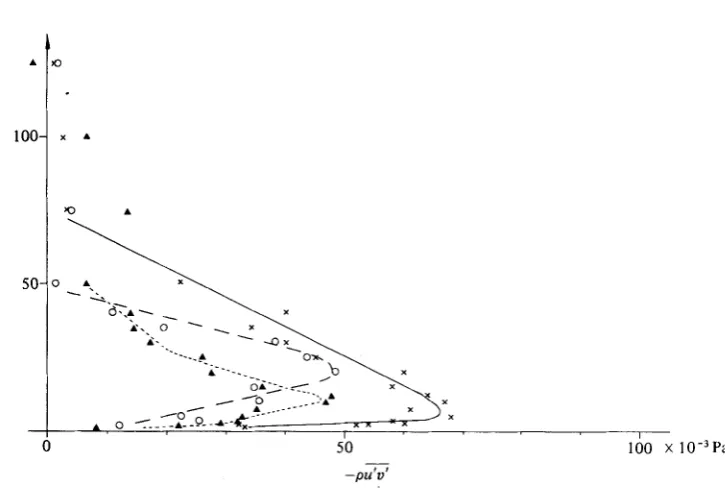
-pu'd
I 100 x 1 0 - 3 ~ a
FIGURE 13. Reynolds-stress distribution over smooth bed. x
-
x , current alone CA.Wave and current: 0- -0, WCAl; A - - - - A , WCA5.
addition of the wave, although the maximum value of
GL,,,
found in the region close to y = 1-5mm, does increase by approximately 20%.
This is shown more clearly on a semi-logarithmic scale, in figure 12.It
is seen from figure 13 that the superposition of the waves causes a considerable reduction in the turbulence stress, both near the boundary and in the outer flow. The apparent reduction in u'v' near the bed without a corresponding reduction in G' and5'
can be reconciled by the suggestion, made above, that the generation of the turbulence is to some extent periodic with the wave. This would result in a certain proportion of the turbulent-velocity fluctuations being absorbed into the ensemble-mean values, Any turbulent flow with a superimposed period motion will present similar difficulties in extracting true turbulence intensities and Reynolds stresses if part of the generation process is directional and periodic, such as the regular ejection of vortices from a rough boundary. Thus a fluctuation in the flow which is an integral part of the turbulence mechanism can contribute to the ensemble average and not appear as measured turbulence intensity.5.2.2.
Rough
boundary. It is seen that turbulence intensity fluctuates considerably in both directions through the wave cycle, particularly within two roughness heights above the bed apex, a layer 10 mm thick. Here, there is a maximum intensity at a phase corresponding to maximum horizontal deceleration, with a small peak during the accelerating phase. These characteristics are shared by measurements over roughness trough and apex, and by ii' anda'
components-see figures 14 and 15.The superposition of even the smallest wave tested causes a dramatic increase in turbulence over the values for current flow alone. To emphasize the increase of intensity with wave height, figure 16 contains profiles of 5LaX for 25 mm above the roughness apex level, including the results from all the combined wave-current tests, together
242
5 -
1 5 -
5 -
P . H .
Kemp and R.R.
Simons1 0 .
- 100 mm
20 - 10 mm
15 -
FIUURE 14. 0' w8. phase angle $ over rough-bed apex: run WCR4.
with the unidirectional current values. It is seen from figure 17 that these intensities, even when scaled on the increased wave and current shear velocity, do not fall back to the values for current alone.
Figure 18 reveals that the rate of increase with wave height of turbulence intensities near the boundary is reduced by the addition of the current, for the range of wave heights considered.
Interaction between waves and a turbulent current 243
15-
10-
5.1
100 mm 15-
10- 25-
20 - 50 mm
25 mm 30
-
25,
10 mm 35-
45
40 1 mm
35
30- , I V
\r/
0"
90" 180"
FIQURE 15. C' w8. phase angle @ over rough-bed apex: run WCR4.
the roughness apex, but returns to the mean-over-cycle value further from the bed.
A
sharp dip in Reynolds stress u 7 1 mm above the roughness apex for tests on waves alone, attributed to the ejection of the upstream vortex, is no longer distinct, whereas the peak u'v' at the phase of ejection of the downstream vortex, not particularly clear in the tests on waves alone, has now become the dominant feature, occupying a considerable part of the wave cycle.244
P.
H . Kemp and
R. R.
Simons1 A + X O I
I
I I
1. A 0 + x
.I OA + X
0 + X A
0 + A X
l 0 + X A
-, V m x ; v:
FIQURE 10. w'; 9Lax w8. y within 25 mm of bed-roughness apex: waves with current.
-
current alone; w'. Wave and current; 6&: A, WCRl ;
+,
WCR3; x,
WCR4; A , WCR5:Measurements taken over a bed roughness element.
-, v 1%
-
;U'IU,
FIQURE 17. Normalized vertical turbulence intensity above bed-roughness apex.
Symbols as in figure 16.
5.3. Discussion
Interaction between waves and a turbulent current 246
h
.
EE
v
o ! 1 I c
10 20 30 40 50
H (mm)
FIQTJRE 18. Increase of
*Lax
with wave height. Wave and current: (a)+-+, 6 mm above trough; (b) x---
x , 1 mmaboveapex; (c) 0 - - - 0 , 20mmaboveapex. Wave alone: (d) A-A, 6mm above trough; (e) V---V, 1 mm above apex; (f) O---O, 20mm above apex. Note:fiLx
= v’ when H = 0.An important aspect of research into waves superimposed on turbulent currents is the effect that such a flow might have on sediment motion. In table 4, it was shown that the maximum smooth bed shear stress during a wave cycle is considerably increased over both the value in unidirectional flow and that found by averaging over
a full cycle. If one compares these measured maximum stresses with theoretical values derived assuming a linear superposition between the current and waves of the same height, they are seen to be of the same order, generally within 10
yo
of the predicted values.Thus a linear law
of
superposition does appear appropriate asaguideto
the maximum shear periodically experienced. However, the use of such a simple model to predict the pick-up of sediment from the bed is complicated by the cyclic nature of the turbulence intensities in the near-bed layer. At the phase of maximum bed shear, the turbulence is at its lowest value and it is only during the-decelerating, adverse-pressure phase that enhanced turbulence is present to increase diffusion of the sediment from the bed. Nor would a linear model predict the limit imposed on the diffusion by thecontraction of the boundary layer.
The results shown in figure 7 indicate that the addition of waves of increasing height to a current over a rough boundary increases the apparent roughness by up to a factor
246
P.
H . Kemp
andR.
R.
SimonsE (rnrn2/s)
, Grant & Madsen (1979); -, present data. E = ;T,(pd;ii/dy)-l for wave and current.
FIGURE 19. Eddy-viscosity distribution over rough bed: run WCR3.
- -
-, Christoffersen (1980) ;while they suggest a reduction in mean-over-depth velocity ;iln of 33
yo.
The experi- mental results of Brevik & Aas (1980) and Bakker & van Doorn (1978) both also showa considerable drop in iiB with the addition of waves to a current. However, neither explain how the current can be considered to be the same when there appears to be less flow along the channel when waves are added. In the tests reported here, the average bed shear stress over the rough bed increases with wave height (see table 3),
but this is associated with a systematic decrease in boundary-layer thickness at both the bed and the side walls. The net effect on overall discharge is small.
With the finite-height waves used in the present investigation the orbital velocities attenuate significantly below the water surface. As a result, the velocities measured a t a given fixed point in the flow throughout a wave cycle are associated with different orbits, having different diameters. As Jonsson (1978) pointed out, there is anet forward transport of fluid over a wave period between trough and crest. This effect is reversed below trough level owing to orbit attenuation. To remove this effect from the measure- ments in order to arrive at the mean unidirectional current velocity superposed on the waves, the measured velocities were adjusted using second-order wave theory.
The bed shear stress for the largest wave tested showed a change in trend from the other waves, suggesting that a new flow regime may be developing as the orbital amplitude at the bed increases in relation to the spacing of the bed roughness.
In figures 10 and 11, it was shown that the logarithmic profile is still descriptive of a combined wave-current flow field, even through the wave cycle. This lends credibility to the various theories for combined waves and currents which are based on the assumption of a logarithmic layer.
Grant & Madsen assume a boundary layer of two regions with a linearly varying eddy viscosity in each. Figure 19 suggests that this is reasonable for most of the outer layer, although in the wave layer near the bed the distribution is scattered, and suggests a constant value of eddy viscosity.
Interaction between waves and a turbulent current 247
away from the bed, or from ensemble-average velocity profiles (figure 9). Both indicate
7.5
<
8,
c 10-00mm for all waves tested, giving a ratio of&/k,
of 0.4. This compares with 0.27 calculated from equation (50) of Christoffersen (1980).The near-bed response of the flow over the rough boundary to the waves is generally different from that over the smooth bed, with both mean velocity and turbulence dependent on boundary geometry. The two positions selected for measurement of vertical profiles do not give a full picture of the flow structure in the region, in particular the size of the vortices a t various phases of the wave. However, they do succeed in showing up the contrasting features of flow over a roughness apex and in a trough.
The present study bears out the considerable dominance of the downstream vortex in the turbulent characteristics of the layer, with a resulting decrease in mean velocity near the bed.
It
also confirms the findings of Bijker et al. (1976) that the addition of a current to an oscillatory motion may increase upstream sediment transport.The relatively large physical size of the bed roughnesses compared with the laser measuring volume means that the definition of turbulence near the bed is not clear. This is because turbulence-generating vortices are periodic in this layer, and ac- cordingly appear not in the turbulence r.m.s. component, but in the ensemble average.
6.
Conclusions
(1) The unidirectional turbulent boundary layer is reduced in thickness by the superposition of waves propagating with the current over both rough and smooth beds. Side-wall boundary layers are also reduced, leading to a redistribution of flow across the channel.
(2) For all combined wave and current tests, flow reversal was experienced near the bed.
(3) Mean velocities near the smooth bed are increased by the addition of waves, whereas near the rough bed they are reduced. The latter is due to a change in the vortex pattern formed between bed roughness elements.
(4) The logarithmic portion of the mean velocity profiles over the rough boundary indicates an increase in mean bed shear stress 5 and roughness length scale yo with wave height. For the larger waves tested, 7 and yo are approximately double their values for current alone.
( 5 ) Over the smooth boundary, maximum horizontal turbulence intensity during the cycle, for combined wave and current tests, is 20
yo
higher than for the current alone. Within 20mm of the bed turbulence intensity is periodic, of amplitude up to(6) Within 2 roughness heights of the rough bed, the turbulence characteristics are dominated by the periodic formation of vortices at the bed. Maximum turbulence intensities and Reynolds stresses measured in the combined flow are up to three times their values for current alone, and they vary by over 50
yo
about their mean values during a wave cycle.(7) For the range of waves tested, turbulence parameters near the rough boundary increase more rapidly with wave height for tests on waves alone than for waves propagating on a following current.
248
P. H .
Kemp and R.R.
Simons7.
Possible implications in relation to sediment transport
The entrainment of sediment under flat-bed conditions can be related to the predicted instantaneous shear stress. However, although the entrainment of material from the bed can be considered to show a considerable increase under the combined action of waves and currents, the distribution of turbulence intensities suggests that the zone of diffusion would not increase. In fact, the results indicate a reduction in boundary-layer thickness. One might expect, therefore, that there would be an increase in sediment concentration in the near-bed region. In the light of Nielsen's
(1979) observations, this distribution would change dramatically under spilling breakers, the material rapidly dispersing over the whole depth of flow.
The greater turbulent stresses found when waves are superimposed on a current are likely to result in a considerable increase in sediment pickup from a rippled bed. While the increase in turbulence is limited to a region within 6 or 7 roughness heights of the bed with'a tendency for this zone to decrease with wave height for a constant wave period, it is to be expected that sediment brought into suspension by the near-bed vortex action will be diffused over the zone
of
the current-induced turbulence. This could result in significantly higher transport rates as long as the increased bed shear stress is not such as to prevent the formation of high bed ripples.In the case of waves alone, the shear stresses at the bed are of the same order as for
combined wave and current flow, but the vortex-dominated layer extends only approximately four roughness heights above the bed, and the only means of trans- porting sediment is by relatively weak wave-induced mean velocities. The limited thickness of the wave-induced vortex layer over a rippled bed has previously been noted by Tunstall &, Inman (1975). This suggests that sediment would be concentrated in this near-bed layer.
8. Continuing research
The test-channel and experimental techniques described herein are a t present being used in a study of flows in which waves and current propagate in opposite directions. The periodic nature of the near-boundary turbulence, wave attenuation and boundary- layer thickness are of particular interest. It is also intended to introduce sediment into the flow to observe the actual effects of the flow interaction on transport
rates.
The authors wish toexpress their appreciation for the support given to this in- vestigation by the Hydraulics Research Station, Department of the Environ- ment.
Appendix
7 from Reynolds-stress measurements
Without the use of a two-channel anemometer, it is necessary to combine two sets of
Interaction between waves and
aturbulent current
249velocity components and a', b' the turbulence fluctuations, then these are related to the horizontal
U ,
u' and verticalv,
v'
components by.
A+a'
= ~ B + u ' ~ c o s ~ ~ o + ~ 5 + v ' ) s i n ~ ~ o , (1)( 2 )
(3)
B+
b'
=(0
+
u') COB 45O+
(7
+v')
sin 4 5 O .A2-@
=+(U+
V ) L + ( p
p)2 =2 0 7 .
Taking the mean values, and squaring, combining (1) and (2):Conversely, squaring first, then taking mean values:
- -
(A+a')Z-
(B
+
b')2 =&[(U
+
u'
+
V
+
d ) 2 -(0
+u'-
V
-
v')2]
= 2 [ ( U .V +
B.v'+u'. V+u'v')],
- -
or A 2 + B 2 + G ' 2 - 6 ' 2 = 2u.
Vv2u'v'.
- - -
Combining (3) and (4):
a'2-b12 =
2u'v'
(4)
- -
Hence, Reynolds stress
p a = &p(at2
-
bt2).Equation (6) is used to calculate Reynolds stresses p a through the depth of flow, and p a through the wave cycle.
R E F E R E N C E S
BAKKER, W. T. & VAN DOORN, TH. 1978 Near bottom velocities in waves with a current.
16th Conf. on Coastal Engng, Hamburg. Paper no. 110.
BIJKER, E. W., HIJUM, E. V. & VELLINQA, P. 1976 Sand transport by waves. In Proc. 15th
Coastal Engng Cunf., Hawaii, vol. 2, chap. 68, pp. 1149-1167.
BINDER, G. & FAVRE-MARTINET, M. 1979 The inner layer in unsteady turbulent boundary layers. In Proc. 3rd Meeting of Eurovkc. on Umteady Turbulent Boundary Layers and Shear Flows, Liverpool, pp. 8-16.
BREVIK, I. & AAS, B. 1980 Flume experiment on waves and currents, 1, rippled bed. Coastal
Engng 3, 149-177.
CHRISTOFFERSEN, J. B. 1980 A simple turbulence model for a three-dimensional current wave motion on a rough bed. Int. Rep. no. 1, Inst. Hydrodyn. Hydr. Engng (ISVA), Tech. Univ. Denmark.
DALRYMPLE, R. A. 1974 Finite amplitude waves on a linear shear current. J. aeophys. Res. 79, GEORGE, C. B. &,SLEATH, J. F. A. 1979 Measurements of combined oscillatory and steady flow
GRANT, W. D. & MADSEN, 0. S. 1979 Combined wave and current interaction with a rough
GRASS, A. J. 1971 Structural features of turbulent flow over smooth and rough boundaries.
INMAN, D. L. & BOWEN, A. J. 1963 Flume experiments on sand transport by waves and
JONSSON, I. G. 1978 Energy flux and wave action in gravity waves propagating in a current.
4498-4504.
over a rough bed. J. Hydraul. Res. 17, 303-313.
bottom. J. Geophys. Res. 84, pp. 1797-1808.
J. Fluid Mech. 50, 233-255.
currents. In Proc. 8th Conf. on Coastal Engng, Mexico City, vol. 2, chap. 11, pp. 137-150.
260
P.
H .
Kemp andR. R.
SimonsJONSSON, I. G. & CARLSEN, N. A. 1976 Experimental and theoretical investigation in an
oscillatory turbulent boundary layer. J. Hydraul. Res. 14, 46-60.
KAJIURA, K. 1968 A model of the bottom boundary layer in water waves. Bull. Earthquake Res.
Imt. 46, 75-123.
KAMPIIUIS, J. W. 1978 Attenuation of gravity waves by bottom friction. Coaetal Engng 2,
111-118.
LAMB, H. 1932 Hydrodynamics, 6th edn. Cambridge University Press.
LAUFER, J. 1950 Some recent measurements in a two-dimensional turbulent channel. J . Aero.
NIELSEN, P. 1979 Some basic concepts of wave sediment transport. Inat. Hydrodyn. and
Hydra&. Engng, Tech. Uni. Denmark, series p p e r no. 20.
TUNSTALL, E. B. & INMAN, D. L. 1975 Vortex generation by oscillatory flow over rippled
surfaces. J. Geophys. Res. 80, 3475-3484.
VAN HOFTEN, J. D. A. & KARAKI, S. 1976 The interaction of gravity waves and turbulent
channel flow. Tech. Rep. Dept. Civ. Engng; Colorado State Univ. Rep. SK10.
S C ~ . 20,277-287.