December 2014 Department for Communities and Local Government
© Crown copyright, 2014
Copyright in the typographical arrangement rests with the Crown.
You may re-use this information (not including logos) free of charge in any format or medium, under the terms of the Open Government Licence. To view this licence,
www.nationalarchives.gov.uk/doc/open-government-licence/ or write to the Information Policy Team, The National Archives, Kew, London TW9 4DU, or email: [email protected].
This document/publication is also available on our website at www.gov.uk/dclg
If you have any enquiries regarding this document/publication, complete the form at
http://forms.communities.gov.uk/ or write to us at: Department for Communities and Local Government Fry Building
2 Marsham Street London
SW1P 4DF
Telephone: 030 3444 0000
For all our latest news and updates follow us on Twitter: https://twitter.com/CommunitiesUK December 2014
3
Contents
Acknowledgments Executive summary Section 1: Introduction
Section 2: Market and planning context
Section 3: Impact of the New Homes Bonus on local authority finances Section 4: Understanding, awareness and views on the New Homes Bonus Section 5: Impact on attitudes
Section 6: Impact on behaviour
Section 7: New Homes Bonus receipts
Section 8: Affordable housing, empty homes and county councils Section 9: Summary and conclusions
Bibliography
Appendix A: Terms of reference of the New Homes Bonus evaluation Appendix B: Background to the analytical work-strands
Appendix C: New Homes Bonus technical advisory group membership Appendix D: Tables of the findings from the survey of planning officers
Appendix E: Interaction of the New Homes Bonus with the Local Government Finance Settlement
Appendix F: Maps of the financial impact of the New Homes Bonus: 2011/12 to 2014/15 Appendix G: Maps of alternative measures for housing need
List of figures
Figure 1: The accumulation of New Homes Bonus payments from 2011/12 to 2014/15 Figure 2: Breakdown of New Homes Bonus Funding from 2011/12 to 2014/15
Figure 3: Overarching logic model for the New Homes Bonus
Figure 4: New Homes Bonus and the plan making process theoretical model Figure 5: New Homes Bonus and planning applications theoretical model Figure 6: Residential planning approvals in England: 2007 to 2014
Figure 7: Total housing starts and completions per quarter in England: 2003-04 to 2013-14 Figure 8: New Homes Bonus payments compared to the total number of new homes: 2011/12 to 2014/15
4 Figure 10: Net financial impact of the New Homes Bonus by individual authority: 2011/12 to 2014/15, %
Figure 11: Net financial impact of the New Home Bonus by type of authority: 2011/12 to 2014/15, %
Figure 12: Net financial impact of the New Home Bonus by type of authority: 2011/12 to 2014/15, £m
Figure 13: Net financial impact of the New Homes Bonus by urban / rural classification: 2011/12 to 2014/15, %
Figure 14: Net financial impact of the New Homes Bonus by urban / rural classification: 2011/12 to 2014/15, £m
Figure 15: Map of the net financial impact of the New Homes Bonus, England 2011/12, % Figure 16: Map of the net financial impact of the New Homes Bonus, England 2014/15, % Figure 17: Net financial impact of the New Homes Bonus on individual authority by
Spending Power: 2013/14 and 2014/15, %
Figure 18: New Homes Bonus as percentage of Spending Power by type of authority: 2013/14 and 2014/15, %
Figure 19: Estimated retained council tax revenue to 2020 from additional homes delivered in 2014/15
Figure 20: British Social Attitudes Survey findings: support and opposition to “more homes being built in your local area”
Figure 21: British Social Attitudes Survey findings: support if the government provided councils with more money to spend on services for each new home built
Figure 22: Amount of New Homes Bonus affordable housing enhancement: 2011/12 to 2014/15
1
Acknowledgements
The department would like to thank members of the external technical advisory group, which was chaired by Nick Markham and set up to help inform the work of the review. Thanks also go to Professor Craig Watson, Dr Aiden While and the team led by the University of Sheffield for carrying out the external research element on
2
Executive Summary
This report provides the findings from a combination of internal DCLG and externally commissioned research and analysis to provide an overall evaluation of the New Homes Bonus in the first four years of its implementation.
Because the Bonus fund has and will continue to increase in value over time, together with time lags in the planning and development processes, the fiscal incentive of the policy will take some time before its full potential can be assessed. As such, this evaluation is only able to evaluate how the policy is beginning to influence attitudes and behaviours at this relatively early stage in the policy. The total size of the annual Bonus fund has increased from £200m in 2011/12 to almost £1bn by 2014/15 as the six years annualised payments per home accumulate over time and as the number of homes has risen. This has resulted in the fund increasingly being financed through a redistribution of local government funding. Assuming a continuation of the current levels of government grant, this is likely to continue to rise to 2016/17 when the full six years’ worth of Bonus payments from the first and subsequent years are realised.
Impact on local authority finances
The financial analysis showed how the Bonus has provided a clear financial incentive for authorities with payments rising in line with the total number of new homes being made available over time. Cash payments were also seen to be increasing for authorities over time as annual payments accumulate from an increasing stock of eligible homes.
In most cases the level of housing growth will be the main driver of the net financial impact of the Bonus on an authority. However other factors such as property values, whether an authority is a district or county, their absolute level of funding etc, will also contribute towards the estimated net financial impact for an authority and these will vary in importance and relevance across different areas and contexts.
The financial impact and subsequent strength of the incentive will vary for different authorities depending on the current and forecast state of their overall finance. This is particularly relevant in the current context of reductions in local government
funding as part of the government’s deficit reduction programme.
In percentage terms, net financial impacts from the Bonus were much less significant for those authorities facing negative impacts and much more substantive for those seeing positive impacts. The increasing size of the overall Bonus fund and an
increasingly reliance on financial redistribution means there has been a shift from all authorities being better off under the policy towards a mix of around three quarters being better off and the remainder being worse off in net financial terms by 2014/15. The size of these impacts both positive and negative, have also continued to grow over time.
In terms of impacts by type of authority, shire districts were the highest net
3 become worse off in net financial terms in recent years. Rural authorities were seen to be seeing slightly better financial impacts than their urban peers.
In terms of the geographical distribution of impacts, there was a clear band of the highest positive impacts on a broad belt of authorities around London and the wider south east. The most negative impacts were seen in authorities in the north of England and Yorkshire and the Humber. Impacts on authorities in London were more mixed with some of the highest positive and negative impacts. This broad pattern was seen to be largely maintained over the study period, though the size of these impacts, both positive and negative, were increasing and deepening over time. The geographical analysis also found that, looking across different measures of
housing need, broadly speaking the financial impacts of the Bonus appear to largely be matching the distribution of housing need, though there were some areas of mismatch, in particular for London authorities.
In relation to overall local authority spending power, the analysis showed that
impacts varied significantly across authorities, both in terms of whether such impacts were negative or positive and in terms of their size. In comparison, negative impacts in relation to spending power were seen to be more modest with these authorities facing negative impacts of a maximum of 1.4% of spending power by 2014/15. It was also noted that recent changes to local government finance meant there was now a higher financial benefit and subsequent enhanced fiscal incentive from
retained council tax revenues on new homes which further encourages authorities to facilitate housing growth.
Impact on attitudes and behaviour
The survey of planning officers found that there was a very high level of
understanding and awareness of the Bonus and it was seen to be relatively easy to calculate. The external research taken together across a range of respondents (officers, member, housebuilders, community groups etc) found the Bonus was viewed as being simple, transparent and flexible. Officers and members were also found to be very well informed of the financial implications of the Bonus for their authority.
Almost half of all planning officers agreed the Bonus is a “powerful incentive”, with the external researchers stating that a further quarter were likely to be withholding their views as it was too soon to say. Around 40% also agreed the Bonus had resulted in officers and their elected members being more supportive of new homes, though this was found to be much less the case in the wider community where only 10% of planning officers agreed the Bonus had begun to increase support for new homes for this group. More broadly however the British Social Attitudes survey showed there had been a substantial drop in public opposition to new homes from 2010 to 2013.
4 In terms of impact on behaviour, 31% of officers felt the Bonus had contributed to a more strategic and co-ordinated approach to housing provision. The research also found that senior officers and members were taking greater interest in strategic decisions about planning for housing as a result of the Bonus.
The Bonus was so far found to be having only a modest direct impact on Local Plan making. Although recognising the Bonus was just one of a number of factors
influencing the number of new homes in Local Plans, only 11% of officers agreed it had been an “important influence on the number of new homes proposed or
adopted” in their Local Plan, and few felt it was a “significant factor” in the consultation and discussion of Local Plans so far.
Similarly the Bonus was seen to be having only a limited role and impact on planning applications and decisions. Just over a third of planners stated they took into
account Bonus receipts when considering planning applications, with over half
saying they never took such receipts into account. There were also only a very small number of authorities using Bonus receipts to spend on activities that might be
directly related to developments, and as such there was limited potential for the Bonus to be seen as a “material consideration” when making a decision.
Local authorities were making clear use of the flexibilities in the spending of Bonus receipts to fund a wide range of activities. Receipts were largely being used to support authorities’ general fund or core services however there were numerous examples of receipts being used to directly support housing growth. There were also some innovative uses of the receipts such as authorities using the Bonus to build up a flexible fund over time to help plug funding gaps when they arose and to
complement other funding sources.
There was uncertainty expressed by some authorities around the future level of government grant and the long term future of the policy which was leading to a cautious approach to the use of Bonus funds. There was also limited evidence that authorities were raising awareness of the Bonus within the community, or
communicating what activities and services the fund was being spent on. Although there were some examples where a proportion of the fund was being devolved directly to community groups, there were questions generally as to the extent to which Bonus receipts were being spent “in line with local community priorities” as was intended by the policy.
New Homes Bonus receipts
Although there were numerous examples where Bonus receipts were being used to support the delivery of affordable housing, the research did not find evidence the Bonus and its’ accompanying affordable housing enhancement was providing an additional incentive in increasing support specifically for more affordable homes. Almost half of all officers agreed the Bonus had helped to reduce the number of empty homes, and there were a number of examples where Bonus receipts were being used to further reduce empty homes, potentially bringing about further future Bonus receipts from empty properties being brought back into use.
5 authorities and it has not led significantly to better communication, negotiation and strategic coordination between district and county councils. There were also marked differences between county councils and districts in two tier authorities in terms of their satisfaction with the allocation of Bonus receipts between county and district councils.
Conclusions
There was evidence the Bonus had significant potential in meeting its aim of helping to facilitate housing growth, in particular since almost half of planning officers agreed the Bonus was a “powerful incentive”. Although there was evidence the policy was beginning to impact positively on attitudes, the impact has been more limited in relation to plan making or planning decisions so far.
There were also positive aspects in terms of the policy contributing to a more strategic and co-ordinated approach to housing provision, and the Bonus was seen as part of a number of factors and government measures that together were
encouraging and supporting a more proactive approach to house building.
Since the positive financial impacts from the Bonus were seen to be proportionately higher than the negative impacts, this may suggest the policy is likely to more readily incentivise and encourage higher growth authorities to increase growth further. Although the external researchers found the policy was delivering to the key stated policy principles of being “powerful”, “simple”, “transparent” and “flexible”, there were some questions raised around the extent to which the community was aware of the Bonus and what it was being spent on.
6
Section 1: Introduction
The New Homes Bonus policy
1. In February 2011, following the consultation on the government proposals for the New Homes Bonus (the “Bonus”)1, the government published its final scheme design for the policy2. The aim of the Bonus is to provide a financial incentive to reward and encourage local authorities to help facilitate housing growth. The five key stated principles of the policy3 are that is should be:
(i) a powerful incentive;
(ii) simple in terms of understanding and implementation;
(iii) transparent in terms of its recognition, significance and rewards from growth; (iv) predictable in terms of expected future funding and perception of being a
permanent feature of local government finance and;
(v) flexible in terms of how receipts are spent and spent in line with the wishes of the local community.
2. The Bonus is a grant paid by central government to all upper and lower tier councils to incentivise them to increase the number of available homes. Each additional home added to the council tax base, after deducting demolitions, results in an authority receiving an annual Bonus payment. Payments are based on the national average council tax band relevant to each property, and are paid annually for six years. The payment recognises newly built properties and conversions as well as for bringing long term empty properties back into use. There is also an additional payment for each affordable home delivered of £350 per year, again paid for six years. For areas jointly governed by district and county councils the Bonus is split, with 80 per cent paid to the district council and the remaining 20 per cent going to the county council. In London all Bonus receipts are allocated to the respective local authority.
3. The first payment of the Bonus was made to local authorities in the financial year 2011-12 when the grant was funded entirely from central government (around £200m). In each subsequent year central government have contributed £250m to the grant with the remainder being funded by redistribution from the local government finance settlement4.
4. Bonus payments are “non-ring fenced” meaning they can be spent by authorities as they see fit, although councils are expected to spend receipts “in line with the wishes of the community”.
1 DCLG, “New Homes Bonus: A consultation” (November 2010) 2 DCLG “New Homes Bonus: Final scheme design (February 2011)
3 DCLG “New Homes Bonus: Final scheme design (February 2011), Page 7,
7 5. Figure 1 shows how the Bonus is building up incrementally over time as initial
Bonus payments continue to be made in later years and as further increases in new homes are delivered and rewarded each year.
New Homes Bonus and the Local Government Finance
Settlement
6. For each year where the cost of the Bonus fund is estimated to exceed £250m the government will hold back from the local government spending control total the level of funding it estimates will be required to meet the overall New Homes Bonus fund.
7. Figure 2 illustrates the amounts and proportions of the New Homes Bonus grant comprised of central government funding and redistribution from the local
[image:11.595.42.554.170.317.2]government finance settlement.
Figure 1: The accumulation of New Homes Bonus Payments from 2011/12 to 2014/15
Cumulative Payments 2011/12 2012/13 2013/14 2014/15
Year 1 (Oct 2009-10) £199m £199m £199m £199m
Year 2 (Oct 2010-11) £232m £232m £232m
Year 3 (Oct 2011-12) £236m £236m
Year 4 (Oct 2012-13) £249m
Actual (Years 1,2,3 &4) £199m £432m £668m £917m
Y
e
a
r of de
li
ve
8
The New Homes Bonus evaluation
8. Following the implementation of the Bonus in 2011, DCLG analysts carried out monitoring of the policy, including two annual online surveys with local authorities in 2011 and 2012. When the policy was announced, the government committed to undertaking an interim review in 2013/14. The review was timed to allow time for the policy to bed in.
9. An internally led evaluation of the Bonus was commissioned in the summer of 2013. The overall aim of the evaluation was to assess the extent to which the Bonus, to date, has been an incentive to encourage and facilitate local housing growth. This report presents the findings and represents the conclusion of that work.
10. The primary focus of the evaluation was the impact on attitudes and behaviours towards housing growth as a consequence of implementing the Bonus in
England, including on local authority officers, councillors and the community. 11. The internally led evaluation involved a combination of internal and externally commissioned research and analysis across the following five work-strands:
i. Logic model: In-house mapping of how in theory the Bonus is likely to impact on and influence attitudes and behaviours of key agents within the planning system ;
ii. Independent external research on attitudes and behaviour: External research commissioned by DCLG to assess the level of understanding and awareness of the Bonus and how and to what extent it is impacting on attitudes and behaviour;
9 iv. Local government financial analysis: An in-house analysis of the net
financial impact of the Bonus on individual authorities and;
v. Internal analytical synthesis: A final synthesis of the evidence across all the above work-strands into this overall report.
12. The terms of reference for this evaluation is provided in Appendix A. Appendix B provides a detailed description of the methodologies used across the work-strands as well as a number of other issues relevant to the respective analyses.
13. The work of the review was informed by an external technical advisory group chaired by Nick Markham, a DCLG non-executive director. The group comprised experts from the planning, local government finance, housing and house building sectors, as well as colleagues at the Cabinet Office’s Behavioural Insight Team. A list of the members of the advisory group is provided in Appendix C. The group provided comments on the overall approach to the review, key inputs (such as questionnaires, topics guides) and the
presentation of emerging findings (including comments on draft outputs).
External research commission
14. A consortium led by the University of Sheffield were commissioned in January 2014 to undertake a combination of qualitative and quantitative research into the impact of the Bonus on the attitudes and
behaviours of key actors such as local authority officers and elected members, house builders and community groups. The specific objectives were to provide evidence on:
(i) understanding and awareness of the policy, including its potential and actual financial impact for local authorities;
(ii) how, and to what extent the Bonus has influenced local authority attitudes towards new homes;
(iii) how, and to what extent the Bonus has influenced behaviour and decision making that may impact on the number of new homes being made available and;
(iv) how the Bonus has beenimplemented, including how the receipts have been spent.
10 elected members outside of the case study areas, five interviews with national house builders / planning consultants and a couple of interviews with members of the Planning Inspectorate.
16. Tables setting out the findings from the survey of planning officers are provided in appendix D.
A theoretical approach to the New Homes Bonus
17. Figure 3 provides a simplified schematic of the overarching “logic model” of how, in theory, the Bonus is designed to incentivise attitudes and behaviours in local government (activities), which in turn will impact on the numbers of new homes built (outputs), which may in turn eventually impact on overall housing
affordability and availability (long term outcomes).
The New Homes Bonus financial impact on the local authority
18. The New Homes Bonus is a financial incentive aimed at encouraging local authorities to help facilitate housing growth. The transmission of this incentive through a local authority will involve a dynamic process of interactions between a wide range of agents (for example, officers, directors, members, chief executive officer amongst others), across a range of policy areas (such as finance, housing, planning, regeneration). For example, at the strategic level the Bonus may
influence discussions about corporate plans and “medium term financial strategies”, as well as the Local Plan, the housing strategy etc.
19. The extent to which the Bonus impacts on overall housing growth will very much depend on the outcomes from these key processes. The strength of the
11 authority and the significance of the financial impact of the Bonus on that overall position. The effects of this may be particularly relevant in the context of current reductions in local government funding as part of the government’s deficit
reduction strategy. Other key factors likely to influence the strength of the incentive effect on councils include local opportunities and constraints, such as the state of the local housing market and its ability to support any increase in housing supply.
20. The main operational mechanism through which an authority can influence housing development and subsequent Bonus receipts is the planning system.
The New Homes Bonus and the Planning System
21. Figure 4 below illustrates how, in theory the New Homes Bonus could influence the attitudes and subsequent behaviours / decisions of key actors (for example, planning officers, members, community, house builders, amongst others) through the Local Plan making process. In principle the existence of the Bonus should encourage local planning authorities to allocate land for housing through plans, although this is against the backdrop of authorities also being required (by the National Planning Policy Framework) to identify and plan for the housing needs of their areas so far as possible.
12 policy began to be implemented in 2011/12. To this extent the Bonus should be considered a long term policy mechanism which will, in some places, take time before its influence is fully realised.
23. The prospect of receiving a Bonus is, in principle, capable of being taken into account as a ‘material consideration’ in determining a planning application. Whether potential Bonus payments are in fact a material consideration in relation to a particular application will depend on whether those payments would be used in a way which is connected to the application and to the use and development of land.
24. For example, potential Bonus payments could be a material consideration if they were to be used to mitigate impacts resulting from development. But if the use to which the payments are to be put is unclear or is for purposes unrelated to the development concerned a decision maker would not be entitled to take them into account when making a decision on a planning application.
25. Figure 5 illustrates how the New Homes Bonus may influence the attitudes and behaviours of key actors within the planning application and decision making process.
13 economy and housing market, wider planning reforms, house builder confidence and changes in the state of local government finances amongst others. The National Audit Office in their report5 into the Bonus concluded (para 1.25) “It is not possible to separate out the impact of the Bonus from other policies and wider factors affecting housebuilding. Neither is it possible to robustly assess what the housing supply would have been without the Bonus.”
27. Finally, the New Homes Bonus is still at a relatively early stage in terms of the size of the financial incentive involved. Because increases in housing stock receive Bonus payments for six years, the amount of payments gained will accumulate over time as more homes are added in each financial year.
Consequently, an increasing amount of Bonus payments will also be derived from the redistribution of local government funding. As we are only four years into the programme the full effects of the policy are yet to be seen.
14
Section 2: Market and planning context
28. This section provides some wider context to help inform the assessment of the impact of the Bonus since the first payments were made in the financial year 2011/12. In particular, it looks at recent trends in planning approvals and subsequent housing outputs.
[image:18.595.93.547.312.559.2]29. Figure 6 illustrates the volume of residential units granted planning permission on both major and minor sites from the second quarter of 2007 to the end of 2013. The number of homes permitted for development fell following the financial crash in 2008 to mid-2009. Permissions then stabilised over the period to mid-2012 before rising.
Figure 6: Residential planning approvals in England: 2007 to 2014
Source: DCLG analysis of Glenigan data
30. Figure 7 illustrates how housing starts also declined following the financial crash in 2008, bottoming out in 2009 before recovering for a while and levelling off at around 25,000 starts a quarter between 2010-11 to 2012-13. Housing
15
Figure 7: Total housing starts and completions per quarter in England: 2003-04 to 2013-146
31. The New Homes Bonus was introduced on the back of very challenging housing market conditions following the financial crash of 2008. The statistics show that the market has subsequently stabilised with some positive signs of recent recovery.
32. As mentioned in the previous section, the New Homes Bonus is a long term policy mechanism that will take time to realise its full potential and influence in some areas than in others. It is therefore likely to be some time before the policy begins to make a measureable impact on actual planning approvals and
subsequent housing starts and completions. It is also important to note that given the number and interaction of factors involved, it is not possible to
disentangle and specifically identify the separate contribution the Bonus has had and will have on such measures.
16
Section 3: Impact of the New Homes
Bonus on local authority finances
Introduction
33. This section provides the key findings from the DCLG in-house analysis of the financial impact of the New Homes Bonus on local authorities from the
introduction of the policy in 2011/12 to the latest allocation in 2014/15. The analysis considered:
The extent to which the Bonus provided a fiscal incentive for local authorities to increase housing delivery and;
How the Bonus has impacted upon the finances of individual authorities’, and across different types of authority and geographical areas.
34. The focus of the analysis is net financial impact on local authorities as a result of:
New Homes Bonus payments funded by the £250m per annum grant; and
The redistribution of local government funding
35. In order to assess net financial impact of the Bonus it is necessary to compare, for each authority, their financial position as a result of the policy with an estimate of what this would have been in the absence of the policy – what is commonly referred to in evaluations as the “counterfactual”.
36. This analysis assumes a counterfactual where, in the absence of the policy there would have been no redistribution of local government funding and no New Homes Bonus grant going to local government from central government. Further details of the interaction of the New Homes Bonus with the local government finance settlement, the calculation of the counterfactual and the analysis undertaken are provided in appendix B.
The fiscal incentive of the New Homes Bonus
17
Impact on individual authorities
38. There are a number of factors that will affect the net financial impact of the Bonus on local authority finances. The variables include:
The level of housing growth – Housing growth for the Bonus is measured by calculating the net change in the housing stock from year to year resulting from the building of new homes, conversions, empty homes returned to use, but also takes into account reductions due to demolitions and conversions that reduce the number of homes;
Property values - Bonus payments are calculated by the national average council tax for properties within the relevant council tax band (as at 1992). So higher priced areas will mean more properties in higher council tax bands and higher subsequent receipts;
Whether an authority is a shire county or district - in two tier areas 80% of payments go to the shire district with the county receiving the remaining 20%;
18
Level of redistribution required from local government funding – the greater the Bonus in any year the greater the need to redistribute funds from the local government finance settlement. As the upper tier element of the local government finance settlement is larger than the lower tier element, holding back funding for redistribution has a greater cash impact on upper tier authorities, such as shire counties.
39. In most cases the level of housing growth, and new house building in particular, will be the main driver of Bonus payments received by an authority. However, it should be noted that the actual net financial impact will be the result of a
combination of different variables which will vary in importance and relevance across different authorities and contexts.
40. In particular, for some shire counties, there may be overall increases in their housing stock resulting in their districts reviving increased funding, but they may receive less funding. This would be as a result of the New Homes Bonus
payments system requiring a redistribution of the local government finance settlement providing 20% of the Bonus payments to shire counties.
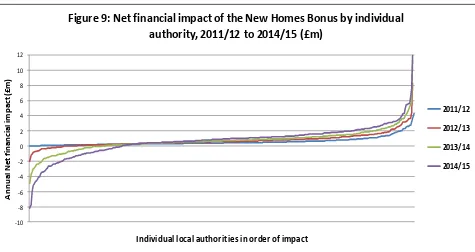
41. Figure 9 illustrates the estimated net financial impact of the Bonus on all individual authorities in England over the first four years of the policy’s
implementation in each individual year from 2011/12 to 2014/15. By “net financial impact” we mean the difference in the amount of funding the authority would have received through the local government finance settlement in the absence of the policy. A positive (negative) net figure indicates an authority is better off (worse off) by a given amount in any particular year, compared to the counterfactual. 42. Figure 9 shows how the profile of net fiscal impacts on individual authorities has
changed over time. In 2011/12 when there was no redistribution from the
financial settlement, the top three “outlier” authorities were considerably better off (by between £3.2m to £4.3m), a small group of around ten authorities were
significantly better off (by between £2m and £2.7m), with a long tail of positive and relatively neutral net impacts for the remaining authorities.
19 -10 -8 -6 -4 -2 0 2 4 6 8 10 12 A n n u a l N et fin a n ci a l i m p a ct (£m)
[image:23.595.66.541.106.358.2]Individual local authorities in order of impact
Figure 9: Net financial impact of the New Homes Bonus by individual authority, 2011/12 to 2014/15 (£m)
2011/12
2012/13
2013/14
2014/15
20 45. Overall, the distribution of impacts has shifted, with the size of the absolute
financial impact increasing over time for both those gaining under the policy and those worse off. In percentage terms, the impacts were much less significant for authorities facing negative impacts than for those authorities seeing positive net impacts. Whilst there is an increasing net financial impact over time for both those facing net positive and negative impacts, in percentage terms losses were seen to be much less significant in comparison to the gains.
Impact by type of authority
746. Figures 11 and 12 illustrate how net financial impacts vary by different types of authority and how these impacts have changed over the study period in
percentage terms and in terms of aggregate amounts. Figure 11 shows how shire districts as a group have continued to receive by far the greatest positive net impacts from the policy over the study period, and these impacts have increased significantly year on year. This reflects the fact that shire districts deliver the bulk of new homes making up around 42% of total homes recognised in the 2014/15 Bonus allocation as well as recognising that the increased funding is on top of a relatively low starting baseline.
47. London authorities and shire unitaries as a group also saw positive net impacts over the period, though these were at a much lower level compared to shire
21 districts and more stable over time. By contrast, shire counties as a group have begun to see small percentage negative net financial impacts in later years and these have also increased over time. The small percentage negative impact on shire counties is driven by their relatively high funding baseline. Metropolitan districts have begun to see negative net impacts in the last two years.
48. Figure 12 shows that in terms of net financial impact in aggregate value, shire districts as a group also received the largest net positive impact from the policy, and that these have also increased significantly year on year. The estimated total value of net positive financial benefits for this group of authorities rose from just over £50m in 2011/12 to just over £250m by 2014/15. Shire unitaries without responsibility for fire services were the group with the next largest net positive impact from the Bonus, rising to just over £50m by 2012/13, though falling back somewhat in the following two years to around £44m by 2014/15. In terms of negative net financial impacts, again as a group metropolitan districts and shire counties with and without fire responsibilities have begun to see negative
22 49. Figures 13 and 14 illustrate how net financial impacts varied grouped by urban
and rural authorities, first by percentage impact and then by aggregate value. Overall in percentage terms rural authorities are seeing slightly better net
23 50. In terms of the aggregate value of net impacts by types of authorities, Figure 14
illustrates how aggregate net financial impacts for “predominantly rural shire districts” have been higher in each year than for “predominantly urban shire districts”, rising to around £120m for such rural shire districts by 2014/15. The chart also shows more starkly the fall in the amount of positive net impacts for “predominantly urban unitaries” from around £100m in 2011/12 to just over £20m by 2014/15, compared to the rise in aggregate impacts for “predominantly rural unitaries” increasing from just under £14m in 2011/12 to £27m by 2014/15.
Impact by geography
51. The analysis also estimated the net financial impact of the Bonus by local authority area across the study period. For the purposes of this mapping exercise, funding for counties was redistributed throughout the local authority areas within their boundaries. The full range of maps of net financial impacts is provided in appendix F. Net impacts for the first (2011/12) and last years (2014/15) of the study period are illustrated and described below.
52. Figure 15 illustrates the distribution of the net financial impacts of the Bonus across England for 2011/12. This first year in the Bonus did not involve any redistribution of funds from local government funding, so all authorities were better off in with positive net impacts. The map shows some of the highest
24 authorities down through the East Midlands and pockets around York, in
Shropshire and west Suffolk and Norfolk. The lowest positive impacts were spread through a number of authorities across the north west of England, pockets of authorities in the north east and in and around Yorkshire and a number of boroughs throughout London.
25 54. Figure 16 illustrates how both the level and distribution of impacts by authority
had changed by 2014/15. By looking across the maps for each year over the study the pattern of impacts did not vary significantly. By 2014/15 the
26 55. When Figure 11 and 16 are considered together, it is clear in two tier authorities
that positive net impacts can flow across a county area overall, whilst impacts may vary between the respective shire district and shire county.
Comparison of New Homes Bonus with housing need
56. Although it is not an explicit objective of the New Homes Bonus to specificallyincentivise properties to be built in areas of highest housing “need”, the analysis did explore the broad patterns of impacts of the Bonus against measures of “housing need”. Whilst there is no formal agreed measure for housing need, three measures were agreed with members of the external technical advisory group to provide a range for comparison. Appendix G provides three maps providing three different measures of housing need:
(i) Ratio of median house prices to median incomes;
(ii) Number of households in temporary accommodation per 1,000 households and;
(iii) Annual projected change in population from 2011 to 2021.
57. In terms of comparing net impact from the Bonus and housing affordability (the ratio of house prices to incomes – Figure G1), there is a significant broad overlap with a number of authorities in a commuter belt around London facing high
affordability ratios whilst being amongst those benefiting the most from the
Bonus. This was less the case in London where high affordability ratios were not matched by the highest positive impacts from the Bonus. There were also some similarities in the distribution of lowest affordability ratios in authorities
throughout the north west and north east of England, who were also often facing the highest negative impacts from the Bonus.
58. Using the distribution of households in temporary accommodation as a measure of housing need (Figure G2) shows that authorities within a wide commuter arc around London saw high proportions of households in temporary
accommodation and also were amongst the highest positive net beneficiaries from the Bonus. Again, this was less the case for London where the highest levels of temporary accommodation were not matched by the highest positive impacts from the Bonus. However, it was the case that those authorities in the midlands and the north of England who were facing the highest negative impacts from the Bonus also had amongst the lowest proportions of households in
temporary accommodation.
27 negative impacts from the Bonus. There was also significant overlap between commuter areas outside of London, and in particular through the central and east midlands and towards Cambridgeshire. Again, there was less of a relationship between authorities in London where projected growth in
populations was amongst the highest in the country, compared to the impacts of the Bonus which were more mixed.
60. Whilst we might expect the number of new homes and therefore the Bonus to be strongly correlated with housing need, this will not necessarily be the case. The Bonus is only one of a complex interplay of factors which influence housing growth and these factors will also vary in importance and relevance by authority. Some authorities may for example face constraints on land and housing supply and this is likely to be the case in areas such as London.
61. Nonetheless, looking across these three measures of housing need, the financial impacts of the Bonus appear to largely be matching the distribution of housing need, though there are some areas of mismatch, in particular for London authorities.
Impact on overall Spending Power
62. In order to provide a wider perspective of significance of the Bonus on overall local government finances, the analysis also estimated net impacts as a
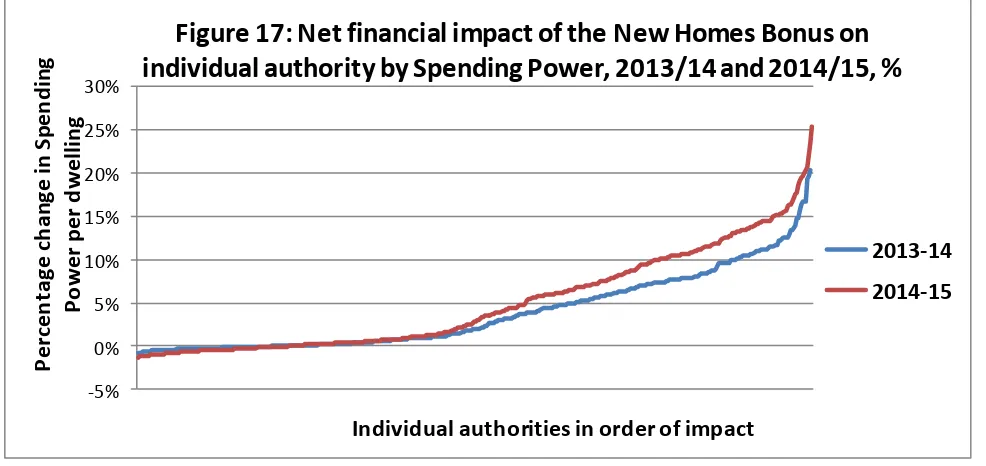
percentage of overall individual authority “spending power” 8. Spending power is the overall level of funding made available for local authority services, including council tax, locally retained business rates and central government grants. 63. Figure 17 illustrates the estimated absolute net financial impact of the Bonus on
spending power for all individual authorities in England for 2013/14 and 2014/15. By “net financial impact” we mean the estimated change in the authority’s
spending power per dwelling compared to what it would have been in the absence of the policy. So a positive / negative net impact will mean they are better off / worse off by this proportion of their financial position in the absence of the policy.
64. By 2014/15, for around a half of all authorities, the impact of the Bonus was an increase in their spending power per dwelling by over 5% and a very small number of highest growth outlier authorities seeing impacts as a percentage of spending power of up to a maximum of around 25%. It is worth noting that for the minority of authorities facing negative impacts, the percentage impact was much less pronounced than for those facing positive impacts, with those authorities losing the most facing a reduction in their spending power per dwelling of just 1.41%.
8 The analysis of spending power was only able to be undertaken for the 2013/14 and 2014/15
28 -5% 0% 5% 10% 15% 20% 25% 30% P er cen ta g e ch a n g e in S p en d in g P o w er p er d w el li n g
[image:32.595.59.552.96.329.2]Individual authorities in order of impact
Figure 17: Net financial impact of the New Homes Bonus on
individual authority by Spending Power, 2013/14 and 2014/15, %
2013-14
2014-15
65. Figure 18 uses a “box and whisker plot” to illustrate in more detail the level of spending power that is comprised of New Homes Bonus payments by different types of authorities. The upper and lower points of the “whisker” represent the minimum and maximum value, the centre line the average, and the top and bottom of the box the upper and lower quartiles.
66. The chart shows the most significant and positive impacts being derived by shire district councils, though there is significant variation, from a high of over 25% of spending power in 2014/15 to a low of around plus 2.5%. As a group shire counties by 2014/15 were seeing the smallest net impact from the Bonus, with the other groups of authorities seeing the New Homes Bonus comprise between 0-5% of their overall spending power.
29
Additional incentives from council tax receipts for new
homes
68. In addition to the financial impacts observed above, recent changes in local government finance have also increased the financial benefits for authorities from new house building.
69. Prior to 2014/15 the calculation of the local government finance settlement has either taken into account actual changes in the council tax base, or forecast changes for where there has been a multi-year settlement, when assessing the relative resources of a local authority.
70. This equalization meant that increasing housing supply effectively reduced the level of support through the local government finance settlement. Therefore under the system prior to business rates retention a local authority did not receive on-going financial benefit for increasing the number of dwellings in their area. 71. Under the business rates retention system the starting position was fixed in 2013/14 for seven years based upon a similar formula to the previous system. Therefore 2014/15 was the first year in which local authorities would benefit from not having their local government finance settlement adjusted downwards to take into account the increase in their resources as a result of an increase in council tax from new dwellings.
30 73. By way of illustration Figure 199 illustrates the estimated increase in council tax
revenues for each authority in England from 2014/15 that can now be retained by authorities until 2020 without having their local government finance settlement adjusted downwards to take into account the increase in their resources. So for example, the highest housing growth authority that delivered around 3,000 additional homes relevant for 2014/15, is estimated to be able to retain over £3m in council tax revenue without having their local government finance settlement adjusted downwards to take into account the increase in their resources. All of these revenues are additional to any receipts derived from the New Homes Bonus.
9
31
Section 4: Understanding, awareness and
views on the New Homes Bonus
Introduction
74. This and the subsequent sections are largely based on evidence derived from local authorities within the external research led by the University of Sheffield into the impact of the Bonus on attitudes and behaviours. Appendix B provides some more detail on the scope and methods used in the external research.
75. Three of the stated principles of the Bonus are that it is “simple”, “transparent” and “flexible”. The external research found that “taken together, the survey and qualitative evidence suggest that the New Homes Bonus is viewed as being simple, transparent and flexible” and that “relevant officers (planning, housing and finance), senior leadership teams and key elected members (leaders, chairs of planning committee) are generally well informed about the New Homes Bonus and its financial implications.”
Understanding and awareness
76. The online survey of local planning officers found that almost all (98%) of respondents agreed they had “a good understanding of the New Homes Bonus and its role in helping to facilitate growth”. There was also a very high
understanding of the financial implications of the Bonus with 86% of officers agreeing that they had “a good understanding of the likely overall impact of the New Homes Bonus on the finances of my council” with only 4% disagreeing. 77. Three quarters (75%) of officers agreed that it was “relatively simple to calculate
the revenue that would derive from the New Homes Bonus”, with only 12% disagreeing.
78. The researchers found a good understanding of the Bonus both within planning, housing and finance departments and at the Chief Executive level and that senior officers were well informed and engaged with the Bonus across all the case study areas. Although in most cases understanding of the Bonus by elected members was found to be good, it was found to vary within councils, with key cabinet members and those members closest to planning and housing services having the best understanding.
32 statement and around 30% not giving a view either way. The case study
research found that understanding of the Bonus was highest for major house builders and planning consultants, some of whom have developed strategies for drawing attention to the Bonus receipts that would derive from their proposed development in negotiations with local authorities. In one case study area a developer saw the Bonus as a way of articulating the financial benefits of
development. In some areas there were examples of applicants putting forward information on Bonus receipts as part of their planning application material. Awareness and references made to the Bonus were, however found to be more mixed amongst smaller local and regional house builders / applicants.
80. All authorities in the case studies felt understanding and awareness of the Bonus within the wider community was very low or limited. In some cases this was felt to be the case because councils had not carried out publicity or communication work about the Bonus with residents. There were some examples where the Bonus receipts from development had gained some local press coverage, where councils had mentioned Bonus receipts within press notices and when some community groups were encouraged to bid for a share of receipts. There were also some instances where applicants were referring to Bonus receipts in their pre consultation engagement with local residents.
The New Homes Bonus as a “powerful incentive”
81. Another key stated principle of the Bonus is for it to be a “powerful” incentive to help facilitate housing growth. In the online survey officers were asked to what extent they agreed or disagreed that the Bonus was “a powerful incentive for my council in helping to facilitate housing growth”. Around half (49%) of all officers agreed that the Bonus was a powerful incentive, with only a quarter disagreeing and a further 22% neither agreeing nor disagreeing. Agreement varied
somewhat by different types of authorities with those “pro-development housing growth”10 areas and rural areas most likely to agree (66% and 60% respectively). County Councils were least likely to agree with more of these councils
disagreeing (46%) than agreeing (31%). Views were less marked in authorities categorised as being in “high demand areas with a cautious planning stance” and in London metropolitan areas, however even here there were found to be more respondents agreeing than disagreeing (43% and 44% agreeing respectively). Respondents in areas with high Bonus receipts per capita tended to be more positive about the power of the policy with 62% of those in the highest quartile of receipts agreeing.
82. Of those authorities who neither agreed nor disagreed that the Bonus “is a powerful incentive”, the researchers felt, from the case study research that many of these responses “might reflect the view that it is too early for those
respondents to make a clear assessment”.
33
Section 5: Impact on attitudes
Introduction
83. We illustrated in the logic model in section one how the Bonus could influence the attitudes of key actors (council officers, elected members, house builders, the community, etc.) at different points throughout the planning system. This section provides evidence from the external research on how the Bonus is beginning to impact on attitudes in practice.
Impact on support for new homes
84. In the survey planning officers were asked to provide views on the extent to which they thought the Bonus was beginning to impact on attitudes towards new homes within their respective authorities.
85. The researchers found the survey findings “suggest that the New Homes Bonus is helping to slightly increase overall support for new house building in a large number of local authorities”. There were slightly more officers agreeing that the Bonus “has helped increase overall support for new homes being built in my council area” (39%), compared to those disagreeing (37%) and the remainder (23%) neither agreeing nor disagreeing.
86. Agreement varied depending on the extent to which authorities were benefiting from receipts, with those in the highest quartile of Bonus receipts with higher agreement (37% for the highest quartile of receipt authorities, and 56% for the next highest) compared to those authorities in the lowest quartile of receipts (just 28% agreement for the lowest, and 24% for the next highest quartile authorities). 87. Planning officers were also asked if the Bonus had resulted in their elected
members being more supportive of new house building. More authorities agreed (39%) than disagreed (33%) that the Bonus had made members more
supportive.
88. Authorities were also asked about the impact the Bonus has had to date on overall support for new homes specifically “within the local community”. Perhaps reflecting the low / limited levels of awareness and understanding of the Bonus within the community touched upon in section four above, only 10% of authorities agreed the Bonus had increased support for new homes within the local
34
The attitudinal change process
89. The external researchers noted that there were a considerably higher number of planning officers who perceived the Bonus to be a “powerful” incentive, than believed it to have affected attitudes towards new homes. For example, only two thirds of those who agreed the Bonus was a powerful incentive also agreed it had so far helped to increase overall support for new homes. Drawing on evidence from the case studies, the authors suggest that this may point to a time lag between policy implementation and this feeding through to attitude change (and subsequent behaviour). They note that the numerous interviews with a range of actors across the case study areas stated the policy was still very much bedding in and that “attitudes and behaviours are still evolving”.
90. The researchers also noted that all of the 12 case study areas stated they had become increasingly accepting of housing development over the previous five to ten years. As such the researchers found that “the New Homes Bonus is part of a number of factors that are encouraging and supporting a more proactive approach to new house building” and that there was a “degree of support for the New Homes Bonus principle that new housing provision should be incentivised and rewarded through a funding Bonus”.
91. The case studies frequently made clear that the Bonus was not seen to be acting in isolation but instead was seen as part of a package of pro-development policy changes. In this regard the Bonus was perceived not to be directly and
significantly shaping attitudes so far, but it was seen as a contributory factor and was helping to reinforce attitudinal shifts towards new homes. In some cases the financial contribution was seen to have helped build political support for (and ease resistance to) a more supportive and proactive approach to new housing delivery. The Bonus was also seen to be widening and sharpening a more strategic debate within authorities about new housing.
Wider public support and opposition to new homes
92. In order to provide some wider context in terms of public attitudes to new homes over the study period, the evaluation draws on findings from a question asked in the British Social Attitudes survey in 2010 and 2013. The surveys asked
respondents about the extent to which they were supportive or opposed to “more new homes being built in your local area”. Although the findings cannot be
directly attributed to government policy or specifically the New Homes Bonus, the findings do provide a helpful context to shifting public attitudes over the
evaluation study period.
35 supportive). However by 2013 this had turned around with more respondents now saying they are supportive of new homes than opposed (47% supportive compared to 31% opposed). Support increased across all key households types and geography.
94. It is also noteworthy that support has shifted most significantly at the extremes, with those strongly opposed dropping by about a half (from 15% down to 8%) and those strongly supportive doubling (from 5% to 11%). There continues however to be a sizable group who have no view either way (20%).
37
Section 6: Impact of the New Homes
Bonus on behaviour
Introduction
96. Building on the evidence illustrated in the previous section on impact of the Bonus on attitudes, this section sets out evidence on the subsequent impact the Bonus is beginning to have on the behaviours and decision making of key actors. 97. The external researchers explored in both the survey of local authorities and the
case study analysis the extent to which the Bonus has impacted to date on behaviours within both the plan making process and in the context of making decisions about individual planning applications.
Impact on strategy and the plan making process
98. There was evidence, both in the survey and case studies that the Bonus has begun to have an impact on broader strategic thinking about housing provision and the external researchers found that “senior Executive Officers and Elected Members are taking greater interest in strategic decisions about planning for housing as a result of the NHB”. One case study felt that the Bonus had “perhaps reinforced the direction of travel in terms of making links between housing, planning and finance”. In the survey 31% of planning officers agreed that the Bonus “has contributed to a more strategic and coordinated approach to new housing provision” with 43% disagreeing.
99. While the financial implications of the Bonus on authorities may be resulting in increased dialogue between senior colleagues across different policy areas of the authority (finance, housing, planning etc), there is a question as to the extent to which this is translating into impacts on behaviour within the planning system. 100. As illustrated in the logic model in section one, the plan making process can
take a number of years to progress from the pre-production stage to formal adoption. This means the ability of the Bonus to have impacted on local plans from the implementation of the policy in 2011/12 depends on what stage
individual authorities were at in the plan making cycle. Additionally, the Bonus is only one factor amongst many that will influence the number of homes proposed in a Local Plan. Against this backdrop the survey found only 11% of authorities agreeing that the Bonus had so far been “an important influence on the number of new homes proposed or adopted in my Local Plan” with 71% disagreeing. 101. Similarly only 5% of authorities agreed that the Bonus had so far been a
“significant factor in public consultation and discussion for my Local Plan”
38 such consultation and discussions will very much depend on where a local
authority was in the plan making process at the time of the interview.
Impact on planning applications
102. The external research found that, to date the Bonus was having “a limited impact on planning applications involving new homes”. Over a third (36%) of
officers said they “always / almost always or often/sometimes“ took into account the revenues from the Bonus when considering planning
applications for new homes”. This was slightly higher for elected members where 38% of officers felt members often took into account Bonus revenues in this context. At the same time 56% of officers stated that they never took into account Bonus revenues when considering applications and 44% of officers felt members never took this into account. There was little variation in these views across different types of authorities.
103. The case study work found that there was a clear and consistent view from officers and members that the Bonus should not influence the requirement to make decisions in accordance with “law and planning policy”. In a number of cases the Bonus was not considered to be a “material consideration” in informing a planning decision. It was however suggested by some authorities that if the Bonus receipts were ring fenced and / or focused on planning and housing spending, that this might result in the Bonus becoming more significant and as such more relevant to planning decisions.
39
Section 7: New Homes Bonus receipts
105. The externally commissioned research used the survey and the case studies to explore how authorities were making use of the flexibilities available to them, what types of activities they were funding and to what extent they were devolving funds and communicating any spending to local communities.
106. The local authority survey suggested that Bonus receipts were largely being used to support core local authority services. When asked what the top or first category of spending was for Bonus receipts, the majority of authorities (60%) said this was primarily for general council services (33% treating such receipts as part of the “general fund” and 27% to “maintain existing services”). The third most popular category was spending on “infrastructure for new housebuilding” chosen by 10% of authorities, followed by “keeping council tax low” at 6.5%.
107. Perhaps representing a better spread of what Bonus monies are spent on, authorities were also asked to rate the top three categories their council spent receipts on. On this basis, the most popular category was “maintaining council services” (57%), followed by “treating it as part of the general grant” (42%), followed by “keeping council tax low” (34%) and “infrastructure for new house building (21%).
108. The case study research found wide variation in the way in which Bonus receipts were being used and the extent to which authorities were making use of the flexibilities in the use of payments. Some authorities were using the funds in a very strategic way to help support planning and housing over a longer term period. For example, one case study used receipts to “support infrastructure delivery for growth” by building up an earmarked reserve over time. The receipts were able to help plug gaps when they arose in the development process and brought valuable flexibility to complement other funding streams. This has enabled them to provide funding across financial years to support strategic planning and the allocation of resources. There was a sense in some cases that uncertainty around the future of local government grant and whether the Bonus was going to continue meant that authorities were taking a cautious approach by continuing to direct funds to the base budget.
109. In other cases authorities were taking a more project based or case by case approach, using receipts to fund a wide range of projects of varying sizes right down to small scale community projects.
40 reserve, then had moved towards 50/50 allocation to housing and general fund, and had now moved to all Bonus payments going into the general fund.
111. The use of receipts to support housing was found to be most effective where existing delivery mechanisms were in place. Examples of the types of housing related activities authorities were spending Bonus receipts on are:
Funding empty homes officers and initiatives;
Interest free loans for private registered providers to support new affordable housing that would be recycled over time;
Loans to assist vulnerable households to improve and repair their home;
Additional funding to complement the disabled facilities grant;
Implementing the authority’s housing strategy;
Feasibility work to fund new road to unlock significant proposed development;
Development of a reserves budget to support growth projects;
Equity loans for first time buyers;
Used strategically to support infrastructure delivery for growth;
Being used to plug funding gaps in the development process;
112. It was clear from the case study interviews recent reductions in local government funding to help address the national deficit meant there were considerable demands on Bonus payments to help support core council service delivery. However, despite this actual allocations were mainly found to reflect political priorities in the authority. Some planning officers reported a degree of frustration that receipts were not being used to support planning and housing initiatives. There was also a feeling that if the Bonus was seen as a recognizable “extra” rather than as a redistribution of existing local government funding,
authorities would be more willing to ring-fence funding to support housing. 113. There was very little evidence that authorities were raising awareness of the
Bonus within the community, or communicating what activities the fund was being spent on. This raises questions as to the extent to which Bonus receipts are being spent “in line with local community priorities” as was intended by the policy. 114. There were some examples where a proportion of the Bonus was being
devolved directly to community groups. Two of the twelve case study areas devolved a proportion of Bonus receipts directly to the community. In one case this represented 25% of all receipts and in another 40% of receipts were
devolved to parish councils to support a range of community projects. 115. The researchers also found that Bonus receipts were particularly valued by
authorities for the flexibility in their use and the way they could be combined with other funding sources. However many authorities argued that receipt levels were still too small to make a significant difference. This situation may however
41
Section 8: Affordable housing, empty
homes and county councils
Affordable housing provision
116. As mentioned in the introduction, to further incentivise the provision of
affordable housing there was an enhancement of new homes payments for each additional affordable home of £350 per annum for the six years of payments. 117. Figure 22 provides the total amount of the Bonus fund in each year that was
used to fund this affordable housing enhancement. In addition to this, affordable housing units will also raise the standard Bonus revenues for each additional home. The affordable housing premium was not introduced until 2012/13, so no enhancement payments were allocated in 2011/12. Total enhancement
payments increased from £21m in 2012/13 to £57m by 2014/15. By 2014/15 total funds allocated to the affordable housing premium represented 6.2% of the total New Homes Bonus Fund in that year.
118. The evaluation explored the extent to which the affordable housing
42 officers agreed or strongly agreed with this statement compared to 41% who disagreed. Responses to this question varied significantly across different types of authorities with agreement highest in “pro-development housing growth” areas were 44% of authorities agreed (44% disagreeing) with this statement and 38% of those from London metropolitan authorities (31% disagreeing). Agreement was lowest amongst county councils (15% agreed and 39% disagreed), followed by “low demand urban” authorities (25% agreed, 40% disagreed).
119. In the in-depth interviews with the case study authorities, it was found that the majority were already very supportive of the principle of new affordable housing, though respondents often felt they lacked the financial and policy levers to
influence its delivery. Evidence from the survey and case studies suggested that numerous local authorities were using Bonus receipts to support the delivery of additional affordable housing in their areas. For example, two authorities were using the funds to provide interest free loans to private registered providers to help deliver affordable housing. Others were using funds to complement “Section 106” affordable housing provision, whilst another found the additional contribution to affordable housing costs had helped support their case for the Community Infrastructure Levy in the face of developer opposition.
120. So, although there were numerous examples of where Bonus receipts were being used to directly and indirectly support the delivery of affordable housing, the research did not find any evidence the Bonus and its accompanying
affordable housing enhancement was providing an additional incentive in increasing support specifically for more affordable homes.
Empty homes
121. The New Homes Bonus rewards authorities for bringing long term empty properties11 back into use by including the net annual change in the number of such properties as part of its calculation of Bonus payments. When the policy was launched, making use of empty homes was also seen as an important way of helping to overcome local opposition to new homes.
122. Figur