RESEARCH PAPER
Measurement of the viscoelastic properties of blood
plasma clot formation in response to tissue factor
concentration-dependent activation
Ramji S. Lakshmanan1&Vitaly Efremov1&James S. O’Donnell2&Anthony J. Killard1,3
Received: 21 February 2016 / Revised: 12 May 2016 / Accepted: 3 June 2016 / Published online: 16 June 2016
#The Author(s) 2016. This article is published with open access at Springerlink.com
Abstract The coagulation of blood plasma in response to activation with a range of tissue factor (TF) concentrations was studied with a quartz crystal microbalance (QCM), where frequency and half width at half maximum (bandwidth) values measured from the conductance spectrum near resonant fre-quency were used. Continuous measurement of bandwidth along with the frequency allows for an understanding of the dissipative nature of the forming viscoelastic clot, thus pro-viding information on the complex kinetics of the viscoelastic changes occurring during the clot formation process. Using a mathematical model, these changes in frequency and band-width have been used to derive novel QCM parameters of effective elasticity, effective mass density and rigidity factor of the viscoelastic layer. The responses of QCM were com-pared with those from thromboelastography (TEG) under identical conditions. It was demonstrated that the nature of the clot formed, as determined from the QCM parameters, was highly dependent on the rate of clot formation resulting from the TF concentration used for activation. These parame-ters could also be related to physical clot characteristics such
as fibrin fibre diameter and fibre density, as determined by scanning electron microscopic image analysis. The maximum amplitude (MA) as measured by TEG, which purports to re-late to clot strength, was unable to detect these differences.
Keywords Blood . Coagulation . Viscoelasticity . QCM . Tissue factor . Rigidity factor
Introduction
Blood coagulation is a complex process involving several biochemical reactions leading to the formation of a clot, which is a gel-like network formed at a site of injury and which functions as a plug to prevent loss of blood. The coagulation cascade is triggered physiologically by tissue factor (TF) that is exposed on the sub-endothelium upon damage to the vessel wall. TF complexes with factor VII and leads to a series of reactions that result in the generation of thrombin. The enzy-matic action of thrombin on the soluble protein fibrinogen present in blood produces fibrin monomers that assemble to form half-staggered oligomers that lengthen to form protofibrils [1–4], which eventually aggregate to form thicker fibres and branch out and grow laterally and longitudinally to form a three-dimensional network. They are also further cross-linked by covalent bonds formed by factor XIII. Kaolin and TF activation are commonly used for monitoring haemophilia [5–8]. However, TF is a physiological activator while kaolin is a non-physiological particulate activator. The physical prop-erties of this network are largely dependent on the amount and rate at which thrombin acts on fibrinogen and is an important characteristic indicator of the quality of the clot [3,4].
Global coagulation testing seeks to study all of the physical and biochemical processes taking place during clot formation, so as to better represent the physiological state. Clot formation
Parts of this work were presented at Euroanalysis 2015 in Bordeaux, France.
* Anthony J. Killard [email protected]
1
Biomedical Diagnostics Institute (BDI), Dublin City University, Dublin 9, Ireland
2
Haemostasis Research Group, Trinity College Dublin and National Centre for Hereditary Coagulation Disorders, St. James’s Hospital, Dublin 8, Ireland
3 Centre for Research in Biosciences (CRIB), Department of Applied
Sciences, University of the West of England, Coldharbour Lane, Bristol BS16 1QY, UK
results in unique time-dependent viscoelastic properties which are contingent on several factors that contribute to the coagu-lation process. Monitoring the blood coagucoagu-lation process is important in understanding the haemostatic balance. The con-ventionalBendpoint^-based assays only reveal one parame-ter of the time taken for the clot to achieve a threshold value. A global coagulation monitoring approach such as thromboelastography (TEG)—which is a viscoelastic meth-od—allows the monitoring of the kinetics of the coagulation process and—in addition to providing the corresponding clot time values—provides an entire picture of viscoelastic chang-es occurring in the clot formation procchang-ess. The TEG system has been widely used for over 40 years at point-of-care in operation rooms guiding clinicians with optimising transfu-sion management [9, 10]. Quartz crystal microbalance (QCM), a piezoelectric shear mode resonator, has the ability to measure coagulation endpoints along with coagulation ki-netics [11–17]. QCM resonance is characterised by a resonant frequency (f) and bandwidth (half width at half maximum, Γ), both of which can be obtained using a Lorentzian curve fit of the conductance spectrum. When any material interacts with the QCM surface, monitoring fin association withΓ provides unique physical information relating the viscoelastic properties of the material. In previous work [11,12], the effect of fibrinogen concentration on qualitative and quantitative viscoelastic changes during clot formation activated using a partial thromboplastin has been shown using QCM. In addi-tion to measuring the activated partial thromboplastin time (aPTT), this method allowed the quantitative characterisation of fibrinogen concentrations as well as a qualitative character-isation of the properties of the forming clot in a single test [18], which usually requires two independent tests. Hussain et al. [17,19] later reported a similar use of QCM in measuring clotting using the same aPTT assay for different fibrinogen concentrations. Since the method monitors the entire kinetics of the coagulation process, traditional parameters such as aPTT can be easily extracted. However, the main advantage of using QCM lies in the fact that it can also provide mean-ingful viscoelastic information on the forming clot.
An unloaded (in-air) QCM sensor is typically characterised by a high quality factor with a resonant frequency (fair) ≈5 MHz and half bandwidth (Γair)≤30 Hz. In this article, the mechanical properties of a TF-activated plasma sample loaded on the sensor were investigated with a mathematical model developed [18] by means of an effective elasticity (μt),
effective mass density (Mt) and resulting rigidity factor (RF)
calculated using the shifts of resonance peak characteristics, ΔfandΔГ, with respect to theirBin-air^values. Briefly, QCM is used to investigate the effect of TF activation for coagula-tion and show that the developed model relates differences in TF concentration to changes in the qualitative nature of the formed clot. Since this method continuously monitors the co-agulation process, it allows information on clotting time, rate
of clot formation and maximum amplitudes of both frequency and bandwidth changes to be obtained.
Materials and methods
Reagents
Water, calcium chloride (CaCl2), glutaraldehyde, ethanol, tol-uene and phosphate-buffered saline (PBS) were all obtained from Sigma-Aldrich. A Dade Innovin® reagent was used as the source of TF and was obtained from Sysmex. Vacutainer tubes (BD-367691) containing sodium citrate (0.105 M) and 21-gauge needles used for blood draw were obtained from Becton Dickinson.
Preparation of platelet-poor plasma (PPP)
This study was approved by the Research Ethics Committee of Dublin City University. Informed consent was obtained from all volunteers prior to phlebotomy. Normal healthy con-trols were recruited at Dublin City University, and patients with cardiovascular disease or individuals taking anti-platelet medication (e.g. aspirin) were excluded from the study. Whole blood (WB) was obtained from normal donors using a 21-gauge needle by a trained phlebotomist into vacutainers con-taining sodium citrate. The vacutainers concon-taining WB were centrifuged at 3000gfor 10 min, and the top two thirds of the supernatant was carefully extracted to obtain PPP and was placed at 37 °C before use. Measurements were performed within 30 min of the blood draw.
QCM sensor preparation and test methodology
The experimental arrangement as described previously [11, 12] consisted of a QCM holder (SRS QCM200), a sample chamber and a network/spectrum/impedance analyser (Agilent, 4395A-010). The sample chamber was composed of Teflon® and was designed to hold 200μL of the sample on top of the QCM, while preventing evaporation. The QCM resonant frequency characteristics (frequency (f) and band-width (Γ)) were determined by applying a rational fitting al-gorithm to the conductance spectrum near the QCM resonant frequency. QCM sensor electrodes were connected to the im-pedance analyser interfaced to a data acquisition PC running a custom LabVIEW® program that enabled collection offand Γmeasurements (bandwidth used was half width at half max-imum). All QCM measurements were carried out in a Binder ED-53 oven (Bohemia, NY, USA) maintained at 37 °C.
Coagulation measurements on QCM
The QCM was placed in the chamber and allowed to form a stable baseline frequency. The frequency shift was calculated as Δf*(t) =f(t)−Δf
0and bandwidth shift asΔΓ*(t) =Γ(t)−ΔГ0, whereΔf0andΔГ0are correspondingΔfandΔГvalues mea-sured immediately after liquid sample loading, i.e. before the onset of coagulation. A 20-μL aliquot of the TF reagent (0.35, 1.42, 3.5, 14.2 and 35 pM in PBS) was added to a vial contain-ing 200μL of PPP, maintained at 37 °C and incubated for 5 min. Pre-warmed (37 °C) 20μL of CaCl2(100 mM) was added to this vial, and 200μL of this mixture was immediately transferred to the QCM chamber. Time courses,Δf*(t) andΔГ*(t), provide the information about the kinetics of clot formation, namely clotting time (R-QCM), maximum rate of clot formation (MRCF), time to maximum rate of clot formation (TMRCF) and maximum response (Δf*
maxorΔΓ*max). R-QCM was de-fined as the time taken from the start of activation to achieve 10 % ofΔf*max. MRCF and TMRCF were obtained from the first derivative curves of theΔf*(t) orΔΓ*(t) responses.
TEG test methodology
The TEG tests were conducted with identical concentrations of TF reagent and CaCl2concentrations for comparison of kinetics. The PPP, TF and 100 mM CaCl2were pre-warmed to 37 °C on a heating block for 15 min. A 30-μL aliquot of the TF reagent (0.35, 1.42, 3.5, 14.2 and 35 pM) was added to a vial containing 300μL of PPP, maintained at 37 °C and incubated for 5 min. Pre-warmed (37 °C) 30μL of CaCl2(100 mM) was added to the TEG cup followed by 330μL of the PPP-TF mixture. TEG traces were recorded for a period of 30 min, and the correspond-ing reaction time (R-), time to maximum rate of thrombus gen-eration (TMRTG), maximum rate of thrombus gengen-eration (MRTG) and maximum amplitude (MA) were recorded for comparison with QCM responses. In TEG,R- is defined as the
time taken for the pin displacement to reach an amplitude of 2 mm from the start of activation.
Scanning electron microscopy: sample preparation and image analysis
The samples used to image the clot formed on the sensor surface were prepared according to methods described elsewhere [20–22]. Briefly, the sensors were taken from the QCM holder and rinsed gently with deionised water and immediately placed in a 2.5 % (v/v) glutaraldehyde solution for 15 min. The sensors were then rinsed gently with deionised water several times. This was then followed by drying the sensors in increasing ethanol water mixtures of 20, 40, 60, 80 and 100 % (v/v) for 15 min each. The sensors were then dried in a stream of nitrogen, and a thin-conducting gold layer was sputter-coated to provide a con-ductive surface to perform SEM investigations.
SEM (accelerating voltage 5 kV) images at a magnification of 20,003 and 250,003 were obtained for plasma samples activated with three TF concentrations (0.35, 3.5 and 35 pM). In order to get numerical estimates for the fibre di-ameter and the fibre density, the lower-magnification (20,003) images were processed and analysed, as they contained repre-sentative ensembles of fibres and hence could provide statis-tically relevant values for the parameters of interest.
Image spectral analysis was applied as a series of processing steps [23]. In the first step, the image was filtered from the high-frequency structures (considered as noise) having a size of less than 2 pixels, which corresponds to less than 48 nm actual size. The result was converted to a binary image with a threshold chosen as the mean value of pixel intensity. Pixels with an orig-inal intensity less than threshold were given a value of−1 (Bdark pixel^), and pixels with intensities higher than threshold were given a value of +1 (Bbright pixel^). The average fibre network porosity, F.Por, was defined as the ratio of the number of dark pixels to the absolute number of image pixels. In the second step, a two-dimensional fast Fourier transform algorithm was applied to the binary image. The resulting matrix of spectral amplitudes was converted to a one-dimensional radially averaged power spectrum. The frequency value corresponding to maximal pow-er was used to estimate the avpow-erage fibre density (F.Dens). Finally, an estimate of average fibre diameter (F.Diam) was cal-culated from F.Por and F.Dens based on the assumption that the fibre network had an ideal form of rectangular gratings, that is F.Diam = (1−sqrt(F.Por)) / F.Dens.
Results and discussion
Analysis of responses to activation with tissue factor
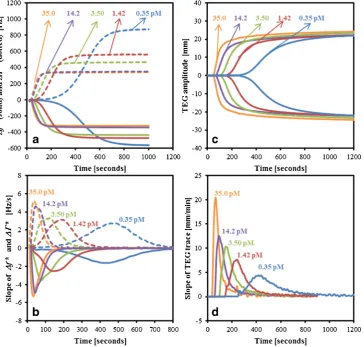
and TEG monitor the kinetics of viscoelastic changes occur-ring duoccur-ring the entire coagulation process. Five concentrations of TF (0.35, 1.42, 3.5, 14.2 and 35 pM) were used to study its effect on the kinetics of clot formation as defined by their measured responses. For QCM, Δf*= (Δf(t)−Δf0) and ΔΓ*
= (ΔΓ(t)−ΔΓ0) following activation with various TF concentrations are shown in Fig.1A, while Fig. 1B shows the first derivative ofΔf*andΔΓ*indicating the rate of clot formation. Figure1C, Dshows the analogous TEG parame-ters of amplitude and its first derivative, respectively. It is evident that the concentration of TF had a considerable effect on the characteristics of QCM frequency and bandwidth re-sponse and the TEG rere-sponse of amplitude. At lower concen-trations of TF, the onset of changes infandΓwas increasingly delayed, as were changes to the TEG amplitude. Decreased TF concentration is associated with a delay in the onset of clot formation [24]. It was also seen that the magnitude of both Δf*
maxandΔΓ *
max(the maximum change inΔf *
andΔΓ*) was dependent on the TF concentration, being greater at lower concentrations. However, final TEG amplitude (MA) was in-sensitive to the concentration of TF, indicating differences in the interaction of the forming clot with the QCM surface. The dependence ofΔf*andΔΓ*on TF concentration cannot be
attributed solely to increased mass attaching to the surface due to a greater affinity of the activated plasma sample [19]. The concentrations of fibrinogen in the tested samples were within the normal range (2.3–3.4 mg/mL). Thus, the differences in theΔf*andΔΓ*for different TF concentrations are due to differences in the viscoelastic characteristics of the fibrin net-work coupled to the QCM surface, which was not observed using TEG. TEG and QCM are, in principle, different methods, and the TEG parameter of MA is an indicator of clot strength through a non-linear combination of viscosity and elasticity, which appears to be insensitive to differences in TF concentration-dependent physical properties of the clot.
The amount and rate of thrombin generated during coagu-lation is known to have a vital influence on the properties of the fibrin clot [4,24,25]. The kinetics of clot formation were shown to be dependent on the TF concentration on both QCM and TEG, where a decreased maximum rate of clot formation (MRCF/MRTG) and prolonged time to reach the maximum rate (TMRCF/TMRTG) were observed for decreased TF con-centrations. At 0.35 pM of TF, the maximum rate measured on the QCM was 2.75 Hz/s (MRCF-ΔΓ*
) and the respective time to achieve the maximum rate was 463 s (TMRCF-ΔΓ*), while for a concentration of 35 pM, the maximum rate was 5.17 Hz/s
Fig. 1 (A) Changes in frequency and bandwidth (Δf*andΔΓ*) for the normal platelet-poor plasma samples activated using TF concentrations of 0.35, 1.42, 3.5, 14.2 and 35 pM. (B) Slope ofΔf* andΔΓ*for the five
[image:4.595.182.547.365.712.2](MRCF-ΔΓ*) and was achieved in 37 s (TMRCF-ΔΓ* ). Similarly, on TEG, the measured values for TMRTG and MRTG were 4.3 mm/min and 415 s, respectively, in response to 0.35 pM of TF, while for 35 pM, these were 20.3 mm/min and 64 s, respectively. This suggests that TF concentration affects the quantity and rate of thrombin generated, which also results in characteristically different fibrin clots and not just differences in the rate at which the clot is formed. The differ-ences in the rate of change ofΔf*andΔΓ*(Fig.1B) are due to the differential contributions from the mass coupled to the QCM surface and the corresponding viscoelastic properties of the clot.
Comparison of QCM and TEG parameters
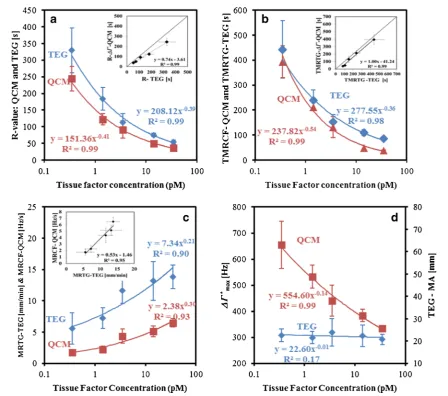
For comparisons between QCM and TEG, only the values for each of the kinetic parameters obtained from theΔΓ* obser-vations for QCM are presented here as kinetic parameters obtained fromΔf*observations (not shown) are analogous and exhibit similar trends to theΔΓ*observations. To com-pare the kinetics of the clot formation, the same measurements using identical reagent concentrations were conducted on the TEG instrument. In terms of clotting kinetics, R-ΔΓ*, TMRCF-ΔΓ*and MRCF-ΔΓ*
values correlated well with the TEG measurements ofR-, TMRTG and MRTG, respec-tively (Fig.2A–C). This suggests that the QCM is effective in deriving kinetic parameters and is in good agreement with an established system such as TEG. The time parameters mea-sured on the QCM were all lower than that meamea-sured on TEG, which can be attributed to the fact that the QCM measures changes occurring close to the surface (approx. 200 nm) and hence identifies kinetic information sooner than TEG, which requires the forming clot to couple the cup and pin, which are separated by approx. 100μm. However, analogous parame-ters that showed a significant difference between QCM and TEG wereΔΓ*max (and Δf*max) and MA. While MA was independent of TF concentration, QCM exhibited a quasi-linear inverse relationship between TF concentration and ΔΓ*
max(Fig.2D). It is interesting to note that QCM demon-strated this difference under identical experimental conditions to TEG, suggesting that QCM is indeed measuring a differ-ence in the structure of the formed clot which is not detectable using TEG.
Image analysis and analysis of physical characteristics of clots formed on QCM
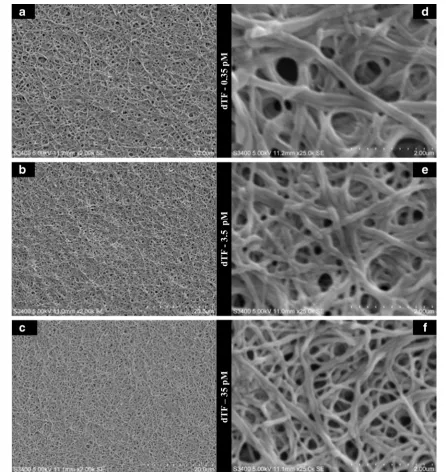
In order to investigate whether the differences measured in QCM were related to the structure of the formed clot, three of the TF-activated samples (0.35, 3.5 and 35 pM) were im-aged at the end of the clot formation process using SEM. Figure3shows SEM images of the three samples at 20,003 and 250,003 magnification. Clear differences in clot structure
can be seen with the naked eye at higher magnification (Fig. 3D–F), and at least two structural parameters can be observed. These are the fibre density (the number of fibres per unit area) and fibre diameter. It appears that higher TF concentrations make the formed fibrin network denser, but with thinner fibres. The TEG parameter MA has been exten-sively used to characterise the mechanical property of a formed clot and is widely interpreted as relating to fibrin clot firmness or strength [9,26] and representing the bulk mechan-ical properties of the fibrin polymer network and not being related to the properties of individual fibre segments. The results achieved here appear to demonstrate that MA was un-able to differentiate between different fibrin networks formed with various TF concentrations (Fig.2D). Thus, the effect that the rate of clot formation can have on micro-mechanical clot structure was not detected.
Image analysis further confirmed the visual observations of the clot characteristics in Fig. 3 and demonstrated that the average fibrin diameter (F.Diam), fibre density (F.Dens) and clot porosity (F.Por) in the fibrin network were dependent on the rate of clot formation, resulting in final clots with different structural properties (Table1).
Thus, QCM appears to have a unique advantage over TEG as, in addition to the measurement of clotting time and the kinetics of the clot formation process through char-acteristic changes in both frequency and bandwidth, these parameters are also dependent on the mass and the visco-elastic properties of the clot interacting with the QCM sur-face, which can provide meaningful physical information about its structure.
Time courses,Δf(t) andΔГ(t), as well as MA(t) provide information about the kinetics of clot formation, namely rates/slopes of reaction, clotting time and maximum Bclot strength^. Moreover, in previous work, it has been shown that the respective final maximum values,ΔfmaxandΔГmax, ob-served when clot formation was complete correlated well with fibrinogen concentration in PPP samples [11, 12]. However, the physical meaning and corresponding direct in-terpretation of MA(t), Δf(t) and ΔГ(t) are challenging. Indeed, in QCM, two measured parameters cannot provide an interpretation of at least three physical processes taking place in the real plasma sample during coagulation: change in viscosity, change in elasticity and fibrin adhesion to the sensor surface. MA is even less informative, being the only measured parameter. In order to derive physical meaning, a mathematical model of Bblood component flexibility^ has been developed [18]. The model is based on the assumption that serum viscosity does not change during coagulation, which allows for the determination of a normalised effective elasticity (μt) and normalised effective mass density (Mt) of
R F ¼ Mμt t ¼
a⋅ ΔГ2−c2ΔГ2
z
b⋅ðΔf−cΔfzÞ ð1Þ
where valuesΔГzandΔfzcharacterise viscous plasma
prop-erty and are taken at the time where a plasma sample is just deposited on the sensor surface but before the start of clot formation;a and b are simple scaling normalisation factors for effective elasticity and effective mass density, respectively (they are set to bea= 2.5 × 10⁻⁷Hz−2andb= 1 × 10⁻³Hz−1in the present work);cis the plasma viscosity correction coef-ficient defined asc=ΔГz/ΔГ. The equation derivation and
detailed explanation can be found in [18]. It has been dem-onstrated that RF for partial thromboplastin-based activation of PPP was not related to fibrinogen concentration in artifi-cially prepared fibrinogen-spiked samples [18]. Moreover, RF(t) was constant throughout the clot formation process
and, hence is a qualitative characteristic of the fibrin segments attached to the QCM surface.
Using the described model, RF values were determined for the TF-activated PPP samples described here and investigated as a meaningful physical parameter of clot structure (Table1). The values derived demonstrate that RF values were significantly different for the three TF concentrations chosen. RF was highest when fibres were shorter, wider and fewer in number as a result of slow clot formation in the presence of low TF concentrations and decreased as fibres became longer, thinner and less numer-ous due to the more rapid onset of clot formation at higher TF concentrations. Thus, one can use RF as a single derived param-eter to infer microscopic structural information about the nature of the formed clot and its origins in a manner not possible with current global coagulation tests. Such information could be use-ful in studying a range of haemostatic disorders.
Fig. 2 Effect of TF concentrations on the kinetic parameters measured on QCM and TEG.Insetsshow the correlations between TEG and QCM parameters (n= 8). (A)Rvalue (s). (B) Time to maximum rate of clot formation on QCM (TMRCF-QCM) and time to maximum rate of
thrombus generation on TEG (TMRTG-TEG) (s). (C) Maximum rate of clot formation on QCM (MRCF-QCM) and maximum rate of thrombus generation on TEG (MRTG-TEG). (D) QCM-ΔΓ*max and TEG
[image:6.595.73.522.47.443.2]Conclusions
The QCM sensor was found to be capable of monitoring the coagulation kinetics of a plasma sample activated by TF in a
manner analogous to thromboelastography. However, QCM was shown to be further capable of detecting qualitative changes in clot structure resulting from differential rates of clot formation at different TF concentrations. This behaviour
[image:7.595.73.520.50.523.2]Fig. 3 The (A–C) 20,003 magnification SEM images, used for image analysis, and (D–F) 250,003 magnification SEM images of clots formed with 0.35, 3.5 and 35 pM of TF, respectively
Table 1 Results of spectral analysis and modelling parameters of the clots formed with different tissue factor concentrations
TF (pM)
F.Por (a.u.) F.Dens (μm−1) F.Diam (nm) μt(n= 8) (a.u.) Mt(n= 8) (a.u.) RF (n= 8)
(a.u.)
[image:7.595.175.544.636.712.2]could not be observed with thromboelastographic parameters. In conjunction with a mathematical model of blood compo-nent flexibility, the parameter of rigidity factor could be de-rived and which relates in physical terms to the viscoelastic properties of the clot. It was demonstrated by visual and image analysis of the clot that rigidity factor could be related to the microscopic structure of the formed clot, which was in turn related to its rate of formation and the TF concentration used. Such a technique could be used to derive important informa-tion about the clotting process. In addiinforma-tion, QCM is easy to operate for real-time analysis of blood coagulation and has the potential to be used for point-of-care diagnostics.
Acknowledgments The experimental work carried out was supported by the Science Foundation Ireland under Grant No. 10/CE/B1821. The SEM image analysis was performed with support of the Science Foundation Ireland under Grant No. 13/TIDA/B2688.
Compliance with ethical standards All blood samples were obtained through adherence to institutional ethical approvals processes.
Conflict of interest The authors declare that they have no conflicts of interest.
Open AccessThis article is distributed under the terms of the Creative Commons Attribution 4.0 International License (http:// creativecommons.org/licenses/by/4.0/), which permits unrestricted use, distribution, and reproduction in any medium, provided you give appropriate credit to the original author(s) and the source, provide a link to the Creative Commons license, and indicate if changes were made.
References
1. Undas A. Fibrin clot properties and their modulation in thrombotic disorders. Thromb Haemost. 2014;112:32–42.
2. Undas A, Ariens RAS. Fibrin clot structure and function: a role in the pathophysiology of arterial and venous thromboembolic dis-eases. Arterioscler Thromb Vasc Biol. 2011;31:e88–9. doi:10.1161/ATVBAHA.111.230631.
3. Blombäck B, Carlsson K, Fatah K, Hessel B, Procyk R. Fibrin in human plasma: gel architectures governed by rate and nature of fibrinogen activation. Thromb Res. 1994;75:521–38.
4. Wolberg AS. Thrombin generation and fibrin clot structure. Blood Rev. 2007;21:131–42.
5. Young G, Zhang R, Miller R, Yassin D, Nugent DJ. Comparison of kaolin and tissue factor activated thromboelastography in haemophilia. Haemophilia. 2010;16:518–24.
6. Viuff D, Andersen S, Serensen BB, Lethagen S. Optimizing thrombelastography (TEG) assay conditions to monitor rFVIIa (NovoSeven) therapy in haemophilia A patients. Thromb Res. 2010;126:144–9.
7. Chitlur M, Rivard GE, Lillicrap D, Mann K, Shima M, Young G. Recommendations for performing thromboelastography/ thromboelastometry in hemophilia: communication from the SSC of the ISTH. J Thomb Haemost. 2014;12:103–6.
8. Hemker HC, Giesen PL, Ramjee M, Wagenvoord R, Béguin S. The thrombogram: monitoring thrombin generation in platelet-rich plas-ma. Thromb Haemost. 2000;83:589–91.
9. Whiting D, DiNardo JA. TEG and ROTEM: technology and clin-ical applications. Am J Hematol. 2014;89:228–32.
10. Enriquez LJ, Shore-Lesserson L. Point-of-care coagulation testing and transfusion algorithms. Br J Anaesth. 2009. doi:10.1093 /bja/aep318.
11. Lakshmanan RJ, Efremov V, Cullen S, Killard AJ. Monitoring the effects of fibrinogen concentration on blood coagulation using quartz crystal microbalance (QCM) and its comparison with thromboelastography. In: SPIE Microtechnologies 2013, International Society for Optics and Photonics, Grenoble, 2013: p. 87650Q–87650Q–8.
12. Lakshmanan RS, Efremov V, Cullen SM, Killard AJ. Measurement of the evolution of rigid and viscoelastic mass contributions from fibrin network formation during plasma coagulation using quartz crystal microbalance. Sensors Actuators B. 2014;192:23–8. 13. Bandey HL, Cernosek RW, Lee WE, Ondrovic LE. Blood
rheolog-ical characterization using the thickness-shear mode resonator. Biosens Bioelectron. 2004;19:1657–65.
14. Guhr G, Kunze R, Martin G, Schmidt H, Weihnacht M, Gehrisch S, et al. 3F-1 thrombelastography using acoustic sensors. IEEE Ultrason Symp. 2006. doi:10.1109/ULTSYM.2006.141.
15. Guhr G, Kunze R, Martin G, Hagen S, Weinacht M, Gehrisch S, Siegert G. Monitoring blood coagulation with QCM and SH-SAW sensors. IEEE Ultrason Symp. 2005: pp. 58–61.http://ieeexplore. ieee.org/xpls/abs_all.jsp?arnumber=1602795. Accessed 11 Sep 2012. 16. Muller L, Sinn S, Dreschel H, Ziegler C, Wendel H-P, Northoff H, et al. Investigation of prothrombin time in human whole-blood samples with a quartz crystal biosensor. Anal Chem. 2010;82: 658–63.
17. Hussain M, Sinn S, Zeilinger M, Northoff H, Leiberzeit PA, Gehring FK. Blood coagulation thromboplastine time measure-ments on a nanoparticle coated quartz crystal microbalance biosen-sor in excellent agreement with standard clinical methods. J Biosens Bioelectron. 2013;4:4–9.
18. Efremov V, Lakshmanan RS, Byrne B, Cullen SM, Killard AJ. Modelling of blood component flexibility using quartz crystal mi-crobalance. J Biorheol. 2014;28:45–54.
19. Hussain M, Northoff H, Gehring FK. QCM-D providing new ho-rizon in the domain of sensitivity range and information for haemostasis of human plasma. Biosens Bioelectron. 2015;66: 579–84.
20. Ignjatovic V, Pelkmans L, Bleomen S, Karlaftis V, Attard C, Al Dieri R, et al. The first report of differences in fibrin clot nanostruc-ture and response to tissue plasminogen activator (TPA) and unfractionated heparin (UFH) in infants compared to adults. Blood. 2013;122:459.
21. Pretorius E, Oberholzer HM, Van Der Spuy WJ. Scanning electron microscopy investigation of fibrin networks after thermal injury. Onderstepoort J Vet Res. 2011;78:1–4.
22. Ryan EA, Mockros LF, Weisel JW, Lorand L. Structural origins of fibrin clot rheology. Biophys J. 1999;77:2813–26.
23. Efremov V. Klimontovich’s S-theorem algorithm implementation and data preparation tools, R package. (2015) version 1.2. ftp://cran.r-project.org/pub/R/web/packages/stheoreme/stheoreme.pdf.
24. Soresnsen B, Johansen P, Christiansen K, Woelke M, Ingerslev J, Sørensen B, et al. Whole blood coagulation thrombelastographic profiles employing minimal tissue factor activation. J Thromb Haemost. 2003;1:551–8.