Long-range concealed object detection through active covert
illumination
Ian J. Hales
a, David R. Williamson
a, Mark F. Hansen
a,
Laurence Broadbent
band Melvyn Smith
aaBristol Robotics Lab, University of the West of England, Bristol, UK;
bAralia Systems Ltd., Milnwood, Horsham, UK.
ABSTRACT
When capturing a scene for surveillance, the addition of rich 3D data can dramatically improve the accuracy of object detection or face recognition. Traditional 3D techniques, such as geometric stereo, only provide a coarse grained reconstruction of the scene and are ill-suited to fine analysis. Photometric stereo is a well established technique providing dense, high-resolution, reconstructions, using active artificial illumination of an object from multiple directions to gather surface information. It is typically used indoors, at short range (<1 m), under highly controlled lighting conditions, and so has rarely found application in real-world, outdoor surveillance. One difficulty in such scenes is that the near infrared light generally used to illuminate a scene is overwhelmed by ambient illumination from the sun, and so it is not possible to reliably discriminate the artificial light from the ambient. This work aims to overcome this limitation and counteract the effect of sunlight by exploiting atmospheric absorption at a particular wavelength, 940 nm, in combination with image capture using state-of-the-art black silicon sensors. We first show that this combination, together with low-cost, focused LED illuminators, allows us to reliably differentiate artificial illumination from ambient lighting. We then extend our system to perform photometric stereo reconstruction at distances far beyond the current state of the art under direct sunlight, with a possibility for extending the range to 100 m and beyond. Finally, we provide some example use cases for the photometric stereo data in the form of detection of concealed objects and face recognition.
Keywords: covert object detection, infrared imaging, black silicon, machine vision, surveillance, 3D technology, surface reconstruction, photometric stereo
1. INTRODUCTION
A common surveillance problem is the automatic detection of objects concealed under clothing, and the iden-tification of those carrying them. As many 2D methods rely on colour and texture information, targets can make use of patterned clothing to camouflage features that might otherwise provide clues to the shape of objects, such as weapons, hidden beneath. By examining 3D features, it is possible to achieve more reliable detection of hidden shapes;1, 2 however the level of detail required is beyond that achieved with traditional stereo imaging or structured light techniques. Photometric stereo (PS) is a well established method for dense surface reconstruction using several images of an object, illuminated from two or more directions.3 It has seen use in applications such as face reconstruction and recognition,1, 4surface inspection and defect detection,5, 6 skin analysis7, 8and anti-counterfeiting,9, 10 among more exotic uses.11, 12
A particular advantage of this technique is that it reliably separates textural elements, such as printed patterns, from physical shapes.13 In combination with the extremely detailed, high-resolution surface information it provides, this offers many possibilities for concealed object detection.2 PS can also run at high speed, with capture, reconstruction and analysis occurring in real time.14
One of the major challenges in bringing photometric stereo to real world applications is effective lighting. In outdoor conditions, ambient light can drown out a machine visions system’s artificial illumination and greatly reduce its effectiveness. At night, or on overcast days, this can be mitigated using near-infrared (nIR) illumination and an nIR sensitive camera, as most artificial ambient lighting is designed for peak output in the visible spectrum.
For security or military applications, nIR light has obvious advantages in allowing covert surveillance. However, on clear days even indirect sunlight overwhelms artificial illumination and saturates the capacity of camera sensor photosites, leading to washed out and overexposed images. Because the sun emits radiation across a broad spectrum that includes infrared light, simply switching to nIR wavelengths is not effective.
Sunlight reaching the Earth first passes through the atmosphere, where thick layers of gas, water vapour and particulate matter absorb a portion of the sun’s energy.15 Atmospheric absorption of light is not uniform across the spectrum, and a number of absorption peaks have been identified in the infrared, including at around 940 nm, 1150 nm and 1370 nm.16 At these peaks atmospheric water absorbs a significant portion (as much as 45–98%) of the sun’s light, leading to much lower ambient illumination at ground level around these specific wavelengths. The focus of this paper is to exploit these peaks using a camera with particular sensitivity at such a wavelength, along with a narrow bandpass filter which cuts out the majority of other light.
Recent developments in sensor technology have produced “black silicon” CMOS sensors,17, 18which have very high sensitivity both at visible and nIR wavelengths. The following section directly compares a leading near-infrared camera using a traditional CMOS with a new-to-market camera equipped with black silicon technology. Section 3 goes on to describe, in detail, photometric stereo, assessing the advantages and disadvantages of various formulations of the PS problem. Section 4 then explains how we can overcome the effect of ambient light on active illumination at considerably longer distances than possible with traditional sensors by exploiting the sensitivity of black silicon technology. We show that even in extremely challenging conditions, such as intense daylight, where light-based reconstruction methods would typically be assumed to fail, our system can reliably reconstruct 3D surfaces at range, far surpassing previous efforts. Finally, we exhibit some preliminary results in key application areas where this long-range PS approach can be used in real-world security scenarios in Section 5.
2. COMPARING TRADITIONAL AND BLACK SILICON SENSORS
Before performing tests on 3D reconstruction quality, we first assessed the sensitivity of our black silicon sensors campared with that of the traditional camera.
We obtained two monochrome, nIR sensitive machine vision cameras; one with a 4.1 MP, 1”, traditional CMOS sensor, and the other equipped with a 1.3 MP, 1” black silicon CMOS. We matched the lens and settings of the two cameras and disabled automatic exposure adjustment. Ideally, shutter speeds would also have been matched; however it quickly became clear that this would not be possible as the sensitivities of the two cameras were substantially different, resulting in overexposure in one or underexposure of the other. Shutter speeds were instead set independently to achieve good exposure.
In order to assess the applicability of the cameras to our purpose, we examined both 850 nm and 940 nm wavelengths at a range of illumination levels. To this end, we obtained matched LED clusters at these wavelengths (45◦ divergence, 1 A typical operating current), which were (a) capable of brightness control via input current and (b) similar in their ratio of input current to output power. The cameras were equipped with appropriate narrow
bandpass interference filters, and experiments took place in a darkroom to eliminate ambient illumination.
The illuminators and cameras were oriented towards a white balance reflectance target (12”, 99% UV-VIS-IR reflective), providing uniform reflectance across the wavelengths of interest. Images of the calibration plate were captured at a range of input currents between 0 and 1 A, with a light output of 0–257 mW measured at 850 nm and 940 nm using an optical power meter with 10 mm aperture at a distance of 20 cm from the illuminator.
At each current level, images were taken using the traditional and black silicon sensor, under 850 nm and 940 nm illumination. Shutter speeds for each condition remained constant throughout — 5 ms at 850 nm and 10 ms at 940 nm for the traditional sensor, and 0.6 ms at both wavelengths for the black silicon sensor.
From the captured images (see Figure 1) the mean intensity over the calibration plate was calculated. This value was then normalised by the shutter speed, assuming a linear relationship between shutter speed and measured pixel intensity. Finally, the pixel intensity values were normalised against the measured light output for each current to obtain a measure of the camera sensitivities.
Sensor Type Wavelength 0.15 A 0.3 A 0.6 A 0.9 A 1 A
Traditional (5 ms)
850 nm
940 nm
Black Silicon (0.6 ms)
850nm
[image:3.595.69.538.83.325.2]940nm
Figure 1. A subset of images captured to compare the sensitivities of black silicon and traditional sensors under 850 nm and 940 nm illumination. Different exposure times were required for the two cameras to acquire images that were not either completely black or blown out. The traditional camera images are shown with an effective exposure time of 5 ms (940 nm images have been adjusted from 10 ms for comparison purposes), while the black silicon camera was set to 0.6 ms
at both wavelengths.
0.2 0.3 0.4 0.5 0.6 0.7 0.8 0.9 1
0 0.2 0.4 0.6 0.8
Input Current (A)
Normalised
camera
sensitivit
y
Camera sensitivity
[image:3.595.92.515.414.650.2]3. PHOTOMETRIC STEREO
In this section, we explain in detail the technique of photometric stereo (PS), introduced in Section 1, used here to gather 3D information from a single, monocular camera. In the seminal work on the method, Woodham19 introduces the underlying theory, which we summarise here.
In basic terms, we capture three or more images of a static object; in each of which the subject is artificially illuminated from a different point source of known direction. The intensity at each pixel of each image then provides a constraint on the shape of the surface under that pixel, described by a vector map of unit normals. In the interest of simplicity, we assume an orthographic view of the object, or that prior calibration of the camera with respect to the object has been performed to achieve the same.
The reflectance of the surface is also assumed to be Lambertian in nature, an assumption which is often breached in its strictest sense, but which does not dramatically deteriorate reconstruction quality in most cases. A notable exception is the presence of specular reflections, which strongly affect reconstruction. However, specularities are readily detectable and can often be corrected using the two unaffected images by exploiting the integrability constraint to resolve ambiguity.20
The intensity, I, at some point on a surface, given illumination of direction L = (lx, ly, lz)>, is related to the orientation and reflectance of the surface at that point. These are described by the normal vector N = (Nx, Ny, Nz)> and albedo constant,ρrespectively:
I=ρ(N · L) (1)
For a set ofmimages,I= (I1, I2, . . . Im), let us designate the set of lighting direction vectorsL= (L1,L2, . . . ,Lm). Denote the intensity ofIi at position (x, y) asIi(x, y), where i∈(1, . . . , m). For all (x, y), we seek to capture the surface normal,N(x, y) and albedo,ρ(x, y). Following the above notation, we refer to the intensity of all images inI at position (x, y) asI(x, y) ={I1(x, y), I2(x, y), . . . , Im(x, y)}. We can now describe the relationship between the intensity of some pixel observed with illumination from each light source as follows:
I(x, y) =ρ(x, y) (N(x, y) · L) (2)
Define the vectorg(x, y) as:
g(x, y) =ρ(x, y)N(x, y) (3)
AsN(x, y) is, by definition, a unit vector andρ(x, y) is scalar; we have a system with three degrees of freedom. Therefore, given three ideal images with differing lighting we can calculate g(x, y) directly. As we are unlikely to observe ideal images in the real-world (e.g. through shadowing or specular highlights), it is common practice to capture additional images and calculate using a least-squares formulation:
g(x, y) = (L>L)−1L>· I (4)
As previously statedN(x, y) is unit andρ(x, y) a scalar constant, to recapture the surface normal and albedo fromg(x, y) we simply take the L2-norm:
ρ(x, y) =||g(x, y)|| (5)
N(x, y) = g(x, y)
||g(x, y)|| (6)
(a) (b) (c)
[image:5.595.144.458.71.306.2](d) (e) (f)
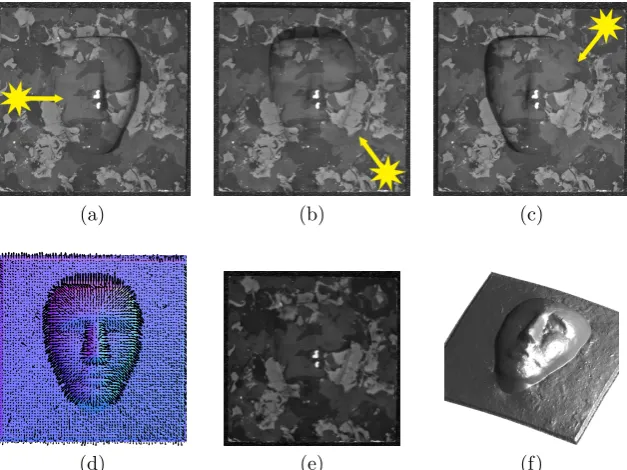
Figure 3. Three source photometric stereo — we capture three images using different, known lighting positions in each of (a–c). Each image provides constraints on the surface orientation at that pixel allowing us to recapture the surface normal vector field (d) and albedo (e). In (d), surface orientation is represented both as colour and a quiver plot. By integrating over the normal field, we can obtain an estimate of volume (f).
is shown in Figure 3, where a camouflaged mask is virtually indistinguishable from the background under a single source of illumination. Having captured three images of the mask under varying lighting, we can calculate a fine-grained reconstruction of the mask’s shape as well as retaining the reflectance profile within the albedo.
By integrating over the surface normal field — for example using the method of Frankot and Chellappa21 — we can obtain an estimate of the object’s volume.
3.1 Reducing the number of lights
In scenes with little or no motion, we can reliably use multiple light sources to capture the scene. However if an object moves appreciably between frames, that motion will cause artefacts in the photometric stereo reconstruction. This phenomenon is shown in Figure 4, where an image of the mask previously shown undergoes simulated lateral motion of varying degrees. One can clearly see strong distortions in the surface normal field as a result of the variation in the textural features observed under each pixel influencing the perceived shape.
It may be possible to reduce this effect by tracking the object of interest and preprocessing the input images to centre them on the same position; however such a solution brings its own difficulties, such as inaccuracies in tracking and non-rigid motion of objects. It can be seen from Figure 4(b) that even 1 pixel of motion between captured frames produces noticeable artefacts in the resulting surface normals, so even slight tracker drift could prevent reliable reconstruction.
Instead it is better to minimise the number of frames with different lighting required, reducing the effects of inter-frame motion. This approach, in combination with the high framerates available from modern machine vision cameras (in excess of 200 Hz), allows us to mitigate the effect of motion on reconstruction quality in most cases.
(a) No movement (b) 1 px per frame (c) 10 px per frame
Figure 4. If the object being imaged moves between frames, the assumption of staticity is violated, causing artefacts in the reconstructed normal field. This phenomenon is shown here, where the object of interest undergoes simulated lateral motion of varying degree between input frames: (a) No movement between frames, (b) 1 px motion left–right and (c) 10 px left–right. As seen, even small discrepancies can severely damage reconstruction.
(a)
(b) (c) (d)
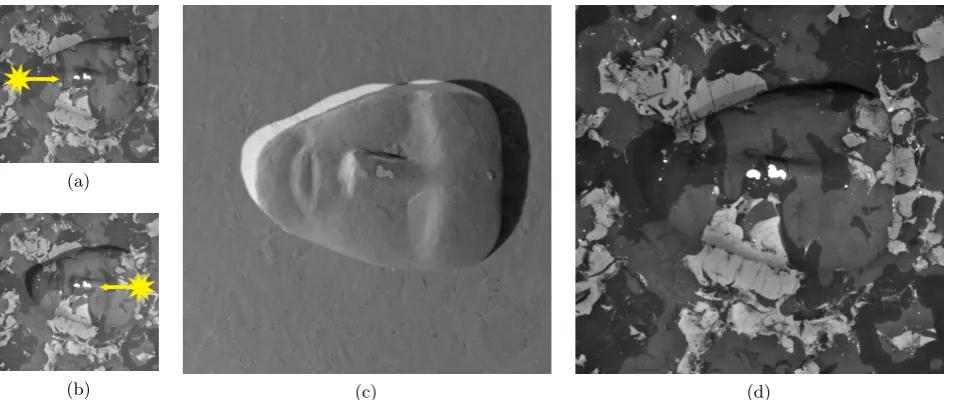
Figure 5. Two source photometric stereo can be achieved using two light sources positioned along thex-axis of the camera (a–b), in order to constrain the PS equations. While a full 3D reconstruction cannot be achieved directly using this method, the so-called “2.5D” reconstruction encodes fine grained shape data within thex-gradient of the surface (c). The method retains the advantage of separating colour and shape by isolating the surface albedo (d).
We position two lights on one of the camera’s axes — without loss of generality, here we focus on thex-axis (that is,y= 0). Given a pair of images,I1 andI2, and the incident directions of the two light sourcesL1= (lx1,0, lz1) andL2= (lx2,0, l
z
2), the photometric stereo equations from Equation (1) reduce to:
I1(x, y) =ρ(l1xNx+l1zNz) (7)
I2(x, y) =ρ(l2xNx+l2zNz) (8)
The surface gradient in thex-direction, the “x-gradient”, under a given pixel (x, y) is defined as:
Gx(x, y) =Nx(x, y)
Nz(x, y)
[image:6.595.63.540.286.486.2]By combining (7), (8) and (9), we calculate thex-gradient directly from the image intensity and the incident directions of the light sources:
Gx(x, y) = I2(x, y)l z
1−I1(x, y)lz2
I1(x, y)lx
2−I2(x, y)lx1
(10)
Having obtained the x-gradient, calculation of the surface albedo simply involves taking the L2-norm of the estimated normal (using the simplifying assumption thatNy = 0):
ρ(x, y) =pN2
x+Nz2 (11)
This operation is computationally efficient and has the added advantage of inter-pixel independence and is thus highly parallelisable, enabling rapid calculation on a GPU.
3.2 Photometric stereo in the wild
The methods described thus far perform well under controlled conditions. We generally assume when using photometric stereo that lighting and staticity of the subject can be reliably controlled. The previous section discussed measures to allow loosened stacitity constraints, but lighting can be more difficult to control in a real world setting. Especially in outdoor scenes, the sun provides a strong, broad-spectrum source of nuisance lighting.
Ambient illumination can be effectively removed in post-processing using an image captured without additional artificial light, improving the contrast of the image. This approach adds an extra image into the capture sequence, and can potentially provide a new source of error if there is movement within the scene. Nevertheless, we consider the improved image quality worth the compromise and use this technique in the experiments that follow.
4. ACTIVE ILLUMINATION IN DAYLIGHT
The Earth’s atmosphere is not a uniform layer surrounding the globe, but is rather composed of a complex mixture of gases, particles and liquids that varies considerably for a given location depending on factors such as time of year, weather, temperature, altitude, latitude, vegetation and local industry and pollution. Many components within the atmosphere absorb a portion of the sun’s light, but chief among these is atmospheric water vapour.16 Figure 6(a) shows light transmittance through the atmosphere on sea level transmission paths, based on US Navy Data. We modelled the effects of water vapour transmittance of light at various wavelengths using the US National Energy Laboratory’s SMARTS (Simple Model of the Atmospheric Radiative Transfer of Sunshine),22 with parameters set for Bristol, UK in summertime. We obtained qualitatively similar results to those in Yates and Tayor (1960),16 as shown in Figure 6(b). From this can be seen a series of transmittance minima (or equivalently, absorption peaks) in the infrared spectrum, at around 940 mn, 1150 nm and 1370 nm. At these wavelengths, relatively little of the sun’s radiation passes through the atmosphere, meaning that ambient illumination at ground level is greatly reduced. This work takes advantage of these absorption peaks for the purposes of machine vision and photometric stereo. To achieve this, a bandpass filter is placed in front of an nIR sensitive camera sensor to isolate an appropriate wavelength, and illuminators at this same wavelength used to overpower ambient light. We here exploit the 940 nm absorption peak, choosing this wavelength as it is lies well within the sensitivity ranges of commonly available nIR sensors.
4.1 Short range illumination discrimination (1–5 m)
(a)
600 800 1000 1200 1400 1600 0%
50% 100%
Wavelength (nm)
T
ransmittance
(b)
Figure 6. (a): Light transmittance in the atmosphere in the wavelength range 500–1600 nm over a distance of 0.3 km, measured in April 1960 in Chesapeake Bay, USA. Reproduced from Yates and Taylor (1960).16 (b): Effects of water vapour on light transmittance in the atmosphere in the range 500–1600 nm, modelled using SMARTS (Simple Model of the Atmospheric Radiative Transfer of Sunshine),22version 2.9.5. with location parameters set for summertime in Bristol, UK. Note the large local minima at three points within the infrared spectrum.
with the reflectance target pointed away from the sun. At each distance and for each camera, pairs of images were collected within a few seconds of each other with and without artificial illumination. A 50 mm f/2.8 lens was used with the aperture fixed at nearly closed, and all camera exposure settings were set to manual and left unchanged throughout the experiment. Using a lux meter, approximate ambient illumination at the reflectance target was also obtained for each pair of measurements. These were in the range 5–10 klx. For each image the area showing the reflectance target was isolated, the mean intensity of pixels (scaled for relative shutter speed) in this area calculated and their standard deviation obtained. The results are shown in Figure 7. The intensities, normalised by shutter speed, are shown in Figure 7. The difference in pixel intensity between lit and unlit images was calculated, and these differences are shown in Figure 9.
The results show small but noticeable differences in mean pixel intensity between images with illumination on and off — it is certainly possible to discriminate between artificial and ambient lighting. The difference between illumination modes drops off sharply with increased distance, becoming almost indistinguishable by 5 m. This indicates that the power and focus of the LED illuminators is insufficient for long range work. The LEDs have a wide divergence angle, and so their irradiance is reduced rapidly at distance — more focused illuminators with the same radiant flux would be more effective. Also note that the black silicon camera displays considerably higher sensitivity than the traditional nIR camera at both wavelengths.
4.2 Long range illumination discrimination (5–15 m)
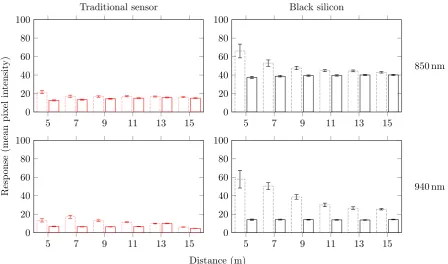
The same experiments were repeated at greater distance using more powerful, focused LED illuminators (divergence angle 6–10◦), custom built and provided to us by Aralia Systems Ltd. We used a 100 mm f/2.8 lens and collected images between 5 m and 15 m at 2 m increments. Otherwise the procedure was the same as in Section 4.1, with lux readings of 4–7 klx. Identical calculations to those above were carried out, and the results are shown in Figure 8. The overall pixel intensity is reduced due to the greater distance, but once again the black silicon camera is shown to be far more sensitive than the traditional sensor at both wavelengths, and the effect is even more pronounced at these distances. Illumination discrimination between artificial and ambient is apparently improved over the short range results (see also Figure 9); this is likely due to a combination of more powerful, better focused artificial illumination and a slightly less sunny day.
4.3 Extreme range (15 m+)
[image:8.595.66.540.78.246.2]1 2 3 4 5 0 20 40 60 80 100 Traditional sensor
1 2 3 4 5
0 20 40 60 80 100 Black silicon
1 2 3 4 5
0 20 40 60 80 100
1 2 3 4 5
0 20 40 60 80 100 Distance (m) Resp onse (mean pixel in tensit
y) 850 nm
[image:9.595.77.525.80.346.2]940 nm
Figure 7. Plots showing camera response with white reflectance target at distances from 1–5 m from camera and LED illuminators. Dotted bars indicate measurements taken with LED illumination, solid bars with ambient light only. Error bars are standard deviation of measured pixel intensity.
5 7 9 11 13 15
0 20 40 60 80 100 Traditional sensor
5 7 9 11 13 15
0 20 40 60 80 100 Black silicon
5 7 9 11 13 15
0 20 40 60 80 100
5 7 9 11 13 15
0 20 40 60 80 100 Distance (m) Resp onse (mean pixel in tensit
y) 850 nm
940 nm
[image:9.595.77.526.399.663.2]1 2 3 4 5 0
5 10
Short Range
5 7 9 11 13 15
0 20 40
Long Range
1 2 3 4 5
0 5 10
5 7 9 11 13 15
0 20 40
Distance (m)
Discriminatory
abilit
y
(normalised
pixel
in
tensit
y)
850 nm
[image:10.595.83.524.71.341.2]940 nm
Figure 9. This plot shows the two cameras’ ability to discriminate between ambient and artificial illumination at distance. Values represent the mean difference in pixel intensity between images taken with and without artificial illumination. Red lines indicate the traditional camera, black lines the black silicon camera. The black silicon camera outperforms the traditional sensor at both 850 nm and 940 nm, although the difference is more pronounced in the 940 nm range, supporting the use of this wavelength with its higher atmospheric absoprtion of light for long range computer vision applications. The apparentincrease in discriminatory ability in the 5–15 m range (note the difference in thexandyscales between the left and right plots) is due to the more powerful, more narrowly focused illuminators being used here, and lower ambient illumination. Error bars are one standard deviation of normalised pixel intensity.
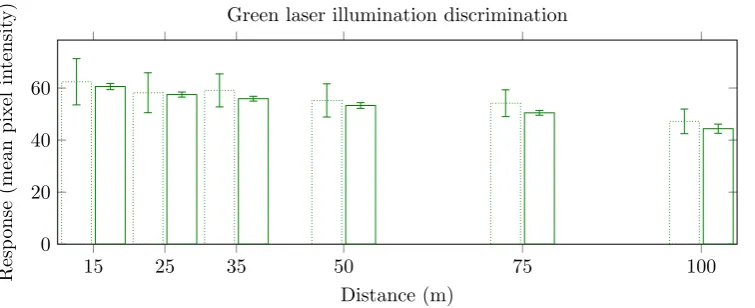
<100 nm) in front of the camera lens. We tested this configuration between 15 m and 100 m, and it was certainly possible to detect its illumination at this range — see Figure 10 — and the beam divergence was low enough to still adequately focus on the target. However at distances beyond about 50 m a pattern of concentric circles became visible in the laser’s beam profile, rendering it unsuitable for dense reconstruction techniques such as photometric stereo.
15 25 35 50 75 100 0
20 40 60
Distance (m)
Resp
onse
(mean
pi
xe
l
in
tensit
y) Green laser illumination discrimination
[image:11.595.62.440.74.228.2]Figure 10. Plots showing camera response with white reflectance target at distances from 15–100 m from camera and laser. Dotted bars indicate measurements taken with LED illumination, solid bars with ambient light only. Error bars are standard deviation of measured pixel intensity.
Figure 11. Example im-age of the green laser on the reflectance target (shown at 35 m).
5. LONG-RANGE PHOTOMETRIC STEREO
5.1 Face recognition
2D face detection and recognition has been widely and thoroughly explored in the literature (see references23–28 for some important developments), but has the disadvantage that without additional countermeasures it can be readily fooled by printouts or images of a face on an LCD screen.29 By capturing 3D information about a face shape, the ability of a casual user to spoof the system becomes more limited — carrying a 3D model of a face is rather less practical than a photo. Previous work has shown the abilities of a four source photometric stereo system in capturing1and recognising30faces; however the system in question was limited to indoor use under controlled lighting conditions.
To test whether long range photometric stereo produces images suitable for the challenging vision task of 3D face recognition, we first captured two source PS data using the previously described long range setup at both 10 m and 15 m. A conventional, short-range, indoor photometric stereo capture system was then used to capture a number of training images of the two individuals. Following enrolment with the Photoface system,31the surface normals of the training images were calculated. The results were automatically cropped to a central portion of the face and resized to an 80×80 pixel square and added to the Photoface database.31, 32 The new, augmented database was then processed to consist of only thex-gradients, ensuring compatibility with two source data. Our long range test images were likewise cropped and resized. Thex-gradients were calculated as previously discussed and these were used as probes against the database. Following the recognition strategy of Hansen and Atkinson,30 we assessed the ability of the system to recognise enrolled subjects from the input data.
In our testing, the system was able to successfully recognise the subject from the long-range images at both 10 m and 15 m, given a frontal view, examples of which are provided in Figure 12. Further work is required to assess the robustness of this method in scenes with more challenging views of the subject; however we believe the ability of our system to perform 3D face recognition at such distances, in daylight, shows substantial promise.
5.2 Object detection
Photometric stereo lends itself well to the task of object detection, having the aformentioned advantage of separating albedo and shape. This allows us to essentially “see through” traditional camouflage patterns and expose concealed objects. In this section we outline preliminary results for automated detection of concealed objects, which could provide rich 2.5D and 3D information to warn a human operator of potential weapon risks.
(a) (b) (c)
Figure 12. A number of close-range, two source PS training images were used to augment a modified version of the Photoface database,31a representative selection of which are shown in (a). We then test the usability of long-range 3D
data to recognise known faces, using the recognition strategy of Hansen and Atkinson30and input data garnered from images taken at 10 m (b) and 15 m (c). In both cases, the system was able to successfully identify the subject from the long-range images.
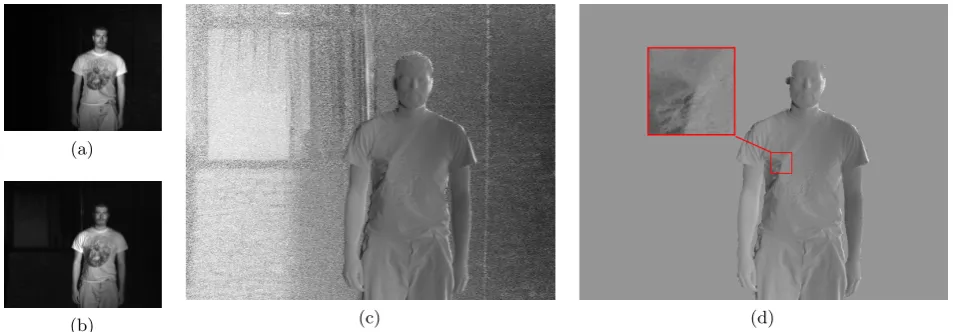
(a)
(b) (c) (d)
Figure 13. We capture high-fidelity shape information using the two source PS technique. (a) and (b) show images illuminated from left and right respectively, brightened here for illustrative purposes. We use a third, unlit image (not shown) to allow us to account for ambient illumination. The ambient removal tends to produce high levels of salt-and-pepper noise in background regions, as evidenced in (c), which is readily isolated using methods from the literature,33providing the result shown in (d). Note the fine-grained of wrinkles in the clothing. The point at which a concealed object presses against the fabric is highlighted.
a range of between 10 and 15 metres, which we believe to be far beyond what has previously been shown possible using photometric stereo.
We began by capturing three images: two PS images,I1,2 and a further unlit imageIa to allow us to correct for ambient light. The ambient image was subtracted from the illuminated ones to provide a corrected view.
We used the two corrected images to reliably calculate the surfacex-gradient (as per Section 3.1). An unfortunate side-effect of ambient light removal is that salt-and-pepper image noise is emphasised in the background after calculation of the surface gradients, as shown in Figure 13. Such noise can be readily isolated and masked using the method of Deivalakshmiet al.,33 or similar.
We assume hereafter that a region of interest (RoI) around a human can be identified, for instance by using pose estimation, motion information, or by detecting a face and extracting the connected foreground region. From thex-gradient image of the person alone, we can readily see shape detail that was not discernible from the 2D images. The prominence of the end of the concealed baton in the example of Figure 13 is clearly visible; however automated detection requires further investigation.
[image:12.595.62.539.250.416.2](a) (b) (c) (d) (e)
Figure 14. Using two artificially illuminated images (a), we calculate thex-gradient of the surface (b) — a manual RoI is shown for clarity of display. To detect concealed objects using thex-gradient, we examine its first order derivatives (c). Where both components are high, one would expect to see a point on the surface, corresponding to a concealed object distorting the fabric. High frequency noise is removed using a Gaussian blur (d) and the result thresholded at the mean plus one standard deviation to provide a labelled response (e). The position of the concealed baton used in this example is indicated in red in (a) and (e).
(a) (b) (c) (d)
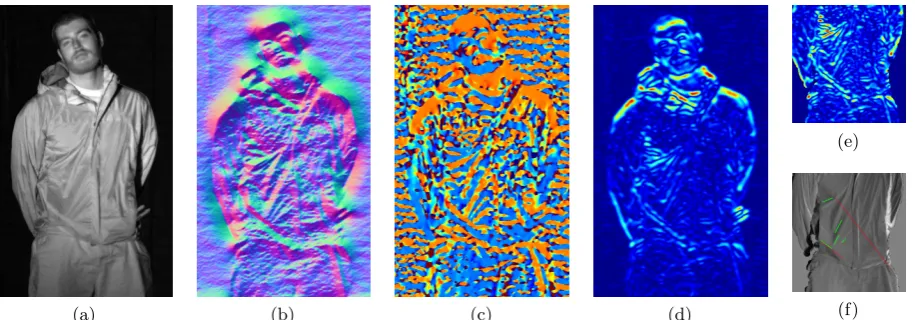
(e)
(f)
Figure 15. By enforcing integrability across the reconstructed surface, we can estimate its surface orientations using only two images.20 An example of such an image, brightened here for easier viewing, is shown in (a). We can then use the
surface normal information (b) calculated through this technique to examine shape in a more complex manner, using the “Shape Index” and “Curvedness” measurements proposed by Koenderink and Van Doorn,34 shown in (c) and (d). By
performing line detection on a RoI of the edge representation of the curvedness, (e), we can highlight creases in fabric caused by concealed objects, (f).
δ2z/δx2andδ2z/(δxδy). By filtering the derivative images by a small Gaussian kernel (in this case 5×5,σ= 3), then thresholding at the mean plus one standard deviation, we can detect and highlight areas of interest, as demonstrated in Figure 14.
Within this work, we have also examined the prospect of using full 3D information to encapsulate shape. Although we cannot directly calculate the full 3D reconstruction — or surface normal field — from two images, we can infer it by exploiting an assumption of integrability across the surface.20 The resulting reconstruction is not as reliable, nor as precise, as a three or more source PS approach, but we still obtain useful indicators as to surface shape, which can be used to indicate the presence of concealed objects.
[image:13.595.74.532.299.459.2]perspective of the reader) and one under the jacket from bottom-right to top-left. There are visible artefacts in the Shape Index image; however these are unlikely to be readily identifiable using an automated method. We use the curvature to look for ripples in the fabric, indicating pressure against it. We estimate strong lines by applying Canny edge detection to the curvedness image and applying a Hough line detector. The resulting edges tend to appear around the concealed objects, highlighted in red in Figure 15(f), suggesting promise for further development.
6. CONCLUDING REMARKS
The work presented in this paper has demonstrated the ability to covertly capture highly detailed 2.5D and 3D data at long range, in conditions with challenging ambient illumination. The novelty of our approach lies in exploiting a peak in the atmospheric absorption of light at 940 nm and state-of-the-art black silicon sensor technology. We have shown that the sensitivity of the camera, combined with the lower ambient light levels at this point in the spectrum, allows for far greater discrimination between ambient and artificial lighting than was previously possible using the more traditional 850 nm wavelength and CMOS sensors. Of particular importance is our ability to do so under conditions involving bright sunlight, which has hitherto prohibited successful capture and reconstruction using artificial lighting.
This allowed us to use photometric stereo for surface reconstruction at far greater distances — up to 15 m — than have previously been possible outdoors and under direct sunlight, obtaining high resolution 2.5D and 3D information while separating colour from shape. Finally, the data captured using PS has been shown to have application, at long range, for the common security problems of face recognition and the detection of concealed objects.
The next step is to expand upon our current system using the 940 nm laser, which we anticipate will improve our ability to discriminate artificial lighting in excess of 100 m. Further work will also look to improve on the promising preliminary results of the object detection methods presented here.
ACKNOWLEDGMENTS
This work was made possible by Technology Strategy Board funding for “Seeing More Than Before”, project reference number 131749, and the ongoing financial and technical support of Aralia Systems Ltd.
REFERENCES
[1] Hansen, M. F., Atkinson, G. A., Smith, L. N., and Smith, M. L., “3D face reconstructions from photometric stereo using near infrared and visible light,”Computer Vision and Image Understanding114, 942–951 (2010).
[2] Sun, J., Smith, M., Farooq, A., and Smith, L., “Concealed object perception and recognition using a photometric stereo strategy,” in [Advanced Concepts for Intelligent Vision Systems], Blanc-Talon, J., Philips, W., Popescu, D., and Scheunders, P., eds.,Lecture Notes in Computer Science5807, 445–455, Springer Berlin Heidelberg (2009). [3] Woodham, R. J., “Photometric method for determining surface orientation from multiple images,”Optical
Engineer-ing19(1), 139–144 (1980).
[4] Bronstein, A. M., Bronstein, M. M., Spira, A., and Kimmel, R., “Face recognition from facial surface metric,” in [8th European Conference on Computer Vision, Proceedings, Part II],Lecture Notes in Computer Science3022, 225–237 (2004).
[5] Smith, M. L. and Stamp, R. J., “Automated inspection of textured ceramic tiles,”Computers in Industry1, 73–82 (2000).
[6] Pernkopf, F. and O’Leary, P., “Image acquisition techniques for automatic visual inspection of metallic surfaces,”
NDT&E International36, 609–617 (2003).
[7] Sun, J., Smith, M., Smith, L., Coutts, L., Dabis, R., Harland, C., and Bamber, J., “Reflectance of human skin using colour photometric stereo: with particular application to pigmented lesion analysis,” Skin Research and Technology14(2), 173–179 (2008).
[8] Sohaib, A., Farooq, A. R., Atkinson, G. A., Smith, L. N., Smith, M. L., and Warr, R., “In vivomeasurement of skin microrelief using photometric stereo in the presence of interreflections,”Journal of the Optical Society of America A30(3), 278–286 (2013).
[10] Hansson, P. and Johannson, P., “Topography and reflectance analysis of paper surfaces using a photometric stereo method,”Optical Engineering39(9), 2555–2561 (2000).
[11] Ackermann, J., Langguth, F., Fuhrmann, S., and Goesele, M., “Photometric stereo for outdoor webcams,” in [IEEE Conference on Computer Vision and Pattern Recognition (CVPR)], (2012).
[12] W¨ohler, C. and Grumpe, A., [Integrated DEM Construction and Calibration of Hyperspectral Imaging: A Remote Sensing Perspective], ch. 21, 467–492, Mathematics and Visualization, Springer-Verlag Berlin Heidelberg (2013). [13] Sun, J., Smith, M., Farooq, A., and Smith, L., “Counter camouflage through the removal of reflectance,” in [The 3rd
International Conference on Machine Vision (ICMV 2010)], 35–39 (2010).
[14] Malzbender, T., Wilburn, B., Gelb, D., and Ambrisco, B., “Surface enhancement using real-time photometric stereo and reflectance transformation,” in [Rendering techniques 2006: 17th Eurographics Workshop on Rendering], 245–250 (2006).
[15] Horvath, H., “Atmospheric light absorption — a review,”Atmospheric Environment27A(3), 293–317 (1993). [16] Yates, H. W. and Taylor, J. H., “Infrared transmission of the atmosphere,” tech. rep., U. S. Naval Research Laboratory
(1960).
[17] Carey, J. E., Crouch, C. H., Sheehy, M. A., Shen, M., Friend, C. M., and Mazur, E., “High sensitivity silicon-based VIS/NIR photodetectors,” in [Conference on Lasers and Electro-Optics (CLEO) 2004],2, 2– (2004).
[18] Sarnet, T., Carey, J. E., and Mazur, E., “From black silicon to photovoltaic cells, using short pulse lasers,” in [International Symposium on High Power Laser Ablation 2012],AIP Conference Proceedings1464, 219–228 (2012). [19] Woodham, R. J., “Photometric stereo: A reflectance map technique for determining surface orientation from image intensity,” in [Image Understanding Systems and Industrial Applications I], Proceedings of SPIE0155, 136–143 (1979).
[20] Onn, R. and Bruckstein, A., “Integrability disambiguates surface recovery in two-image photometric stereo,” Interna-tional Journal of Computer Vision5(1), 105–113 (1990).
[21] Frankot, R. T. and Chellappa, R., “A method for enforcing integrability in shape from shading algorithms,”IEEE Transactions on Pattern Analysis and Machine Intelligence10, 439–451 (1988).
[22] Gueymard, C. A., “Interdisciplinary applications of a versatile spectral solar irradiance model: a review,”Energy30, 1551–1576 (2005).
[23] Kanade, T., [Computer recognition of human faces], Birkhauser, Basil, Switzerland and Stuttgart, Germany (1973). [24] Turk, M. and Pentland, A., “Eigenfaces for recognition,”Journal of Cognitive Neuroscience3(1), 71–86 (1991). [25] Belhumeur, P. N., Hespanha, J. P., and Kriegman, D. J., “Eigenfaces vs. Fisherfaces: recognition using class specific
linear projection,”IEEE Transactions on Pattern Analysis and Machine Intelligence19(7), 711–720 (1997). [26] Viola, P. and Jones, M., “Rapid object detection using a boosted cascade of simple features,” in [Proceedings of
the 2001 IEEE Computer Society Conference on Computer Vision and Pattern Recognition, 2001 (CVPR 2001)],1, 511–518 (2001).
[27] Zou, X., Kittler, J., and Messer, K., “Face recognition using active near-IR illumination,” in [Proceedings of the British Machine Vision Conference], 209–219 (2005).
[28] Wright, J., Yang, A. Y., Ganesh, A., Sastry, S. S., and Ma, T., “Robust face recognition via sparse representation,”
IEEE Transactions on Pattern Analysis and Machine Intelligence31(2), 210–227 (2009).
[29] Bait, J., Ng, T.-T., Gao, X., and Shi, Y., “Is physics-based liveness detection truly possible with a single image?,” in [IEEE International Symposium on Circuits and Systems], 1–7 (2010).
[30] Hansen, M. F. and Atkinson, G. A., “Biologically inspired 3D face recognition from surface normals,” in [Proceedings of the International Conference and Exhibition on Biometrics Technology], 26–34 (2010).
[31] Zafeiriou, S., Atkinson, G., Hansen, M., Smith, W. A. P., Argyriou, V., Petrou, M., Smith, M. L., and Smith, L. N., “Face recognition and verification using photometric stereo: the Photoface database and a comprehensive evaluation,”
IEEE Transactions on Information Forensics and Security8(1), 121–135 (2013).
[32] Zafeiriou, S., Hansen, M., Atkinson, G., Argyriou, V., Petrou, M., Smith, M., and Smith, L., “The Photoface database,” in [2011 IEE Computer Society Conference on Computer Vision and Pattern Recognition Workshops (CVPRW)], 132–139 (2011).
[33] Deivalakshmi, S., Sarath, S., and Palanisamy, P., “Detection and removal of salt and pepper noise in images by improved median filter,” in [Recent Advances in Intelligent Computational Systems (RAICS), 2011 IEEE], 363–368 (2011).