1European Southern Observatory, Karl-Schwarzschild-Str. 2, 85748, Garching, Germany 2Leiden Observatory, Leiden University, P.O. Box 9513, NL-2300 RA Leiden, The Netherlands 3Department of Physics, Lancaster University, Lancaster, LA1 4YB, UK
4Institute for Astronomy, University of Edinburgh, Royal Observatory, Blackford Hill, Edinburgh EH9 3HJ UK
31 March 2017
ABSTRACT
While traditionally associated with active galactic nuclei (AGN), the properties of the CII], CIII] and CIV emission lines are still uncertain as large, unbiased samples of sources are scarce. We present the first blind, statistical study of CII], CIII] and CIV
emitters at z∼0.68,1.05,1.53, respectively, uniformly selected down to a flux limit of
∼4×10⁻¹⁷erg s−1cm−1through a narrow band survey covering an area of∼1.4 deg2over
COSMOS and UDS. We detect 16 CII], 35 CIII] and 17 CIVemitters, whose nature we in-vestigate using optical colours as well asHST, X-ray, radio and far infra-red data. We find that z∼0.7 CII] emitters are consistent with a mixture of blue (UV slopeβ =−2.0±0.4)
star forming galaxies with disky HSTstructure and AGN with Seyfert-like morphologies.
Bright CII] emitters have individual X-ray detections as well as high average black hole ac-cretion rates (BHAR) of∼0.1Myr−1. CIII] emitters atz∼1.05 trace a general population of SF galaxies, with β =−0.8±1.1, a variety of optical morphologies, including isolated
and interacting galaxies and low BHAR (<0.02Myr−1). Our CIVemitters atz∼1.5 are consistent with young, blue quasars (β ∼ −1.9) with point-like optical morphologies, bright
X-ray counterparts and large BHAR (0.8Myr−1). We also find some surprising CII], CIII] and CIV emitters with rest-frame equivalent widths which could be as large as 50−100 ˚A. AGN or spatial offsets between the UV continuum stellar disk and the line emitting regions may explain the large EW. These bright CII], CIII] and CIVemitters are ideal candidates for spectroscopic follow up to fully unveil their nature.
Key words: galaxies: high redshift, star formation, active, quasars: emission lines, cosmol-ogy: observations
1 INTRODUCTION
Rest-frame ultra-violet (UV) emission lines are of great importance for extragalactic astrophysics as they can be used to infer gas metal-licities, temperatures and the strength of the ionising field (e.g.
Shapley et al. 2003;Osterbrock & Ferland 2006). Observing these lines in the local Universe is challenging. However, for galaxies at large cosmic distances the rest-frame UV emission lines are red-shifted into the easily observable optical range. Historically rest-frame UV spectra were mainly used to spectroscopically confirm
UV-bright galaxies atz&3 selected through the Lyman Break
tech-nique (Lyman Break galaxies, LBG,Steidel et al. 1996;Lowenthal
et al. 1997). In the last 15 years, strong rest-frame UV lines have
been discovered in a variety of galaxies atz>1, which could be
used to constrain the physics in high-redshift counterparts of
lo-? E-mail: [email protected] † ESO Fellow
cal galaxies (Best et al. 2000;Shapley et al. 2003;Erb et al. 2010;
Rigby et al. 2015).
Intrinsically the brightest rest-frame UV line is Lyα, which
is produced in HII regions as well as in galaxies with an active
galactic nucleus (AGN) (e.g.Ouchi et al. 2008;Nilsson et al. 2009;
Cowie et al. 2010;Hayes 2015;Matthee et al. 2016,2017;Sobral et al. 2017). However, it is difficult to interpret observations of Lyα, as the line is scattered by neutral hydrogen and easily absorbed by
dust (e.g.Dijkstra 2014;Hayes 2015). The amount of Lyαthat
es-capes a galaxy therefore depends on the properties of the interstellar medium.
Other UV lines, such as CII], CIII] and CIV(Table1) have
recently been explored as they can be relatively bright compared
to Lyα and can be used either individually or in combination to
constrain the physics of the host galaxy. CIII] (ionisation
poten-tial of 24.4 eV, Veilleux 2002), for example, was found to be the
strongest UV line after Lyαin stacks of LBGs atz∼3 (Shapley et
al. 2003) and about 10 per cent of the observed strength of Lyαin
Table 1.Line emitters studied in this work, with rest-frame wavelength, ionisation energyχ(Veilleux 2002), luminosity distanceDLand redshift range traced by the NB392 filter, with central wavelength 3919 ˚A and FWHM of 52 ˚A. The sample is drawn from the emission line catalogue presented inSobral et al.
(2017), which focuses on selection and properties of Lyαemitters atz∼2.2.
Line λline χ zline DL Comments
( ˚A) (eV) at FWHM (103Mpc)
CII] 2326 11.3 0.673−0.696 4.14 likely traces shocks around AGN CIII] 1907, 1909 24.4 1.039−1.066 7.04 produced in SF and BLR of AGN
CIV 1549, 1551 47.9 1.513−1.546 11.47 likely produced in BLR of AGN or in gas around very massive stars
faint, lensed galaxies at 1.5<z<3 (Stark et al. 2014). CIV(47.9
eV) is also a bright UV line, with a typical ratio of just below one
with CIII] (e.g.Gutkin et al. 2016;Feltre et al. 2016).
High ionisation rest-frame UV emission lines of Carbon were originally thought to originate from close to the AGN engine as
they require a strong radiation field and high temperatures. CIII] is a
high-ionisation, intercombination doublet (1907,1909 ˚A) expected
to be mostly produced in the outer parts of the broad line region
(BLR) of the AGN (Osterbrock & Ferland 2006). However, atz∼
2−3, CIII] emitters are also found in star forming (SF) galaxies and
trace a slightly sub-solar metallicity, a high ionization parameter
and a hard radiation field (Rigby et al. 2015;Bayliss et al. 2014).
Photoionisation models presented inJaskot & Ravindranath(2016)
indicate that CIII] can be produced in starburst galaxies and is the
strongest line (withλ<2700 ˚A) after Lyα.
UV collisionally excited lines such as CII] and CIV are
stronger in very high temperature regions (2×10⁴−105K) in the
cooling region behind shocks around the AGN than in areas with lower temperature such as those that can be reached with
photoion-isation (104K,Osterbrock & Ferland 2006;Allen et al. 1998). CII]
and CIVare therefore expected to be more strongly produced in
AGN hosting galaxies. Indeed,Baldwin(1977) found a correlation
between the strength of the resonant CIV(1548,1551 ˚A) line and
the continuum luminosity, indicating that the line emitting gas is located very close to the ionisation source. While traditionally
as-sociated with BLR emission, CIVwas found to be correlated with
gas temperature and an intense radiation field (Osterbrock &
Fer-land 2006), such as the one caused by AGN or by massive stars after
a recent SF episode (Stark et al. 2014;Mainali et al. 2016;Schmidt
et al. 2017). In a study of radio galaxies,De Breuck et al.(2000)
noted that CII] is five times more sensitive to shock ionisation than
high ionisation UV lines, such as CIV. Therefore, there is
com-pelling evidence that the semi-forbidden CII] (11.3 eV, Veilleux
2002) line traces shocks and in combination with other lines is
ef-fective in determining the power source of ionisation (Best et al.
2000,2002).
While independently CII], CIII] and CIVtrace gas metallicity
and electron density, in combination they can be used as estimators which are, to first order, independent of abundance, metallicity and
dust-extinction (Best et al. 2002). Therefore, CII], CIII] and CIV
line ratios are some of the best diagnostics to separate excitation by
fast shocks and photoionisation in a hard photon spectrum (Allen
et al. 1998).
Given their relative strength to Lyα, CIII] and CIVhave been
proposed as a good avenue for spectroscopically confirming high
redshift galaxies (Stark et al. 2014, 2015a,b), particularly within
the epoch of reionisation, when Lyα scattering is expected to
in-crease leading to a significant dein-crease of surface brightness. As a
result, in recent years, targeted searches for CIII] and CIVemitters
at high redshift have emerged. For example,Rigby et al.(2015)
de-tect CIII] in 11z∼1.6−3 lensed galaxies, andBayliss et al.(2014)
find strong CIII] in az∼3.63 lensed starburst.Stark et al.(2015a)
present tentative detections of CIII] in two galaxies atz>6, while
Ding et al.(2016) detect CIII] in one galaxy atz∼5.7. By
con-trast,Zitrin et al.(2015a) do not obtain a detection of CIII] in a
sample of 7z∼7−8 photometric candidates. Very recently,Du
et al.(2016) presented a spectroscopic study of a sample of
con-tinuum selected CIII] emitters atz∼1. With a detection rate of
∼20 per cent, their CIII] emitters have much lower EW (1.3 ˚A)
than higher redshift examples.Du et al.(2016) also found that the
stronger EW sources appear in fainter, bluer and lower-mass galax-ies.Schmidt et al.(2017) andMainali et al.(2016) obtain a
detec-tion of CIVin a multiply-lensedz=6.1, Lyα-emitting SF galaxy,
but without a CIII] detection. Despite the growing number of
de-tections, the samples of CIII] and CIVemitters suffer from
selec-tion biases (e.g. spectroscopically selected, lensed sources, redshift
known from Lyα).
Despite the potential importance of CII], CIII] and CIV for
understanding AGN physics and the nature of stellar populations at high redshift, not much is known about these emitters in a statisti-cal sense, as no blind studies have been performed. As such, the na-ture, number densities and EW distributions are largely unknown.
We seek to improve our understanding of CII], CIII] and CIV
emit-ters by performing the first blind survey of these lines, without any
preselection in terms of Lyα or UV properties. Our sample is
uni-formly selected down to a flux of∼4×10⁻¹⁷ erg s−1cm−2, in
three redshift slices aroundz∼0.7,∼1.0,∼1.5 for CII], CIII]
and CIV, respectively. The limiting observed EW is 16 ˚A and the
limitingUmagnitude is∼26.5. The sources were discovered by
exploring the∼1.4 deg2CAlibrating LYMan-αwith HαNB
sur-vey (CALYMHA,Matthee et al. 2016;Sobral et al. 2017) over the
COSMOS and UDS fields.
Our results are presented in two parts. In this paper (Paper I), we use the emission line data in combination with multiwavelength observations in the optical, radio, X-ray and far infra red (FIR) to
unveil the characteristics of individual CII], CIII] and CIVemitters
selected with the CALYMHA survey. We study the likely physical origin of the emission lines and how their properties compare with AGN and SF galaxies at similar redshifts. In the companion paper
(Paper II, Stroe et al. 2017b) we investigate the statistical
proper-ties of the CII], CIII] and CIVemitters through luminosity functions
(LF) and obtain the volume-average line ratios relative to e.g. Lyα
and Hα.
We organise the paper as follows: in Section2we present the
CALYMHA parent sample, while in Section3we select the CII],
CIII] and CIVemitters. We discuss the colour and EW properties of
the emitters as well as their Hubble Space Telescope (HST), radio,
far infra-red (FIR) and X-ray properties in Section4. The
Figure 1.Photometric versus spectroscopic redshift for our NB392 line emitters, using data from e.g.Ilbert et al.(2009),Cirasuolo et al.(2010) andLilly et al.(2009), as well as our own X-SHOOTER Very Large Tele-scope follow-up. The grey shaded areas indicate the redshift ranges where the NB filter is sensitive to CII], CIII] and CIV. The top panel shows the dis-tribution of spectroscopic redshifts, where we also mark the main emission lines picked up by the NB filter.
and CIVproduction can be found in Section5, with conclusions
and outlook in Section6.
Throughout the paper, we use a flatΛCDM cosmology (H0=
70 km s−1Mpc−1,ΩM=0.3,ΩΛ=0.7), and perform calculations
with the aid of theWright(2006) cosmology calculator. All
mag-nitudes are in the AB system and we use aChabrier(2003) initial
mass function (IMF).
2 SURVEY DESCRIPTION
We use the CALYMHA sample of emission line galaxies to select
CII] (z∼0.63), CIII] (z∼1.05) and CIV(z∼1.53) line emitters
in the COSMOS and UDS fields. The CALYMHA survey design,
observations and data reduction is presented in full inSobral et al.
(2017) and here we give a brief summary of the survey strategy and
goals. The programme surveyed a combined area of∼1.4 deg2
in the COSMOS and UDS fields using a narrow band (NB) filter
(NB392, central wavelengthλC=3918 ˚A and width∆λ =52 ˚A)
mounted on the Isaac Newton Telescope1. The NB filter was
de-signed to select line emitters, with a particular focus on Lyα
emit-ters atz∼2.23, and cross-match them with Hαgalaxies at the same
redshift (Sobral et al. 2013). The main goal of the survey is to unveil
the nature of Lyαemitter by studying the luminosity function (LFs)
and determining Lyαescape fractions as function of galaxy
prop-erties both for Hαand Lyαselected samples atz∼2.2 (Matthee et
al. 2016;Sobral et al. 2017).
The CALYMHA COSMOS+UDS survey selected a total of
[image:3.595.50.284.106.350.2]1 http://www.ing.iac.es/Astronomy/telescopes/int/
Figure 2.Histogram of all photometric redshifts, focusing on CII], CIII] and CIV. Note the narrow ranges chosen for selection of sources based on photometric redshifts, ensuring that low redshift (z<0.4) emitters such as [OII], [NeV], MgIand MgIIare rejected.
440 line emitters down to a 3σ line flux limit of ∼4×10⁻¹⁷
erg s−1cm−2, down to an observed EW limit of 16 ˚A. Based on
spectroscopic and photometric redshifts, the emitter population
contains a significant fraction of CII], CIII] and CIVemitters (
So-bral et al. 2017), thus rendering CALYMHA an ideal sample to study these emitters in a statistical, unbiased way with a clear selec-tion funcselec-tion. Given the width of the NB filter and their rest-frame wavelength, the line emitters are traced over a narrow redshift range
(see Table1).
2.1 Ancillary data
In addition to the CALYMHA NB andUband data, we use
ancil-lary spectroscopic and photometric redshifts and photometry from
the COSMOS and UDS surveys (Capak et al. 2007;Lawrence et al.
2007;Ilbert et al. 2009;Laigle et al. 2016). About 40 per cent of our
sources are faint in theiandKbands or are located in masked
re-gions and are thus not included in the publicly available COSMOS and UDS catalogues. There are 80 emitters with spectroscopic
red-shifts, most of which also have a photometric redshift (Fig.1, data
fromYamada et al. 2005;Simpson et al. 2006;van Breukelen et al. 2007;Geach et al. 2008;Ouchi et al. 2008;Smail et al. 2008;Lilly et al. 2009;Ono et al. 2010). However, in 10 cases, only a spectro-scopic redshift is available. We also include the redshifts derived bySobral et al.(2017) from dual, triple and quadruple detection of emission lines in NB filters. These very precise photometric red-shifts have accuracies close to a spectroscopic measurement. The total tally for sources with redshifts (spectroscopic or photometric) is 269, or 61 per cent of the total number of emitters.
We also explore the deep, publicly availableHSTdata in the
F814W filter (Koekemoer et al. 2007;Massey et al. 2010),Chandra
space telescope X-ray observations (Elvis et al. 2009), FIR
Her-scheldata (Oliver et al. 2012) and radio Very Large Array images
at 1.4 GHz (Schinnerer et al. 2004,2010) in the COSMOS field to
Table 2.Criteria for selecting a source as a CII], CIII] or CIVemitter. Thezspecranges used correspond to the full transmission range covered by the NB filter. Note that we are using conservativezphotcuts to minimise contamination. Sources selected as LyαbySobral et al.(2017) using colour-colour selections were removed from the sample. The number of sources of each type, selected based onzspecand additionalzphotare also listed.
Line zspecselection range zspecsources zphotselection range zphotsources All (sources withoutzspec)
CII] 0.661−0.707 3 0.63−0.75 13 16
CIII] 1.025−1.080 4 0.8−1.2 30 34
CIV 1.486−1.563 14 1.4−1.7 3 17
counterparts and/or coverage. The UDS field is partly covered with
HSTdata as part of the CANDELS survey (Koekemoer et al. 2011).
3 SELECTING CII], CIII] AND CIVEMITTERS
In order to select CII], CIII] and CIVemitters at the redshifts traced
by the NB392 filter, we use a combination of spectroscopic and photometric redshifts.
3.1 Redshifts
For the COSMOS field,Ilbert et al.(2009) derived photometric
red-shifts using a range of templates, including star, galaxy and quasar
templates for aniband selected sample. Blindly using the galaxy
templates results in large discrepancies between the chosen photo-metric redshift and the true redshift, when spectroscopy is
avail-able. Keeping in mind that a fraction of CII], CIII] and CIV
emit-ters is possibly tracing AGN activity, we expect in many cases the
quasar templates to perform better.Ilbert et al.(2009) also provide
theχ2for the best fit stellar, galaxy and quasar template. We found
that simply choosing the template which provided the lowestχ2fit
worked well: for the sources with bothzphotandzspec, the two
esti-mates matched (see Fig.1). When choosing the bestzphotestimate
based onχ2, 88 per cent of the photometric redshifts are within 0.1
of the spectroscopic ones. In cases where neither template was a
good fit (highχ2>100), all photometric redshift estimates were
catastrophically off.
We also tested the new COSMOSzphot catalogue presented
inLaigle et al.(2016) using the same method of selecting the best
template (minimising theχ2), but found that theIlbert et al.(2009)
photometric redshifts correlate better with the spectroscopic
red-shifts in our sample. Laigle et al.(2016) is selected in the near
infrared andIlbert et al.(2009) in the optical. Since our sources are
optically selected (in the very blue), it is maybe unsurprisingIlbert
et al.(2009)zphotwork better, given their weighting towards optical
bands. In the case of UDS, a single photometric redshift estimate is
available (Cirasuolo et al. 2010).
Overall, for the entire sample, 84 per cent of photometric
red-shifts are within 0.1 of the spectroscopic redshift (Fig. 1). The
sample is however not spectroscopically complete, especially for fainter sources, so the photometric redshift accuracy derived here is not necessarily applicable for all the sources without a
spectro-scopic redshift (Fig.2).
3.2 Final selection criteria
For a source to make the CII], CIII] or CIVemitter selection, we
first remove all sources selected as Lyα by Sobral et al.(2017).
It then has to fulfill at least one of the criteria listed below. We
summarise the criteria in Table2and describe them below:
• A spectroscopic redshift within the range probed by the
re-spective filter, within two FWHM. We choose this wider range since the filter transmission drops slowly towards its wavelength edges, effectively being sensitive to emitters at twice the FWHM. This also accounts for broad lines.
• If spectroscopy is not available, we select a source if is has
a photometric redshift within∼0.2 of the redshift range the NB
filter is sensitive to. Note our very conservative cuts are chosen to maximise the purity of the sample.
The redshift distribution of sources selected as CII], CIII] and
CIVis shown Fig.2. The narrow photometric redshift ranges
cho-sen for selection ensures that we do not include bright, low redshift
emitters such as [OII] atz∼0.05, [NeV] atz∼0.15 and MgIand
MgIIatz∼0.4 in our sample. Our photometric redshift selection
is conservative as there could be sources withzphotin the 1.2−1.4
range which could be either CIII] or CIV(Fig.2).
Sobral et al.(2017) usedBzKcolour selections to further
im-prove the completeness of their Lyαsample and thus include some
sources with lower photometric redshifts. If we did not remove the
Lyαselected sources, we would select an extra 9 CIII] and 16 CIV
sources. We remove sources selected as LyαbySobral et al.(2017)
to ensure a high purity and obtain conservative, but secure samples.
Note however, the highly unusual colours of CIVemitters (see
Sec-tion4.1), which means that some real CIVemitters might have been
selected as Lyαand thus were removed from our sample.
Spectro-scopic follow up is required to further investigate this. See also
dis-cussion inSobral et al.(2017) on the removal of the vast majority
of CIII] and CIVcontaminants in CALYMHA, which is usually not
done in other Lyαsurveys.
4 PROPERTIES OF THE CII], CIII] AND CIVSAMPLES
Table2lists the final samples of CII], CIII] and CIVemitters, which
include spectroscopically confirmed sources and sources selected
through theirzphot. We have 3 spectroscopically confirmed CII]
emitters in addition to 13zphot. In the case of CIII] emitters, we
have 4 spectroscopically selected sources and 30 withzphot. We
ob-tain 14 CIVsources withzspecand 3 withzphot. Note the particularly
high spectroscopic completeness of the CIVsample, a likely result
of the follow up of Chandra COSMOS sources.
In this section, we study the colour-colour properties as well as the colour and EW distributions with the aim of investigating
the nature of the CII], CIII] and CIV emitters, as well as test the
robustness of our sample. We also investigate the properties of the emitters using X-ray, radio and space telescope optical data.
Ta-bles3and4summarise the EW, UV, optical, X-ray and radio
prop-erties of the sample, while TablesB1,B2andB3describe
individ-ual CII], CIII] and CIVemitters. We list their sky coordinates, line
luminosity, rest-frameEWrest, observed(U−B)obscolours and
Figure 3.R−zversusJ−Kscolour-colour plot for the emitters. Lyαemitters atz∼2.23 from the CALYMHA survey (Sobral et al. 2017) and Hαemitters from the HiZELS project (Sobral et al. 2013) are also plotted. CII] and CIII] emitters are located in thez∼0.8−1.5 SF galaxy regime. However, the CIV
emitters have unusual colours, following the distribution of SF atz∼2.23, rather than 1.5.
counterparts. Note that while most of the COSMOS part of the
CA-LYMHA survey is covered byHSTand VLA radio data, the deep
Chandra data is only available for a sub-area. In the case of UDS,
onlyHSTdata is available and for a small subarea of the field.
To describe the properties of our CII], CIII] and CIVsources,
we will use the emission line luminosity, which is derived from the
observed flux measured within 300apertures (which corresponds to
about 30 kpc at the redshift of our emitters, see alsoSobral et al.
2017):
Lline=4πD2L(line)Fline, (1)
where line is CII], CIII] or CIVandDL(line)is the luminosity
dis-tance at the redshift of each line (see Table1).
4.1 Colour-colour properties
In SF galaxies, theR−zversus theJ−Kscolour space probes the
4000 ˚A break, which moves from between theRandzfilters for
sources atz∼0.7−1.2, to betweenJandKsfor sources atz>2.1.
In Fig.3, this is illustrated by the population of SF Hα emitters
fromSobral et al.(2013) which move from the lower-right side at
z∼0.8 (largeR−z, smallJ−Ks) of the plot towards the
upper-right side (smallR−z, largerJ−Ks) atz∼2.2. For comparison,
we also overplot the CALYMHA Lyαemitters atz∼2.2.
Some CII] emitters atz∼0.7 are located in the colour space
of SF galaxies atz∼1.5, so they have atypical colours for their
redshift, indicating that while some may trace SF galaxies, some, as expected, probably result from ionisation in AGN through shocks.
CIII] sources mostly lie in the region ofz∼0.8−1.0 SF
galax-ies, possibly indicating a SF, rather than AGN nature of these
emit-ters. Note that the most extreme CIII] emitter, with a very lowR−z
colour, is an AGN (see Section4.6) and the most luminous in the
emission line (∼1042.4erg s−1).
Given the large ionisation energy necessary to produce CIV, it
is expected that CIVrequires either an AGN or very hot stars. It is
therefore perhaps not surprising that most CIVemitters atz∼1.5
do not have colours consistent with SF galaxies at that redshift, but
lie in the region ofz∼2.2 Lyα emitters. Note that all CIVsources
with all the two colours required for Fig.3are spectroscopically
confirmed, so the unusual colours cannot be attributed to a wrong selection. It is therefore crucial to consider the contamination by
CIVemitters to samples of NB selected Lyαemitters: without
red-shifts, when using colours, many lower redshift CIVsources will be
confused with higher redshift Lyα emitters, as noted bySobral et
al.(2017). CIVhave unusual spectral shapes in other bands as well.
For example, the criteriaKonno et al.(2016) used for selecting Lyα
emitters atz∼2.2 ((U−NB)>0.5 and(B−NB)>0.2), would
select 7 spectroscopically confirmed CIVemitters as Lyαemitters.
Note this corresponds to half the sample of confirmed CIV
emit-ters. Even when using the criteria defined byKonno et al.(2016) to
select ‘secure’ Lyαemitters ((U−NB)>0.9 and(B−NB)>0.2),
we would still select 5 spectroscopically confirmed CIVinto a Lyα
sample. These CIVemitters are typically luminous, so they result
in contamination of the bright end of the Lyαdistribution (Sobral
et al. 2017;Matthee et al. 2017). Because this contamination is mostly at bright fluxes, it is less important in deep but small area
NB surveys (e.g.Trainor et al. 2015).
4.2 Observed and rest-frameU−Bcolours
Fig.4displays the distribution of observed(U−B)obscolours for
our emitters, while the mean and median colours are listed in
Ta-ble3. For individual sources, the numbers are listed in TablesB1,
B2andB3. Atz∼0.7−1.5,(U−B)obsapproximately traces the
rest-frame UV. Note that all but 2 CIII] emitters have bothUandB
measurements. Note however thatUis contaminated by the
emis-sion line, thus the colours should be interpreted with caution. The
(U−B)obscorresponds to approximately:
• CII]: short and long side of restframeNUV
• CIII]: restframeNUVandFUV
Table 3.Rest-frameEWrest, observed(U−B)obsand UV slopeβof the emitters which have photometric or spectroscopic redshifts. We also list the observed filters used for tracing the rest-frame UV. Note that the rest-frame wavelength traced for calculating theβslopes vary slightly depending on the emitter type. See Section4.3for more details. The uncertainties reported represent the standard deviation of the sample.
Line zspec MeanEWrest MedianEWrest Mean(U−B)obs Median(U−B)obs Meanβ Medianβ Filters for
( ˚A) ( ˚A) (mag) (mag) βslope
CII] 0.68 82±56 74±70 0.25±0.20 0.26±0.25 −2.0±0.4 −1.9±0.5 NUV,U CIII] 1.05 93±59 87±74 0.25±0.37 0.21±0.46 −0.8±1.1 −0.6±1.4 U,B CIV 1.53 51±46 34±58 0.15±0.37 0.21±0.46 −1.9±0.8 −1.6±1.0 U,V Lyα 2.23 85±57 77±71 0.18±0.25 0.23±0.31 −1.6±0.6 −1.7±0.7 g,R
[image:6.595.44.285.145.352.2]Hα 2.23 −1.0±0.6 −1.0±0.7 g,R
Figure 4.Distribution of observed(U−B)obscolours of the emitters. The distribution of the Lyαemitters atz∼2.23 (Sobral et al. 2017) is given for reference. The(U−B)obsaverage for the C emitters at 0.7.z.1.5 indicate blue colours, consistent with Lyαemitters atz∼2.23.
All three types of emitters studied in this paper have relatively
blue colours with mean(U−B)obscolours in the 0.15−0.25 range.
Our emitters are consistent in colour to Lyα emitters selected at
z∼2.23 in the CALYMHA survey, which stand at a mean of 0.18.
For the CIII] and CII] source with disky morphology as discussed
in the previous section, the blue UV colours indicate a relatively dust-free environment.
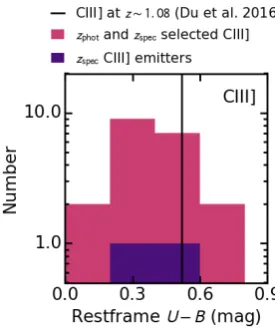
For comparison, we also present a rest-frame (U−B)rest
colour, derived from the observedi−zcolour (Fig.5). Our CIII]
emitters are on average slightly bluer ((U−B)rest=0.38) than
the spectroscopic sample of CIII] emitters atz∼1 fromDu et al.
(2016), which characterise their emitters as being blue and
low-mass with little dust extinction. Note however that the two distribu-tions are perfectly compatible within the full distribution of values.
4.3 UV slopeβ
The dust in a galaxy absorbs the UV radiation coming from an AGN or from massive, young stars. Despite it depending on many
other properties (see for exampleBouwens et al. 2009), the slope of
the rest-frame UV continuum (β) is usually used as a simple tracer
of the dust extinction in a galaxy. Here, we estimateβfor our CII],
CIII] and CIVemitters, defined in the following way:
β=− m1−m2
2.5 log10λ1
λ2
−2, (2)
where m1 and m2 are the magnitudes of the source in two
ob-served filters which trace the rest-frame UV, preferentially around
the 1500 ˚A reference wavelength.λ1andλ2are the central
wave-lengths of the two filters.
Given that our emitters are at 3 different redshifts, it is not
Figure 5.Distribution of rest-frame(U−B)rest colours (observedi−z colours) of the CIII] emitters. The rest-frame(U−B)obs fromDu et al. (2016) averages are only slightly larger, but consistent with our results. This shows that our CIII] emitters are a relatively blue population of sources, but that our blind selection may also be recovering a few sources which are even bluer than the average.
simple to have filters that trace exactly the same rest-frame wave-lengths. The best choices of filters to trace the rest-frame UV
in-cluded theU filter, which can be contaminated by the emission
lines. We chose filters to match the convention used in other stud-ies and ease comparisons:
• CII]: NUV, U
• CIII]: U, B
• CIV: U, V
Note that for CIII] emitters, theUfilter traces a slightly redder
rest-frame wavelength compared to other studies and CII] and CIV,
which may biasβ to slightly redder values.
We list the averages of theβ slope in Table3. Theβslopes of
our emitters indicate a steep UV continuum with potential low dust
attenuation, within the same ranges as Lyαemitters atz∼2.23, but
with CIII] being slightly redder.
We show the averageβ slope compared to the average
abso-lute UV magnitudeMUVin Fig.6. The relation between the UV
slope and absolute UV magnitude has been shown to not depend significantly on redshift for LBGs, thus making it a good probe for
studying galaxies at all cosmic epochs (Bouwens et al. 2009;Smit
et al. 2012).
Fig.6shows that the CII] and and CIVemitters are consistent
in UV properties with other Lyman break selected SF galaxies at
[image:6.595.352.490.253.418.2]se-Figure 6.Distribution of rest-frame UV slopeβas function of UV mag-nitude for our sample of emitters and Lyα(Sobral et al. 2017) and Hαat z∼2.23 (Sobral et al. 2013). Only sources with both rest-frame UV bands detected are plotted. For comparison, we plot the values forz∼2.5 and z∼4 Lyman break, UV selected galaxies fromBouwens et al.(2009). CII] and CIVemitters have colours consistent with the population of UV selected galaxies. CIII] emitters are redder, consistent with more general populations of SF galaxies such as those selected through Hα.
lected galaxies atz∼2.2. It is important to note that Lyαand LBG
selected samples are generally biased towards blue, less massive,
metal-poor SF galaxies (Oteo et al. 2015). Note that Lyα can also
probe extremely dusty galaxies unlike the LBG technique (Oteo et
al. 2015;Matthee et al. 2016). The averageβ slope is consistent with the results obtained from the observed and intrinsic colours,
indicating that CII] and CIV emitters are relatively blue objects
with little dust extinction. At first glance, this is quite surprising, because, as was discussed in previous sections, a large fraction of
CII] emitters and the bulk of CIVemitters have properties
consis-tent with AGN. However, young, dust-free, quasar-like AGN will
have steep UV continua, similar to those measured for CIVand CII]
emitters.
CIII] emitters have relatively flat slopes, indicating a redder
UV continuum. This means CIII] emitters haveβslopes consistent
with more general populations of SF galaxies such as those selected
from Hα(Oteo et al. 2015). The CIII] emission line may therefore
be a good, unbiased tracer of SF galaxies with a range of properties.
4.4 EWrestdistribution
We also investigate the distribution of rest-frameEWrestin the
sam-ple of emitters. We find that the average EWs are high. This could
be caused by Lyαinterlopers, which can have large observed EWs.
Therefore, as a further conservative step, we attempt to bring
any contamination from Lyαemitters (which may have high EWs)
to virtually zero. We do this by applying colour cuts targeting the
Lyman break inz&2 galaxies to further remove any potential Lyα
interlopers from the sample:
(NUV−U)>1.0 or (NUV−B)>1.5 (3)
The distributions of the resulting samples with very high
pu-rity are given in Fig.7. Averages are listed in Table3, while
individ-ual values are given in TablesB1,B2andB3. We find a significant
[image:7.595.306.543.95.202.2]population with large rest-frame EWs for all three emitter species,
Figure 7.Rest-frame EW distribution for highly secure CII], CIII], CIV, classified as such by spectroscopic or photometric redshifts. We removed any potential high redshift sources which were classified as C species based onzphot, but asz>2 sources by colour-colour selections fromSobral et al.
(2017) or by Lyman break colour cuts. Note the large average EW for all three emitter types. For comparison, we also show the EW distribution of the Lyαemitters atz∼2.23 selected inSobral et al.(2017).
potentially extending up to 200 ˚A. A word of warning is that the
errors on the rest-frame EW can be large, with an average of∼60
per cent of the EW value. Hence, some of the values can be 60 per cent lower or higher than estimated here. Furthermore, as we
will discuss in Section4.5, our morphological results show that we
may be tracing specific regions within galaxies with little to no UV continuum, which may bias the EW towards higher values.
Spectroscopic observations are necessary to pose tighter con-straints on the EW values, reduce the error bars and further
investi-gate the validity of NB observations for measuring the EW of CII],
CIII] and CIVemitters. EW could also be overestimated due to
vari-able sources, which we discuss in detail in SectionA. While
vari-ability could explain part of the population, the entire population of large EW sources cannot be explain this way.
Another possibility to explain the large EW are offsets be-tween the main line emission region and the galaxy stellar light. Such offsets could be caused by systematic astrometric errors, but can also be caused by a real physical separation in the peaks of the underlying continuum and the line emission. While investigating this avenue with the INT NB data alone is not possible because of
the large point spread function (psf,∼2 arcsec), we discuss this in
more detail using high resolutionHSTdata in Section4.5. As will
be shown in Section4.5, astrometric errors are likely not the cause
of the large EW.
The distribution of rest-frame EW for the CII] emitters
ex-tends up to 200 ˚A (as shown in Fig.7). The chances of all of these
high EW sources being interlopers or variable sources is small as explained above. We have also been extremely conservative in our
selection and one source with a largeEWrestof 84 ˚A as measured
from our NB data has a spectroscopic redshift confirming it to be a
CII] emitter atz∼0.68 (although this specific source could still be
variable).
The rest-frame EW distribution of CIII] emitters extends up
to large values, with an average of∼100 ˚A (Fig.7). These
val-ues place our CIII] sample in a different regime than other
sam-ples from the literature. Very recently,Du et al.(2016) published
a spectroscopically-selected CIII] sample atz∼1 with a median
EWrestof 1.3 ˚A. They also compared with results from the literature
at redshifts up to∼6 and found that, on average, the CIII] emitters
discovered till now have EW of at most∼25 ˚A and are hosted by
young, low mass, SF galaxies. The average EW of our CIII]
emit-ters is also higher than what was found byShapley et al.(2003)
in stacks of LBGs, where their strongest Lyα emitters have mean
[image:7.595.46.275.101.279.2]Figure 8.HSTcutouts ofz∼0.7 CII] emitters selected based onzspecorzphot. Images are on the same colour scale, from 0 to 20×σRMS, with a size of 400×400. At the redshift of CII] emitters, the images have a size of 28.3 kpc on each side. The large circle represents the 300aperture used to extract photometry for the CALYMHA sources. The small circle represents 3 times theHSTpoint-spread function (PSF∼100), encompassing 98 per cent of the flux. We also indicate whether the source has an X-ray or radio counterpart. Note that some sources simply do not have X-ray or radio counterparts, while others are not covered with such data. While some CII] emitters have disky morphologies, some have very bright nuclei, which in the case of source 275 correlates with an X-ray detection, indicating these galaxies are Seyfert-like. We center theHSTthumbnails on the peak position of the emission line and find that, in some cases, there are offsets of∼5 kpc from the peak UV rest-frame emission. This may explain the relatively large EW we measure.
however that all these sources are continuum selected, which will bias samples towards low EWs, while our samples are line emis-sion selected, thus finding higher EWs. As mentioned earlier, any offset between the line emitting region and the stellar light could also explain the large EW we are measuring. Therefore, for contin-uum selected sources, placing the spectroscopic slit or fibre on the main continuum emitting region does not guarantee the line emis-sion will be captured. Spectroscopy focusing on the line-emitting regions is however crucial to unveil the nature of these emitters and understand the source of the high EW emission.
The CIVemitters have average rest-frame EWs of 52 ˚A. It is
important to note that a significant fraction of these are also
spec-troscopically confirmed, including a source with a EW of∼100 ˚A
measured using the NB and BB data (see Fig.7). The values are
consistent within the ranges measured from a large sample of∼150
Type II quasars atz∼2−4.3 byAlexandroff et al.(2013). They
measure rest-frame EW ranging from 10 to 100 ˚A for their most
secure Type II sample, with an average of about 40 ˚A. Note that
the average CIVline fluxes inAlexandroff et al.(2013) are about
(1−1.2)×10−16 erg s−1, which is smaller than our average of
7.7×10⁻¹⁶erg s−1, but consistent within the spread of the values.
Without spectroscopic information, many of our CIVsources would
have been likely Lyα candidates at higher redshifts. While
tradi-tionally it has been assumed that large EW emitters are Lyα,
with-out clear, secure redshift information the emitter can be
misiden-tified. It thus becomes apparent that CIVemitters can represent an
important contaminating population, as was concluded inSobral et
al.(2017) and inStroe et al.(2017b).
4.5 HSTmorphologies
Ancillary high-resolution space based optical data is crucial in un-veiling the nature of our emitters, especially in understanding their
colour properties from Sections4.1,4.2and4.3and their high EWs
(Section4.4). For the sources with coverage inHST, we show their
morphologies in Figs.8,9and10. The optical properties of the
emitters are listed in TablesB1,B2andB3.
Twelve out of the 16 CII] sources haveHSTcoverage,
reveal-ing a mix of morphology types. Seven CII] emitters have a disky
or spiral morphology, while four have a very bright nucleus and a spiral structure, indicative of a Seyfert nature. These Seyfert-like sources are also the most luminous in the emission line and have
the lower EW (see Section4.4). The possible mixed nature of CII]
emitters, some being powered by SF and some by AGN is therefore not only supported by the optical and UV colours of the emitters
(Sections4.1,4.2,4.3), but also by the morphologies.
Out of our 24 CIII] sources, there are 19 withHSTcoverage,
presenting a wide variety of morphologies. Some CIII] emitters
Figure 9.Same as Fig.8, but for CIII] emitters. The images are 32.4 kpc in size at the redshiftz∼1.05 of the CIII] emitters. The large circle is the 300aperture used to extract photometry, while the small circle is 3×PSF ofHSTpoint-spread function, which captures 98 per cent of the flux for a point source. CIII] emitters have a range of optical morphologies, including disks, many interacting or merging sources and messy, complicated, disturbed galaxies. Source 212 has a Seyfert-like morphology with a bright optical core and a radio and X-ray counterpart. Note that in many cases the rest-frame continuum is offset from the CALYMHA emission line detection, which may explain the largeEWwe find. This is likely caused by physical offsets between the stellar continuum and the brightest emission line regions. A small fraction of sources with coverage have either X-ray or radio detections, indicative of an AGN.
a Seyfert nature, which are also among the brightest in the CIII]
emission line.
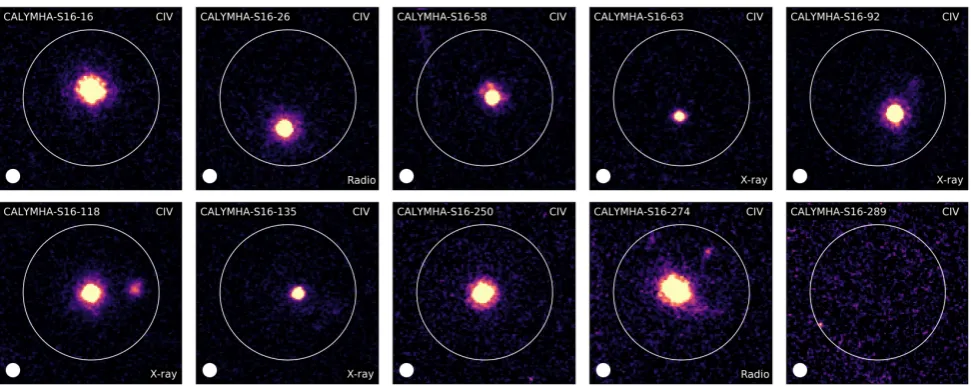
Ten out of 17 CIVsources have space telescope coverage and
they are all point sources even atHSTresolution. TheHSTdata
support a scenario where CIVemitters are predominantly quasars:
all four sources withChandracoverage have a direct X-ray
detec-tion, with an additional three sources with a radio detection. We
note that the line luminosities of these sources span theLCIV∼
1042.6−1042.9erg s−1range.
We find that many line emitters, especially CII] and CIII] are
offset from theHSTdetection. Note that the offsets are more
preva-lent for disky galaxies, e.g. for CIII] emitters, while no large
off-sets are detected in the CIVemitter sample. It is important to note
that sources where the galaxy disk is most offset from the emis-sion line detection in CALYMHA are also among the sources with
the largest EW (see discussion of the large EW in Section4.4).
A reason for largeEWrestcould be the offset between the main line
emission region and the location of the bulk stellar light. Therefore,
we have tentative evidence that some of the emission line regions
can be offset by 100from the brightest UV continuum component,
which would result in largeEW (see Figs.8and10). While the
offset can be caused by a physical displacement, a caveat to note is the large PSF of the NB and BB INT observations used to calculate the EW, which can be prone to larger astrometric uncertainties and thus contribute towards the offsets we are measuring. We
investi-gate the offset between CALYMHA sources and theHST
counter-parts and found that astrometric errors are in the 0.2−0.3 arcsec
range, which is the expected value for INT observations (Sobral et
al. 2017). Therefore, the large offsets found here are most likely of a physical origin, either by the presence of an AGN, and in the case of SF sources, by an offset between the stellar light and the line emitting region. Another option, at least for some of the sources which are not spectroscopically confirmed, would be that they are
in fact higher redshift, lensed Lyα emitters. This may explain the
Figure 10.Same as Fig.8, but for CIVemitters. The cutouts trace 33.9 kpc on each side, at the redshift of CIV(z∼1.53). The large circle represents the 300 CALYMHA aperture is marked with the large circle and the small circle is 3 times theHSTPSF. All the sources are consistent with being point-sources, with their flux contained within the PSF ofHST. Six out of ten sources withHSTcoverage have either radio or X-ray counterpart, further supporting a scenario where CIVsources are power almost exclusively by AGN. Note that all sources with X-ray coverage do have a counterpart. Unlike, CII] or CIII] emitters, the CIVline detections are well centred with respect to theHSTand thus more consistent with astrometric errors rather than physical offsets. An AGN powering source for CIVcan readily explain the large EW.
4.6 ChandraX-ray and VLA radio counterparts
While no emitters have direct FIR detections (and thus none can be
extremely star-forming at the 1000 Myr−1level), some sources
do have an X-ray or radio counterpart, which we discuss here and
summarise in Table4. Five CII] haveChandracoverage and 13 are
covered by radio data. Nine CIII] sources are covered withChandra
and 22 with radio coverage, while 4 CIVare covered with X-ray and
13 with radio.
In the case of CII], the results from the optical
morpholo-gies and colours are supported by the X-ray data: the disk galaxies withChandracoverage do not have an X-ray counterpart, while the
Seyferts have counterparts. None of the CII] sources is active in the
radio (out of 13 with coverage). TheHSTdata reveals that some
of the CII] emitters have a spiral-like morphology. In that canse
any radio emission will be powered by SF, which is low compared to AGN-powered radio emission. Additionally, only 5 per cent of Seyferts are radio-loud. Therefore, the lack of radio detection for
CII] emitters is not surprising given the depth of the radio
observa-tions.
As mentioned in Section4.5, the CIII] sources have a range
of morphologies. One of the two sources with a UV bright core,
indicative of a Seyfert nature, has coverage inChandraand VLA
and possesses an X-ray and radio detection. As expected for
nor-mal SF galaxies, none of the other CIII] sources have radio or
X-ray counterparts. A detection would imply very large SFRs of
∼1000 Myr−1.
The radio andChandradata for CIV, in agreement withHST,
support a scenario where CIVemitters are predominantly quasars:
all four sources withChandracoverage have a direct X-ray
detec-tion, with an additional three sources with a radio detection.
In conclusion, the X-ray and radio data suggest that CIII] is
mostly powered by SF. CIVand some CII] emitters are active in the
X-ray, indicating they are young, actively accreting in the
radia-tively driven, quasar mode. Only a few CIVand no CII] have radio
detections, which would be indicative of a more evolved AGN in the mechanical, radio-loud phase.
4.7 Average SFRs and BHARs
4.7.1 Chandra stacking
To evaluate the level of activity of the central supermassive black hole in our emitters, we can estimate the black hole accretion rate (BHAR) which can be derived from X-ray data. We follow the
method described inCalhau et al.(2017) to measure the average
BHAR for the CII], CIII] and CIVemitters by stacking sources with
Chandracoverage.
We make a 2000×2000 cutout around the position of each
source and take the mean to obtain an average image which is used to calculate the average flux of the emitters. We establish a stacking radius of 2 arcsec and convert the counts inside to flux by following
the indicated procedure inElvis et al.(2009), with a photon index
Γof 1.4 and Galactic absorption of 2.7×1020 cm−2. We convert
the fluxFXto an X-ray luminosityLXusing:
LX=4πD2LFX(1+z)Γ−2 (erg s−1), (4)
We obtain the bolometric luminosity by multiplying by 22.4 (Lehmer et al. 2013). The BHAR is obtained by:
BHAR=(1−ε)Lbol
εc2 (Myr
−1), (5)
whereε=0.1 is the accretion efficiency (followingLehmer et al.
2013) andcis the speed of light. Errors on bothLXand the BHAR
are calculated by taking the standard deviation of the distribution obtained from a bootstrapping analysis of the data.
4.7.2 FIR and radio stacking
FIR emission, we start by mean stacking our sources using the Her-schelbands at 100, 160, 250, 350 and 500µm (PACS and SPIRE instruments). Aperture corrections were applied for the PACS 100
and 160µm bands as specified in the PACS PEP release notes. In
the SPIRE 250, 350, 500µm, the fluxes were taken from the peak
value in each stack. Note that we do not have any detections and can only provide upper limits. We estimate the FIR luminosities by fitting modified black body templates (using the SWIRE template
Library,Polletta et al. 2007) to the upper limits and integrating the
best fit between 8 and 1000µm. We use the total FIR luminosity
LFIR to compute the SFRs, assuming aChabrier(2003) IMF by
using:
SFRFIR=2.5×10−44LFIR Myr−1. (6)
We find no detections in any of the stacks and thus can place upper limits on the SFRs. The results of the stacking do not change if
we use all sources with coverage or only the sources withChandra
coverage.
Radio at 1.4 GHz can be used as a dust-free SF indicator on
timescales longer than FIR or emission lines. The radio stacking procedure is the same as the X-rays. To convert the radio luminosi-tiesLradioto SFRs, we use the conversion determined byYun et al.
(2001), adapted to aChabrier(2003) IMF:
SFRradio=3.18×10⁻²²Lradio Myr−1. (7)
Note that in the case of radio, unlike FIR, a direct detection is caused by an AGN rather than SF. We find that if we remove all detections, our radio stacks all provide non-detections in the same range as the FIR ones.
4.7.3 Stacking results
The results of our X-ray, FIR and radio stacking analysis are listed
in Table5. The stacked X-ray image can be found in Fig.11, which
shows clear detections for CII] and CIVand a very faint/non
detec-tion for CIII]. We plot ourBHARresults and compare with similar
measurements obtained for Hαand FIR selected SF galaxies, Lyα
emitters and AGN (Delvecchio et al. 2015;Stanley et al. 2015;
Cal-hau et al. 2017, Calhau et al. in prep) in Fig.12. Note however the low number statistics, driven by the small area of the publicly avail-ableChandraimages.
The stacking analysis indicates that CII] emitters are bright in
the X-rays and are consistent with AGN activity (BHAR=0.10±
0.06Myr−1), as revealed by Fig.12. CII] emitters accrete matter
onto their BH at a much higher rate than SF galaxies. The CII]
emission, as suggested, for example, by Best et al.(2002) could
then be in part powered by shocks near the BH.
Once the only source with an X-ray detection is removed,
CIII] emitters have an upper limit X-ray luminosity consistent with
SF activity and a low BHAR (0.02±0.01Myr−1), similar to what
Figure 11.The X-ray stack for sources with coverage in COSMOS with Chandra. The CII] and CIVdetections are consistent with AGN activity with large X-ray luminosities of 1043.5and 1044.4erg s−1, respectively. The much fainter CIII], with an average X-ray luminosity of 1042.8 erg s−1, is likely dominated by SF galaxies with a very minor AGN contamination, consistent with our results. The images are on the same colour scale.
is measured from Hα and FIR selected SF galaxies (Delvecchio et
al. 2015;Calhau et al. 2017).
The average X-ray luminosity of the CIVsources is very high,
∼1044.4erg s−1, supporting an active nucleus which accretes
mat-ter at a rate of∼0.83Myr−1. This value is well above the rate
expected for main sequence SF galaxies, lying in the AGN region
of Fig.12. This is consistent with the optical properties of the CIV
emitters discussed in previous sections.
There are no detections in the FIR bands, so we are only able
to provide 3σ SFR upper limits of 15, 75, 141 Myr−1for CII],
CIII], CIV, respectively. Note that the different values are mostly
driven by the different redshifts of the three types of emitters. The FIR non-detections are mostly caused by the relatively low number
of sources in each stack compared to the detections fromCalhau et
al.(2017), who stacked about ten times more sources than included
in this analysis. In order to further test this, we stack the Hα
emit-ters atz∼0.84 in the FIR, using the same number of sources as
our CIII] emitters and find no detection. We therefore conclude that
CIII] emitters are fully consistent with being similar to Hαselected
samples at a similar redshift, including the fact that, as seen before, they are slightly redder than LBGs.
Similarly, we do not have a detection in the radio stacks af-ter removing direct detections (which are caused by AGN, not SF). These upper limits, as for the FIR, are not very stringent
(∼17,35,115Myr−1for CII], CIII] and CIVrespectively). The
range of typical SFR from Hα emission atz∼0.8−1.5 is in the
range 8−16Myr−1(Sobral et al. 2013), well below our FIR and
radio depths.
5 DISCUSSION
We investigate the nature of CII], CIII] and CIVline emitters by
[image:11.595.290.542.131.299.2]Figure 12.The black hole accretion rate (BHAR) for the stacked CII], CIII] and CIVsources, obtained by converting their average X-ray luminosities into accretion rates. All CIVsources are directly detected in the X-ray. Upper limits for CII] and CIII] stacks are given with direct detections removed. CII] emitters have a high averageBHAR, similar to AGN. CIII] emitters haveBHARsimilar to Hαselected, main sequence SF galaxies. CIVemitters have extremely high accretion rates, consistent with bright quasars. We also plot theBHARfor Hαselected, SF galaxies (Calhau et al. 2017). Overplotted in dark grey are main-sequence, FIR selected SF galaxies fromDelvecchio et al.(2015). The different values are stacks for galaxies of different masses and SFRs. The light grey points represent AGN fromStanley et al.(2015) stacked in different luminosity bins. We also plot the result for Lyαemitters atz∼2.23 from Calhau et al. (in prep), with and without the direct X-ray detections included in the stacks.
Table 5.Average X-ray luminosity and BHAR, as resulting from a stacking analysis of the CII], CIII] and CIVemitters (withzspecorzphot), including direct detections. While CII] and CIVemitters are consistent with AGN activity, CIII] values place in the SF galaxy regime. Note that removing the direct X-ray detections results in non-detections in the stacks because of the very low numbers of sources left. We also present SFR upper limits obtained from FIR and radio data. Note that individual detections are removed from the radio stack as a direct radio detection will be caused by an AGN rather than SF (which is the purpose of our radio stacks).
Line logLX BHAR No sources SFRFIR3σupper limit SFRradio3σupper limit (ergs−1) (M
yr−1) (Myr−1) (Myr−1)
CII] 43.46±0.56 0.10±0.06 5 <15 <17
CIII] 42.80±0.37 0.02±0.01 9 <75 <35
CIV 44.37±0.08 0.83±0.12 4 <141 <115
5.1 CII] emittersz∼0.68
CII] emitters atz∼0.68 have optical colours spanning across the
colour space of SF galaxies at their redshift into a regime more typ-ical of SF sources at higher cosmic distances. Such unusual opttyp-ical
colours may indicate that while part of the CII] emitter population
is powered by SF, at least some sources host an AGN, in agreement
with luminosity function and cosmic ratio results fromStroe et al.
(2017b). This is also supported by theHSTmorphology of CII] sources: while some sources have spiral-like morphologies, part of the population, particularly the sources with atypical colours, have a bright nucleus accompanied by a disk. While the bright nucleus could be indicative of a nuclear starburst surrounded by a stellar disk, this scenario is not supported by the X-ray data which reveals
that these CII] emitters have BHAR rates consistent with an AGN
at their core. CII] emitters have relatively steepβ slopes, which
in-dicate a relatively blue UV continuum. This is also supported by the
lack of a detection in the FIR stacks of these sources. CII] emitters
also have high rest-frame EWs, which could be caused by either the offset we observe between the main stellar disk and the line emitting region, or by AGN activity.
Traditionally, it was thought that CII] emission is mostly
trig-gered in shocks around AGN (De Breuck et al. 2000;Best et al.
2000,2002), however this resulted from studies of this line being
done almost exclusively in bright, active galaxies. Overall, our
re-sults indicate that CII] emitters may actually powered in part by
blue, SF galaxies at lower luminosities and in part by Seyfert-like sources with young, actively-accreting AGN at brighter line lumi-nosities.
5.2 CIII] emitters atz∼1.05
Most CIII] emitters atz∼1.05 have optical colours consistent with
SF galaxies at their redshift. Furthermore, their low average BHAR
is also consistent with SF galaxies. TheβUV slopes of CIII]
emit-ters are consistent with Hαselected galaxies, indicating CIII]
emis-sion might be suitable avenue for selecting a wide range of SF
galaxies. CIII] sources are also mostly X-ray and radio quiet, as
expected for SF galaxies. Most emitters have disky, clumpy or dis-turbed optical morphologies, indicative of either single or interact-ing SF galaxies. The offset optical disk or the clumpy/disturbed
morphologies might explain the large EW we find for some CIII]
emitters. The few direct X-ray and radio detections (<10 per cent)
correlate with a bright nucleus plus a disk optical morphology,
which indicates that the brightest CIII] emitters host an AGN at
their core.
Traditionally CIII] emission was thought to originate from
AGN. More recent results focusing on SF galaxies find that∼20
per cent of local galaxies have the CIII] feature and the strongest
CIII] emission is fostered at low metallicities (Rigby et al. 2015).
Part of their sample are Wolf-Rayet galaxies, indicating recent (few
Myrs), short-lived (<1 Myr) strong starbursts. At higher redshifts
(1.5−3),Stark et al.(2014) find that almost all of their CIII]
emit-ters also possess strong Lyα.Stanway et al.(2016), in agreement
withJaskot & Ravindranath(2016), showed that the presence of binary stars can increase the ionising flux by up to 60 per cent in
low metallicity (<0.3Z) environments, which could also lead to
a boost in CIII] production.
[image:12.595.119.467.384.447.2]The average line ratios imply that CIII] is∼20 times fainter than
Hαand∼4 times fainter than observed Lyα(Stroe et al. 2017b).
5.3 CIVemittersz∼1.53
The direct detections in the X-ray, the high accretion rates charac-teristic for bright AGN, the universal optical quasar morphologies, the unusual optical colours and blue UV slopes and large rest-frame
EW, all reveal that CIVis produced in intense radiation fields
char-acteristic to young, virtually dust-free actively accreting quasars.
The number distribution of CIVemitters as function of line
lumi-nosity also indicates they are primarily a quasar population, being
well described by a power-law (Stroe et al. 2017b).
In a sample of lensed, low mass galaxies at z∼1.5−3,
Stark et al.(2015a) find ubiquitous joint detections of CIV and
CIII], which require young stellar populations, increased electron
temperatures and an enhanced ionising output from metal poor gas
and stars. Their work therefore indicates that part of the CIV
emis-sion is driven by strong AGN activity, while some is powered by young stars.
Our results however, seem to support a scenario where the
bulk of the CIVis produced in galaxies hosting powerful AGN at
least atz∼1.5. One important aspect to note is that the rest-frame
UV magnitudes of the sources fromStark et al.(2014) are similar
to ours, so a comparison is appropriate, although the redshift is dif-ferent.
6 CONCLUSIONS
We characterise the properties CII], CIII] and CIVemitters atz∼
0.68,1.05,1.53. These sources were selected from the first blind,
statistical study of Carbon emitters, uniformly selected in the COS-MOS and UDS field as part of the CALYMHA survey. In this pa-per, we focus on the UV, optical, X-ray, FIR and radio properties of these emitters. Our main results are:
• CII] emitters atz∼0.68 have disky structure or bright
nu-cleus with a disk morphology (Fig.8) and blue UV colours (Figs.
4,6). Some of the brightest line emitters are strong X-ray sources
(Fig.11), with black hole accretion rates (Fig.12) characteristic of
AGN. Our results therefore indicate that CII] traces a mixed
popu-lation of SF galaxies and AGN, especially at the brightest line lu-minosities. For the brighter emitters, our results are in accordance
with the theoretical expectation that CII] emission is triggered by
shocks around AGN.
• CIII] emitters at z∼1.05 in our study have typical optical
colours for SF galaxies (Fig.3) and morphologies indicative of
ei-ther isolated or interacting galaxies (Fig.9). Their relatively blue
rest-frame UV and optical colours (Figs.5,6) and low black hole
accretion rates (Fig.12) are consistent with general populations of
SF galaxies.
• The point-likeHSTmorphologies (Fig.10), the strong X-ray
some of the sources.
While historically thought to originate in AGN, our study
re-vealed some interesting properties of CII], CIII] and CIVemitters
atz∼0.7−1.5. While CIVemitters are almost universally quasars,
CIII] emission is consistent with being produced in a wide variety
of SF galaxies and CII] emission may trace either an AGN or SF.
Further spectroscopy is crucial however to unveil their powering source and the physics of the large EW we measure in a fraction
of the population. In the companion paper,Stroe et al.(2017b),
we further explore the samples and derive luminosity functions and cosmic average line ratios.
ACKNOWLEDGEMENTS
DS acknowledges financial support from the Netherlands Organisa-tion for Scientific research (NWO), through a Veni fellowship. CA-LYMHA data is based on observations made with the Isaac New-ton Telescope (proposals 13AN002, I14AN002, 088-INT7/14A, I14BN006, 118-INT13/14B, I15AN008) operated on the island of La Palma by the Isaac Newton Group in the Spanish Observato-rio del Roque de los Muchachos of the Instituto de Astrof´ısica de Canarias. Also based on data products from observations made with ESO Telescopes at the La Silla Paranal Observatory under ESO programme IDs 098.A-0819 and 179.A-2005. We are grateful to E. L. Wright and J. Schombert for their cosmology calculator.
We would like to thank the authors of NumPy (van der Walt et
al. 2011), SciPy (Jones et al. 2001), Matplotlib (Hunter 2007)
and AstroPy (Astropy Collaboration et al. 2013) for making these
packages publicly available. This research has made use of the NASA/IPAC Extragalactic Database (NED) which is operated by the Jet Propulsion Laboratory, California Institute of Technology, under contract with the National Aeronautics and Space Adminis-tration. This research has made use of NASA’s Astrophysics Data System. This research has made use of the VizieR catalogue ac-cess tool, CDS, Strasbourg, France. The original description of the
VizieR service was published inOchsenbein et al.(2000). This
re-search has made use of “Aladin sky atlas” developed at CDS,
Stras-bourg Observatory, France (Bonnarel et al. 2000;Boch & Fernique
2014). The CALYMHA catalogue used for this study is publicly
available fromSobral et al.(2017).
REFERENCES
Alexandroff, R., Strauss, M. A., Greene, J. E., et al. 2013, MNRAS, 435, 3306
Allen, M. G., Dopita, M. A., & Tsvetanov, Z. I. 1998, ApJ, 493, 571 Astropy Collaboration, Robitaille, T. P., Tollerud, E. J., et al. 2013, A&A,
558, A33
Baldwin, J. A. 1977, MNRAS, 178, 67P
Bayliss, M. B., Rigby, J. R., Sharon, K., et al. 2014, ApJ, 790, 144 Bertin, E. 2006, Astronomical Data Analysis Software and Systems XV,
Best, P. N., R¨ottgering, H. J. A., & Longair, M. S. 2000, MNRAS, 311, 23 Best, P. N., Inskip, K. J., R¨ottgering, H. J. A., & Longair, M. S. 2002,
Re-vista Mexicana de Astronomia y Astrofisica Conference Series, 13, 155 Boch, T., & Fernique, P. 2014, Astronomical Data Analysis Software and
Systems XXIII, 485, 277
Bonnarel, F., Fernique, P., Bienaym´e, O., et al. 2000, A&AS, 143, 33 Bouwens, R. J., Illingworth, G. D., Franx, M., et al. 2009, ApJ, 705, 936 van Breukelen C., Cotter G., Rawlings S., et al. 2007, MNRAS, 382, 971 Calhau, J., Sobral, D., Stroe, A., et al. 2017, MNRAS, 464, 303 Capak, P., Aussel, H., Ajiki, M., et al. 2007, ApJS, 172, 99
Cirasuolo, M., McLure, R. J., Dunlop, J. S., et al. 2010, MNRAS, 401, 1166 Civano, F., Elvis, M., Brusa, M., et al. 2012, ApJS, 201, 30
Chabrier, G. 2003, PASP, 115, 763
Cowie, L. L., Barger, A. J., & Hu, E. M. 2010, ApJ, 711, 928 Dahle, H. 2006, ApJ, 653, 954
De Breuck, C., R¨ottgering, H., Miley, G., van Breugel, W., & Best, P. 2000, A&A, 362, 519
Delvecchio, I., Lutz, D., Berta, S., et al. 2015, MNRAS, 449, 373 Dijkstra, M. 2014, PASA, 31, e040
Ding, J., Cai, Z., Fan, X., et al. 2016, arXiv:1612.00902
Du, X., Shapley, A. E., Martin, C. L., & Coil, A. L. 2016, arXiv:1612.06866 Elvis, M., Civano, F., Vignali, C., et al. 2009, ApJS, 184, 158
Erb, D. K., Pettini, M., Shapley, A. E., et al. 2010, ApJ, 719, 1168 Favre, P., Courvoisier, T. J.-L., & Paltani, S. 2005, A&A, 443, 451 Feltre, A., Charlot, S., & Gutkin, J. 2016, MNRAS, 456, 3354
Geach J. E., Simpson C., Rawlings S., Read A. M., Watson M., 2008, VizieR Online Data Catalog, 838, 11369
Gutkin, J., Charlot, S., & Bruzual, G. 2016, MNRAS, 462, 1757 Hayes, M. 2015, PASA, 32, e027
Hunter, J. D. 2007, Computing In Science & Engineering, 9, 3, 90–95 Ilbert, O., Capak, P., Salvato, M., et al. 2009, ApJ, 690, 1236 Jaskot, A. E., & Ravindranath, S. 2016, ApJ, 833, 136 Jones, E., Oliphan, T., Peterson, P. et al. 2001 Kennicutt, R. C., Jr. 1998, ARA&A, 36, 189
Koekemoer, A. M., Aussel, H., Calzetti, D., et al. 2007, ApJS, 172, 196 Koekemoer, A. M., Faber, S. M., Ferguson, H. C., et al. 2011, ApJS, 197,
36
Konno, A., Ouchi, M., Nakajima, K., et al. 2016, ApJ, 823, 20 Laigle, C., McCracken, H. J., Ilbert, O., et al. 2016, ApJS, 224, 24 Lawrence, A., Warren, S. J., Almaini, O., et al. 2007, MNRAS, 379, 1599 Lehmer, B. D., Lucy, A. B., Alexander, D. M., et al. 2013, ApJ, 765, 87 Lilly S. J., Le Brun V., Maier C., et al. 2009, ApJS, 184, 218
Lowenthal, J. D., Koo, D. C., Guzm´an, R., et al. 1997, ApJ, 481, 673 Mainali, R., Kollmeier, J. A., Stark, D. P., et al. 2016, arXiv:1611.071 Massey, R., Stoughton, C., Leauthaud, A., et al. 2010, MNRAS, 401, 371 Matthee, J., Sobral, D., Santos, S., et al. 2015, MNRAS, 451, 400 Matthee, J., Sobral, D., Oteo, I., et al. 2016, MNRAS, 458, 449 Matthee, J., Sobral, D., Best, P., et al. 2017, arXiv:1702.04721 Micheva, G., Iwata, I., & Inoue, A. K. 2017, MNRAS, 465, 302 Nilsson, K. K., Tapken, C., Møller, P., et al. 2009, A&A, 498, 13 Oliver, S. J., Bock, J., Altieri, B., et al. 2012, MNRAS, 424, 1614 Ochsenbein, F., Bauer, P., & Marcout, J. 2000, A&A, 143, 23 Ono Y., Ouchi M., Shimasaku K., et al. 2010, MNRAS, 402, 1580 Osterbrock, D. E., & Ferland, G. J. 2006, Astrophysics of gaseous nebulae
and active galactic nuclei, 2nd. ed. by D.E. Osterbrock and G.J. Fer-land. Sausalito, CA: University Science Books, 2006,
Oteo, I., Sobral, D., Ivison, R. J., et al. 2015, MNRAS, 452, 2018 Ouchi, M., Shimasaku, K., Akiyama, M., et al. 2008, ApJS, 176, 301-330 Polletta, M., Tajer, M., Maraschi, L., et al. 2007, ApJ, 663, 81
Rigby, J. R., Bayliss, M. B., Gladders, M. D., et al. 2015, ApJL, 814, L6 Sarajedini, V. L., Koo, D. C., Klesman, A. J., et al. 2011, ApJ, 731, 97 Schechter, P. 1976, ApJ, 203, 297
Schmidt, K. B., Huang, K.-H., Treu, T., et al. 2017, arXiv:1702.04731 Schinnerer, E., Carilli, C. L., Scoville, N. Z., et al. 2004, AJ, 128, 1974 Schinnerer, E., Sargent, M. T., Bondi, M., et al. 2010, ApJS, 188, 384 Shapley, A. E., Steidel, C. C., Pettini, M., & Adelberger, K. L. 2003, ApJ,
588, 65
Simpson C., Mart´ınez-Sansigre A., Rawlings S., et al., 2006, MNRAS, 372, 741
Smail I., Sharp R., Swinbank A. M., et al. 2008, MNRAS, 389, 407 Smit, R., Bouwens, R. J., Franx, M., et al. 2012, ApJ, 756, 14 Sobral, D., Smail, I., Best, P. N., et al. 2013, MNRAS, 428, 1128 Sobral, D., Matthee, J., Best, P., et al. 2017, MNRAS, 466, 1242
Stanley, F., Harrison, C. M., Alexander, D. M., et al. 2015, MNRAS, 453, 591
Stanway, E. R., Eldridge, J. J., & Becker, G. D. 2016, MNRAS, 456, 485 Stark, D. P., Richard, J., Siana, B., et al. 2014, MNRAS, 445, 3200 Stark, D. P., Richard, J., Charlot, S., et al. 2015a, MNRAS, 450, 1846 Stark, D. P., Walth, G., Charlot, S., et al. 2015b, MNRAS, 454, 1393 Steidel, C. C., Giavalisco, M., Pettini, M., Dickinson, M., & Adelberger,
K. L. 1996, ApJL, 462, L17
Stroe, A., Sobral, D., Matthee, J., Calhau, J., Oteo, I. 2017b, MNRAS, submitted
Trainor, R. F., Steidel, C. C., Strom, A. L., & Rudie, G. C. 2015, ApJ, 809, 89
Ulrich, M.-H., Maraschi, L., & Urry, C. M. 1997, ARAA, 35, 445 de Vries, W. H., Becker, R. H., & White, R. L. 2003, AJ, 126, 1217 van der Walt, S., Colbert, S. C., Varoquaux, G. 2011, Computing in Science
& Engineering, 13, 2
Veilleux, S. 2002, IAU Colloq. 184: AGN Surveys, 284, 111 Wright, E. L. 2006, PASP, 118, 1711
Yamada T., Kodama T., Akiyama M., et al. 2005, ApJ, 634, 861 Yun, M. S., Reddy, N. A., & Condon, J. J. 2001, ApJ, 554, 803 Zitrin, A., Ellis, R. S., Belli, S., & Stark, D. P. 2015a, ApJL, 805, L7
APPENDIX A: EFFECT OF VARIABILITY ON THE MEASURED EW
Since the NB and BB observations were taken in different years, it is possible that any variable source (such as an AGN) is falsely selected as a line-emitter or has an over- or under- estimated EW. This is because, on such timescales, the continuum UV magnitudes
of AGN may change by∼1 magnitude (e.g.Ulrich et al. 1997;de
Vries et al. 2003;Favre et al. 2005;Sarajedini et al. 2011;Micheva et al. 2017). Thus, there is the possibility that some of the large EW sources are not line-emitters, but variable sources caught in a high state in the NB, but in a low state in the BB, thus mimicking a colour excess. Another possibility is that some of the EW are overestimated because of variability.
We empirically estimate the number of variable sources that may contaminate our sample as follows. If such variable sources exist, we expect not only to find them in the sample of line-emitters, but also in samples of absorbers (with negative excess). There-fore, we select galaxies with statistically significant negative excess
(fromSobral et al. 2017). Among these, we focus on X-ray AGN
by matching negative excess sources with the catalogue of X-ray
detected sources fromCivano et al.(2012), resulting in 13 matches
(all with available spectroscopic redshifts). We remove four sources
for which the absorption feature corresponds to Lyαforest between
912−1216 ˚A, as well as two sources for which the absorption
fea-ture can be explained by CIVabsorption. The remaining 7 AGN
are at redshifts 0.9<z<2.0, and no obvious absorption feature is
present at the wavelength traced by the NB. Thus, we assume that these 7 AGN are in fact variable sources that mimic an absorption feature. These AGN have randomly distributed excesses between -0.4 and -1.1. If we would assume that such variable sources with such excess exist, we would expect 7 line-emitters to be variable
sources withEWobs≈30−110 ˚A. Therefore, while a few of the
In TablesB1,B2andB3we list the individual properties of CII],
CIII] and CIVemitters, respectively. We give the coordinates of the
sources, their opticalHSTmorphology, possible X-ray and radio
counterparts, as well as line luminosity, rest-frame EW (EWrest)

![Figure 2. Histogram of all photometric redshifts, focusing on CII], CIII]and CIV. Note the narrow ranges chosen for selection of sources based onphotometric redshifts, ensuring that low redshift (z < 0.4) emitters such as[OII], [NeV], MgI and MgII are rejected.](https://thumb-us.123doks.com/thumbv2/123dok_us/9382739.441365/3.595.50.284.106.350/histogram-photometric-redshifts-selection-onphotometric-redshifts-ensuring-redshift.webp)
![Table 2. Criteria for selecting a source as a CII], CIII] or CIV emitter. The zspec ranges used correspond to the full transmission range covered by the NB filter.Note that we are using conservative zphot cuts to minimise contamination](https://thumb-us.123doks.com/thumbv2/123dok_us/9382739.441365/4.595.138.449.144.201/criteria-selecting-emitter-correspond-transmission-conservative-minimise-contamination.webp)

![Figure 7. Rest-frame EW distribution for highly secure CII], CIII], CIV,classified as such by spectroscopic or photometric redshifts](https://thumb-us.123doks.com/thumbv2/123dok_us/9382739.441365/7.595.46.275.101.279/figure-distribution-highly-secure-classied-spectroscopic-photometric-redshifts.webp)

![Figure 9. Same as Fig. 8, but for CIII] emitters. The images are 32.4 kpc in size at the redshift z ∼ 1.05 of the CIII] emitters](https://thumb-us.123doks.com/thumbv2/123dok_us/9382739.441365/9.595.52.540.100.489/figure-fig-ciii-emitters-images-redshift-ciii-emitters.webp)
![Table 4. Summary of the optical, X-ray and radio properties of CB2II], CIII] and CIV emitters](https://thumb-us.123doks.com/thumbv2/123dok_us/9382739.441365/11.595.290.542.131.299/table-summary-optical-radio-properties-ciii-civ-emitters.webp)
