warwick.ac.uk/lib-publications
Manuscript version: Author’s Accepted Manuscript
The version presented in WRAP is the author’s accepted manuscript and may differ from the
published version or Version of Record.
Persistent WRAP URL:
http://wrap.warwick.ac.uk/107754
How to cite:
Please refer to published version for the most recent bibliographic citation information.
If a published version is known of, the repository item page linked to above, will contain
details on accessing it.
Copyright and reuse:
The Warwick Research Archive Portal (WRAP) makes this work by researchers of the
University of Warwick available open access under the following conditions.
Copyright © and all moral rights to the version of the paper presented here belong to the
individual author(s) and/or other copyright owners. To the extent reasonable and
practicable the material made available in WRAP has been checked for eligibility before
being made available.
Copies of full items can be used for personal research or study, educational, or not-for-profit
purposes without prior permission or charge. Provided that the authors, title and full
bibliographic details are credited, a hyperlink and/or URL is given for the original metadata
page and the content is not changed in any way.
Publisher’s statement:
Please refer to the repository item page, publisher’s statement section, for further
information.
Infrared molecular hydrogen lines in GRB host galaxies
K. Wiersema
1,2
?
, A. Togi
3
,4
, D. Watson
5
, L. Christensen
6
, J. P. U. Fynbo
5
, B.
P. Gompertz
2
, A. B. Higgins
1
, A. J. Levan
2
, S. R. Oates
2
, S. Schulze
7
, J. D. T.
Smith
8
, E. R. Stanway
2
, R. L. C. Starling
1
, D. Steeghs
2
, N. R. Tanvir
1
1Department of Physics and Astronomy, University of Leicester, University Road, Leicester LE1 7RH, UK 2Department of Physics, University of Warwick, Coventry CV4 7AL, UK
3Department of Physics and Astronomy, The University of Texas at San Antonio, San Antonio, 1-UTSA Circle, TX 78249, USA 4Department of Physics and Earth Sciences, St. Mary’s University, One Camino Santa Maria, San Antonio, Texas 78228, USA 5The Cosmic Dawn Center, Niels Bohr Institute, University of Copenhagen, Juliane Maries Vej 30, 2100 Copenhagen Ø, Denmark 6Dark Cosmology Centre, Niels Bohr Institute, University of Copenhagen, Juliane Maries Vej 30, 2100 Copenhagen Ø, Denmark 7Department of Particle Physics and Astrophysics, Weizmann Institute of Science, Rehovot 7610001, Israel
8Ritter Astrophysical Research Center, University of Toledo, 2825 West Bancroft Street, M. S. 113, Toledo, OH 43606, USA
Accepted XXX. Received YYY; in original form ZZZ
ABSTRACT
Molecular species, most frequently H2, are present in a small, but growing, number
of gamma-ray burst (GRB) afterglow spectra at redshifts z∼2−3, detected through their rest-frame UV absorption lines. In rare cases, lines of vibrationally excited states of H2 can be detected in the same spectra. The connection between afterglow
line-of-sight absorption properties of molecular (and atomic) gas, and the observed behaviour in emission of similar sources at low redshift, is an important test of the suitability of GRB afterglows as general probes of conditions in star formation regions at high red-shift. Recently, emission lines of carbon monoxide have been detected in a small sample of GRB host galaxies, at sub-mm wavelengths, but no searches for H2in emission have
been reported yet. In this paper we perform an exploratory search for rest-frame K
band rotation-vibrational transitions of H2 in emission, observable only in the lowest
redshift GRB hosts (z .0.22). Searching the data of four host galaxies, we detect a single significant rotation-vibrational H2 line candidate, in the host of GRB 031203.
Re-analysis of Spitzermid-infrared spectra of the same GRB host gives a single low significance rotational line candidate. The (limits on) line flux ratios are consistent with those of blue compact dwarf galaxies in the literature. New instrumentation, in particular on the JWSTand the ELT, can facilitate a major increase in our under-standing of the H2properties of nearby GRB hosts, and the relation to H2absorption
in GRBs at higher redshift.
Key words: gamma-rays: bursts, ISM:molecules
1 INTRODUCTION
Gamma-ray burst (GRB) afterglow spectroscopy has shown great promise as a probe of gas and dust properties within, and near, star forming regions in distant galaxies (see e.g.
Schady 2015 for a review). The bright afterglows serve as backlights with a simple (sometimes reddened) synchrotron spectrum, against which atomic and molecular absorption lines are easily distinguished. In addition, the ultraviolet ra-diation of the rapidly fading afterglow excites meta-stable and fine structure atomic states. The variability of
absorp-? E-mail: K.Wiersema@warwick.ac.uk
2
K. Wiersema et al.
as backlights, is that the host galaxies can be studied in emission once the afterglows have faded, through spectral energy distributions (to obtain stellar population parame-ters, e.g. Perley et al. 2016) and emission lines (to obtain element abundances and star formation rates, e.g. Kr¨uhler et al. 2015). These studies in emission complement the line of sight studies of afterglows, connecting the afterglow sight lines through their hosts with host galaxy integrated emis-sion properties. Sample sizes of hosts and afterglow spectra are growing, and statistical studies of metal abundances, stellar populations and dust properties are now possible, placing GRB host galaxies in the context of wider galaxy surveys (e.g.Vergani et al. 2007). An important component of the picture, though, the molecular content, is still poorly understood. Of particular interest is the H2molecule, which
plays a key role in the processes of star formation.
An additional advantage of host studies is that it is not limited to the subset of GRBs for which the optical after-glow is detected (provided the host can be reliably identified, see e.g.Perley et al. 2017). There is evidence that most of the GRB sightlines that pass by significant column densi-ties of molecules also will contain large dust column den-sities and hence that such sightlines are underrepresented in the subset of GRBs with well-detected optical afterglows (Prochaska et al. 2009; Kr¨uhler et al. 2013). The peculiar case of GRB140506, for which CH+ molecules were detected in absorption along with very steep UV extinction further supports this point (Fynbo et al. 2014;Heintz et al. 2017).
The homonuclear H2 molecule does not have a dipole
moment, so electric dipole transitions between levels with different vibrational quantum number (ν) or rotational quantum number (J) in the ground state are forbidden. Quadrupole transitions, however, are allowed, and the pure rotational lines (withν=0−0) are located at (mid-)infrared wavelengths, which makes them challenging to study, partic-ularly for faint sources like GRB hosts. Of more interest to us are the rotation-vibration (hereafter ro-vibration) tran-sitions in the ground state. In the following we adopt the standard notation, where the difference in J is given by a letter (O, Q, S for∆J= +2,0,−2, respectively), followed by the final state J, and preceded by the vibrational transition (so 1–0 S(1) isν=1−0,J=3−1). The main ro-vibrational lines are located at near-infrared wavelengths. For example, the 1–0 S(0), 1–0 S(1) and 1–0 S(3) transitions are located at 2.22, 2.12 and 1.96 µm, respectively, in the restframe. At low redshifts, these transitions can therefore be detected by ground-based observatories.
The first allowed transitions out of the H2ground state to an excited state are the Lyman and Werner bands, which require ultraviolet (UV) photons. These transitions have in-deed been observed in a handful of GRB afterglow spectra (Prochaska et al. 2009; Kr¨uhler et al. 2013; D’Elia et al. 2014;Friis et al. 2015, and possibly in Fynbo et al. 2006), where the redshifts of the GRBs shift these transitions from the UV to the optical domain. Identification and analysis is difficult: these transitions are located among the atomic hydrogen lines of the dense Lyman forest, and as such a fairly high signal-to-noise and spectral resolution is required to separate them. In very rare cases, highly diagnostic ab-sorption lines of vibrationally excited H2are found (Scheffer et al. 2009;Kr¨uhler et al. 2013), that are located redwards of the Lyαline. The detection of Lyman-Werner lines,
com-bined with fits to the atomic hydrogen Lyα line (in GRB sight lines often found as a strong, highly damped line, a damped Lyman absorber [DLA],Jakobsson et al. 2006) has allowed estimates of the molecular gas fraction (integrated over the line of sight), and helps to place the relatively small GRB H2absorption sample in the context of the much larger
sample of quasar DLAs (e.g.,Noterdaeme et al. 2008; No-terdaeme, Petitjean & Srianand 2015).
The sightline selection function of long GRBs is ar-guably quite different from those of QSO DLAs (e.g.
Prochaska et al. 2008;Fynbo et al. 2008;Fynbo et al. 2009), which makes the long GRB afterglow H2 sample especially valuable as a probe of high-redshift star forming regions. Of particular interest is that long GRBs trace cosmic star formation (e.g. Greiner et al. 2015), and therefore the H2
absorption seen in afterglows may probe the conditions in star forming regions within (dwarf) star-forming galaxies at the peak of cosmic star formation (z∼2−4).
However, whilst afterglow sightlines likely probe regions near long GRBs in high mass star forming regions, which should be rich in H2 (e.g. Tumlinson et al. 2007), the low detection rate, the excitation state of the detected H2, and
occasionally the association of the H2 absorber with excited atomic metal fine structure lines, have shown that in sev-eral cases the H2 absorbers are likely located far from the
star forming region in which the GRB progenitor resided (e.g.D’Elia et al. 2014). The low detection rate of H2 in
af-terglow spectra is puzzling. Several explanations have been put forward, that likely all play a role: dissociation of the H2
molecules by a high UV radiation field from the intense star formation in the host galaxy (e.g. Hatsukade et al. 2014); ob-servational biases against sightlines with high dust columns and against high-metallicity environments (e.g. Ledoux et al. 2009; Covino et al. 2013); and formation of stars from atomic gas before H2has a chance to form (e.g. Michalowski et al. 2016).
An alternative approach to detecting molecular species in GRB host galaxies is through emission line spectra. This has the added advantage of avoiding problems in interpret-ing line of sight measurements (e.g. the effects of ionisation and excitation by the GRB emission) and can help to place the line of sight absorption in an integrated, or in low-z cases spatially resolved (e.g.Hatsukade et al. 2014), galaxy context (Micha lowski et al. 2015). To date, a handful of host galaxies have been detected in molecular line emission, in all cases this is through emission lines of carbon monoxide (CO) (Hatsukade et al. 2014;Stanway et al. 2015b;Micha lowski et al. 2016;Arabsalmani et al. 2018b;Micha lowski et al. 2018). The use of CO as a tracer molecule for H2 is a well estab-lished technique, though evidence that the CO to H2
conver-sion factor in GRB host sightlines is comparable to Galactic translucent clouds, is limited to a single case (Prochaska et al. 2009): the only afterglow spectrum so far with a detection of CO absorption lines. The metallicity dependence of the CO to H2conversion factor, and other environmental effects (e.g. Bolatto, Wolfire & Leroy 2013), make the CO to H2
conversion factor (and therefore a clear picture of whether GRB hosts are deficient in molecules or not) for GRB sight-lines uncertain (e.g.Arabsalmani et al. 2018b;Micha lowski et al. 2018). In addition, most of the host galaxies with de-tected CO emission lines have a detection of only a single transition. These reasons, together with the low detection
rate of CO absorption in optical afterglow spectra, makes a direct comparison between host galaxy CO emission and afterglow CO absorption difficult.
No detections of H2 emission, through either pure
ro-tational or ro-vibrational transitions, have been reported to date. In this paper we perform a first exploratory search for ro-vibrational H2lines in a sample of four, low redshift, long GRB host galaxies, to inform more sensitive searches with future observatories.
2 OBSERVATIONS
In this paper we use a small sample of four low-redshift GRB hosts as a pilot study. All four have z . 0.1 (Table 1), to ensure a chance of detecting the 1-0 S(1) transition in the usable range of near-infrared (NIR) spectrographs. Such low redshift GRBs are relatively rare (the mean red-shift forSwift-discovered GRBs is∼1.9,Selsing et al. 2018), and often hosts are too faint in the NIR range to have rea-sonable quality spectra at the H2 wavelengths. To give a crude guess at the required flux limits, we used the find-ings of Pak et al. (2004), who observed a sample of vig-orously star forming galaxies, and found that the ratio of the ro-vibrational 1–0 S(1) H2 line luminosity (LH2) and the far-infrared (FIR) continuum luminosity (LFIR) are broadly
constant atLH2/LFIR∼10
−5for a wide range in galaxy mass.
The host of GRB 031203 has a well determined FIR lumi-nosity (Symeonidis et al. 2014), which gives an expected H2
flux of a few times10−17erg s−1cm−2.
For three of the hosts in our sample, the spectra, their acquisition, reduction and calibration have been described in detail in previous papers: the hosts of GRBs 060218 (Wiersema et al. 2007;Wiersema 2011), 031203 (Watson et al. 2011) and 100316D (Starling et al. 2011;Wiersema 2011; Flores et al. in prep). The host of GRB 100316D is large, and we use the spectrum of the brightest star forming region in this host (a.k.a. source “A”,Starling et al. 2011).
In addition to these sources, we observed the host of nearby GRB 080517 (Stanway et al. 2015a). This last source is of particular interest because of a detection of an emis-sion line of carbon monoxide (Stanway et al. 2015b). We ob-served this host with the Long-slit Intermediate Resolution Infrared Spectrograph (LIRIS, Acosta-Pulido, Dominguez-Tagle & Manchado 2003) on the 4.2m William Herschel Telescope, starting at 23:31 UT on 3 March 2015. We used the low resolution HK grism (lr hk) and a 1 arcsecond wide slit, which gave a wavelength range 1.089−2.396 µm. We obtained 4 nodding cycles, of 2 positions each, using an ex-posure time of 450 s per exex-posure. Seeing conditions during the observations varied between 1.1 and 1.9 arc seconds, with the latter value measured on H and Ks images taken
directly after the science exposures. We reduced the data using version 2.15 of thelirisdr1 package inIRAF2. We ob-served the star SAO 013747 (an A0 photometric standard star) to aid flux calibration: correction for telluric features,
1 lirisdris supported by J. Acosta. 2
IRAFis distributed by National Optical Astronomy
[image:4.595.316.533.98.243.2]Observa-tories, operated by the Association of Universities for Research in Astronomy, Inc., under contract with the National Science Foun-dation.
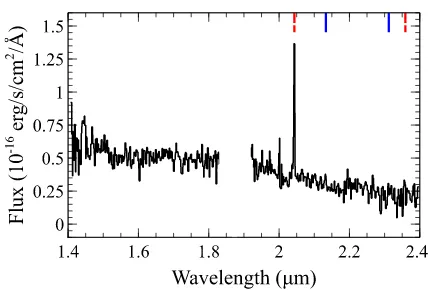
Figure 1.The LIRIS spectrum of the host galaxy of GRB 080517. For plotting purposes the spectrum is smoothed with a 3 pixel me-dian filter. The wavelength is as observed. The area worst affected by telluric absorption (i.e. with strongest residuals after telluric absorption correction) is omitted from the plot. The dashed red lines indicate the wavelengths of Paschenα(left) and Brackett
γ(right); the solid blue lines indicate the wavelengths of the H2
1–0 S(3) (left) and 1–0 S(1) transitions.
and flux calibration, was done using theSpeXtool software package (Cushing, Vacca & Rayner 2004), in particular the
xtellcor general task. To bring the spectrum onto an abso-lute flux scale, we used LIRIS imaging observations in J,H andKs filters. These imaging observations were performed
on the night of 5 December 2014, starting at 23:24 UT, and consisted of two cycles of 5 dither positions with 30 seconds integration time for theHband, and three cycles of 5 dither positions in theKs band. The seeing was fair at 1.2 arc
sec-onds FWHM. After source extraction usingSExtractor (Bertin & Arnouts 1996), calibration onto 12 bright stars in the 2MASS survey gives the following magnitudes (in the 2MASS Vega system) for the host galaxy: H=15.78±0.05 andKs=15.51±0.06. The response and telluric absorption
calibrated host galaxy spectrum was corrected using these photometric values, and is shown in Figure1.
Generally speaking, the spectra we use in this paper were obtained as part of GRB follow-up campaigns, and therefore are a heterogeneous sample in depth, wavelength range and resolution.
3 ANALYSIS
4
K. Wiersema et al.
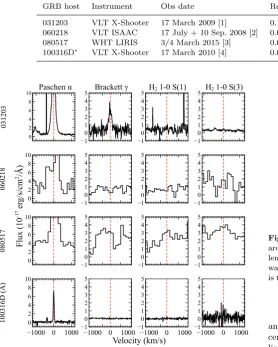
Table 1. Observations used in this paper.∗: Note that the spectroscopic observations discussed in this paper concern the brightest star forming region in this host galaxy, known as source A (Starling et al. 2011). The magnitudes given in this table are all integrated magnitudes for the whole host galaxy. References for spectroscopy data: [1] Watson et al. (2011), [2] Wiersema (2011), [3] This work, [4] Starling et al. (2011). References for the host infrared magnitudes: [5] Prochaska et al. (2004), [6] Hjorth et al. (2012), [7] This work, [8] Micha lowski et al. (2015). References for abundance: [9] Guseva et al. (2011), [10] Wiersema et al. (2007); [11] Stanway et al. (2015a), [12] Starling et al. (2011).
GRB host Instrument Obs date Redshift Host IR (Vega) magnitude 12+log(O/H)
031203 VLT X-Shooter 17 March 2009 [1] 0.105 K0=16.54±0.02[5] 8.20 [9] 060218 VLT ISAAC 17 July + 10 Sep. 2008 [2] 0.033 Ks=17.94±0.09[6] 7.54 [10]
080517 WHT LIRIS 3/4 March 2015 [3] 0.089 Ks=15.51±0.06[7] ∼8.7 [11]
100316D∗ VLT X-Shooter 17 March 2010 [4] 0.059 K
s=15.93±0.09[8] 8.23 [12]
Figure 2.This plot shows postage stamp cut-outs of the spectra of the four host galaxies in this paper. Each spectrum covers the range −1200to +1200km/s around the position of four lines of interest, which are indicated with a vertical red dashed line. The flux axis is identical for all lines and sources, with the exception of the Paschenαline panels. The different continuum brightness between sources is readily apparent, as well as the varying con-tinuum noise as lines fall in or out of regions with strong telluric absorption. A zoom-in of the top-right panel, with the only de-tection of a ro-vibrational H2line (1–0 S(3)) in the sample, can
be seen in Figure 3.
assumption that the H2 line profile is the same as that of
the Paschen and/or Balmer lines.
After the redshift was found accurately, we used a cata-logue of H2ro-vibrational transition wavelengths (e.g.Black & van Dishoeck 1987) to search for emission lines. In cases of non-detection, we computed 3σupper limits on the line flux, using the emission line profile properties of Paschenαand/or Brackettγ. We note that the absolute flux calibration of the spectra has a considerable uncertainty: the slit may not en-compass the entire extent of the galaxy, some data were taken during somewhat non-spectrophotometric conditions,
Figure 3.X-Shooter spectrum of the host galaxy of GRB 031203, around the location of the H2 1–0 S(3) transition, whose
wave-length at the host redshift is marked with a dashed red line; the wavelength is as observed. The bright emission line near 2.15µm is the Hi8-4 (Brackettδ) line, the one near 2.16µm is a HeIline.
and telluric absorption often complicates flux calibration un-certainties. Line fluxratios are more reliable, especially of lines close together in wavelength (and similarly affected by telluric absorption), and we therefore primarily express our limits and detections as a ratio, using the bright Paα line which is detected at high signal-to-noise in all four sources. Figure2shows some postage-stamp cutouts of the spec-tra at the positions of a selection of useful lines. It is clear from these that the signal-to-noise for a given source can vary a lot with wavelength: the different redshifts of the host galaxies shift lines nearer or further from telluric absorption and emission features (the influence of these is stronger for the low resolution spectra), or further into, or out of, wave-length regions where the spectrograph sensitivity is poorer (e.g. in X-shooter data the thermal noise in theK band is high,Vernet et al. 2011). Generally speaking, we limit our search to a dozen lines bluewards of∼2.25 µm, the strong Q branch lines at ∼ 2.4 µm and the 2–1 S(1) line (useful diagnostic for collisional excitation,Black & van Dishoeck 1987, see section5) are unfortunately not in reach for these sources with the spectrographs we used.
While long GRBs are (generally) accompanied by highly energetic type Ib/c supernovae (though not always detected,
Fynbo et al. 2006b), the contribution of emission of such SNe to our spectra is negligible: our spectra are either taken long after the SN has faded away (Table 1), or, in the case of
[image:5.595.309.520.176.401.2]100316D, cover a region away from the GRB/SN (Starling et al. 2011).
All spectra contain a high significance detection of Paschen α. For three out of four hosts we do not detect any emission lines with significance>3σat the positions of the H2 transitions. In the Xshooter spectrum of the host of
GRB 031203, we detect a single H2transition, 1–0 S(3), with flux significance of∼4σ (Figure3), and with the expected centre wavelength and line shape. We estimate its flux at ∼1.0±0.24×10⁻¹⁷erg s−1cm−2, with the caveats applying to the line fluxes as listed above.
The results of the flux ratio measurements for the lines that are expected to be strongest (see below) are given in Table2.
4 ROTATIONAL LINES IN THE HOST OF GRB 031203
The host of GRB 031203 is one of the very few host galaxies with good quality (mid-)infrared spectra taken by Spitzer, using the Infrared Spectrograph (IRS) instrument (Watson et al. 2011). These spectra (shown in Figure 1 ofWatson et al. 2011) cover a range from∼5−35µm in the rest frame, and therefore cover strong pure rotational transitions of H2, in particular the S(0) to S(7) transitions. Motivated by the possible detection of a ro-vibrational H2 line, we reanalyze
theseSpitzerspectra here.
4.1 Model fitting and molecular mass estimates
Considering the diverse range of heating environments in the galaxy interstellar medium (ISM), the traditional method of fitting two or three discrete temperature molecule compo-nents to the excitation diagram is not realistic. Instead we assumed a continuous power law temperature distribution for H2to fit the excitation diagram and hence calculated the total H2gas mass in the ISM (for details referTogi & Smith 2016). We assumed that the column density of H2molecules is distributed as a power law function with respect to tem-perature,dN∝T−ndT, wheredNis the number of molecules in the temperature rangeT toT+dT. The model consists of three parameters, upper and lower temperature with power law index, denoted byTu,Tl, andn, respectively.
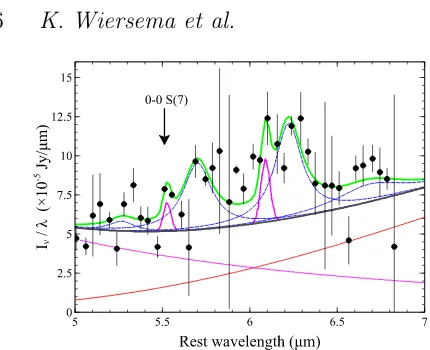
We attempted to fit the mid-infrared (MIR) spectrum for the host of GRB 031203 usingPAHFIT, a spectral de-composition tool to estimate the H2 line fluxes (Smith et al. 2007). No convincing H2 line flux was detected, except
a tentative detection of the 0–0 S(7) line, with a flux of ∼ 5.3×10⁻¹⁶ erg s−1cm−2. A section of the spectrum and the fitted components, including the 0–0 S(7) transition, is shown in Figure 4. As is clear from Figure 4, the 0–0 S(7) covers only a few datapoints with low flux errors, and we consider its detection tentative for that reason. The 0– 0 S(6) transition (the magenta component at 6.11 µm in Fig.4) is very close to a strong polycyclic aromatic hydro-carbon (PAH) feature at 6.22 µm, and the uncertainties in the datapoints are larger than for 0–0 S(7). We therefore don’t consider the 0–0 S(6) line reliably detected, and will in the following only consider the tentative detection of the 0–0 S(7) line.
The power law index could not be determined due to
non detection of any other rotational H2 lines. The aver-age power law indexnis about 4.84±0.61 in the the galaxy sample ofTogi & Smith (2016) and ∼4.2 in shock regions of Stephan’s Quintet (Appleton et al. 2017). Using equation 9 of Togi & Smith 2016and assuming a value of n =4.5, Tl = 50 K, Tu= 2000 K, with the S(7) line flux estimate
above, the calculated H2gas mass is 1.7×10⁹Min the host of GRB 031203 (2.3×10⁹ M, including He and heavy ele-ment mass corrections). The variation innfrom 4.0–5.0 can change the gas mass in the range (0.37–7.5)×109 M (and (0.5–10)×109 M with He and heavy element correction). The upper dust mass limit estimated is 108 Min this host (Micha lowski et al. 2015). Using a gas-to-dust ratio of 500, using theR´emy-Ruyer et al.(2014) scaling relation for the metallicity value of 8.2 for GRB 031203, the limit on the gas mass is<5.0×10¹⁰ M, consistent with our estimates. Our study suggests the presence of a few×109Mmolecular gas in this host galaxy, but we caution that higher spectral reso-lution data, at higher signal-to-noise, is required to establish the veracity and accurate flux of the S(7) line candidate. We can compare the H2 mass estimate with other GRB hosts, using Figure 3 ofStanway et al.(2015b), and using the star formation rate and stellar mass from the literature. Using the values fromSavaglio, Glazebrook & Le Borgne(2009), log(M∗/M) ∼8.8, SFR∼12.7M/yr, we find that a H2mass
around or below 109 M is consistent with the behaviour of other GRB hosts in this diagram. However, we note that estimates of stellar mass (and star formation rate) for this host show a large scatter, ranging from log(M∗/M) ∼ 8.4 to ∼9.5(Guseva et al. 2011and Micha lowski et al. 2015, respectively).
5 DISCUSSION
The spectra of GRB host galaxies are dominated by strong emission lines from Hiiregions, whereas H2 lines originate in colder neutral molecular clouds. The H2 in our hosts can
be excited by two main processes: through collisional pro-cesses (e.g. involving shocks from stellar winds and super-novae, rational levels are populated by collisions of H2with
neutral atoms or other H2 molecules); or through fluores-cence. In this latter process, the H2 molecules absorb UV
photons (the Lyman-Werner bands), and then decay into ro-vibrational states. Observations of extragalactic sources have shown both processes may occur (e.g.Izotov & Thuan 2016; Pak et al. 2004). The two processes can be differen-tiated by comparing fluxes of different H2 transitions with
models (e.g.Black & van Dishoeck 1987). In particular, UV fluorescence should give rise to brighter lines from transi-tions of higherνstates.
6
K. Wiersema et al.
Figure 4.A small section of theSpitzerspectrum with the PAH-FIT fit is shown (note that the model is fit over the fullSpitzer
range, see Section4.1). We use the standard PAHFIT convention for the components (see Smith et al. 2007): the black-body fit to the (dust) continuum (red), the stellar continuum (magenta), the combined continuum (thick grey), the PAH features (blue), the narrow atomic and molecular features (narrow magenta com-ponents), the composite fit (green) and the datapoints (black). The location of the 0-0 S(7) transition is indicated with a verti-cal arrow, the other magenta peak is the 0-0 S(6) transition (see Section4.1for a discussion).
ro-vibrational H2lines in the same source, shows broad
con-sistency with expectations from fluorescence: we choose the same models fromBlack & van Dishoeck(1987) as favoured by Izotov & Thuan(2016), and use the measured H2 flux
ratios from Izotov & Thuan (2016) to compensate for the absence of 1–0 S(3) from the prediction tables of Black & van Dishoeck (1987). In the host of GRB 031203, the ratio 1–0 S(1) / Brγ .0.12is comparable to the values found in the sample ofIzotov & Thuan(2011,2016);Vanzi, Hunt & Thuan(2002).
The host galaxy of GRB 080517 is the only one in our sample with a detection of a CO emission line (Stanway et al. 2015b). It is also a somewhat unusual source for its bright NIR continuum, caused by a combination of mass, redshift and the presence of a relatively bright older stellar population in addition to the ongoing star formation, see
Stanway et al.(2015a). While our WHT spectroscopy is too shallow to give useful limits on the CO/H2ratio, this source will be a key target for higher resolution IR spectrographs on bigger telescopes.
GRBs 060218 and 100316D gave rise to two of the best studied GRB associated supernovae, and are therefore im-portant as keystones for GRB-host studies, as the super-novae may provide a direct link to stellar GRB progenitor properties. In both cases the sources are faint (Table1; note that for 100316D the full integrated magnitude is given, not the one of only source A), with very weak continuum and very strong nebular lines. The host of 060218 has a very low mass and metallicity (Table1) and a high specific star for-mation, making it unlikely to host strong H2lines, as pointed
out in a first search by Wiersema(2011). The better reso-lution of X-shooter would allow a more sensitive limit on the H2 fluxes to be set in the future, as the redshift of this
source places most lines in regions affected by strong telluric absorption.
In the coming era of highly sensitive instruments at
NIR and MIR wavelengths, such as the Near Infrared Spec-trograph (NIRSpec) and Mid Infrared Instrument (MIRI) instruments onboard the James Webb Space Telescope (JWST), covering wavelengths 0.6–28µm, the ro-vibrational lines of H2 can easily be detected (the 1–0 S(1) line will be in the MIRI spectral range for the entire known GRB red-shift distribution), and the molecular gas properties in the GRB host galaxies can be studied using multiple transitions. Telluric absorption lines strongly limit the use of ground-based low resolution spectroscopy: the change to space-ground-based JWST data will allow access to a larger number of transi-tions in each spectrum. Using the flux estimate of the 1–0 S(3) line in the host of GRB 031203, we find that NIRSpec can provide a highly significant, spatially resolved, detection of this line in this host using exposure times under an hour, as well as several other ro-vibrational transitions. The same holds for MIRI spectroscopy targetting the rotational lines in low redshift GRB hosts. Detecting ro-vibrational lines in GRB host galaxies that showed Lyman-Werner lines in their afterglow spectra, would require the presence of sub-stantially larger reservoirs of warm H2than seen in the host of GRB 031203.
6 CONCLUSIONS
Motivated by the recent detections of CO molecule emission in GRB host galaxies, we searched rest-frame infrared spec-tra of a sample of four low redshift GRB host galaxies for signatures of H2 vibrational emission lines. A single
ro-vibrational H2emission line candidate is detected at the po-sition of the 1–0 S(3) tranpo-sition in the host of GRB 031203. The other GRB host spectra in our sample show no signifi-cant H2 line candidates, which is likely caused by signal-to-noise and resolution limitations, as well as the positions of the lines near telluric absorption features. We re-analysed low resolution Spitzer mid-infrared spectra of the host of GRB 031203 to search for H2 rotational lines. A single weak line candidate, at the position of the 0–0 S(7) transition, is seen, but the reality of this line is debatable, because of the low resolution of theSpitzerspectra. Observations with future facilities with better resolution and higher sensitiv-ity, particularly from space, will provide the means to de-tect the multiple lines required for proper comparison with low-redshift galaxy samples and high redshift molecule de-tections in afterglow spectra.
ACKNOWLEDGEMENTS
It is a pleasure to thank the staff at ING for their help in obtaining the LIRIS observations in this paper, and Jose Acosta Pulido for development of (and friendly as-sistance with) the lirisdr software. We thank the anony-mous referee for their constructive feedback. We acknowl-edge M. Micha lowski and M. Arabsalmani for useful dis-cussions. Based on observations collected at the European Organisation for Astronomical Research in the Southern Hemisphere under ESO programmes 60.A-9022(C), 381.D-0723(C) and 084.A-0260(B). The WHT and its override pro-gramme (W/2015A/11 for observations in this paper) are operated on the island of La Palma by the Isaac Newton
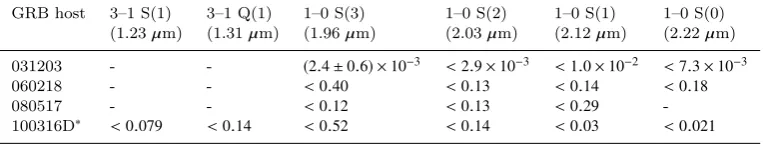
Table 2. Listed are the flux ratios of the molecular line fluxes (or limits) divided by the Paschenαline flux. Limits are3σ. A dash indicates that a line measurement was not possible due to very strong telluric absorption, presence of residuals from sky emission lines, very poor signal-to-noise, or because the wavelength is not covered by the spectrum.∗: Note that the spectroscopic observations discussed in this paper concern the brightest star forming region in this host galaxy, known as source A (Starling et al. 2011).
GRB host 3–1 S(1) 3–1 Q(1) 1–0 S(3) 1–0 S(2) 1–0 S(1) 1–0 S(0) (1.23µm) (1.31µm) (1.96µm) (2.03µm) (2.12µm) (2.22µm)
031203 - - (2.4±0.6) ×10−3 <2.9×10⁻³ <1.0×10⁻² <7.3×10⁻³
060218 - - <0.40 <0.13 <0.14 <0.18 080517 - - <0.12 <0.13 <0.29 -100316D∗ <0.079 <0.14 <0.52 <0.14 <0.03 <0.021
Group in the Spanish Observatorio del Roque de los Mucha-chos of the Instituto de Astrof´ısica de Canarias. AT is grate-ful for support from the National Science Foundation under grant no. 1616828. KW, NRT and RLCS acknowledge fund-ing from STFC. The Cosmic Dawn center is funded by the DNRF.
REFERENCES
Acosta-Pulido J., Dominguez-Tagle C., Manchado A., 2003, in Iye M., Moorwood A. F. M., eds, Proc. SPIE Conf. Ser. Vol. 4841, Instrument Design and Performance for Opti-cal/Infrared Ground-based Telescopes. SPIE, Bellingham, p. 437
Appleton, P. N., Guillard, P., Togi, A., et al. 2017, ApJ, 836, 76 Arabsalmani, M. et al. 2018, MNRAS 473, 3312
Arabsalmani, M. et al. 2018b, MNRAS 476, 2332 Bertin, E. & Arnouts, S. 1996, A&AS, 177, 393 Black, J. H. & van Dishoeck, E. F. 1987, ApJ 322, 412
Bolatto, A. D., Wolfire, M. & Leroy, A. K. 2013, ARA&A 51, 207 Bragg, S. L., Smith, W. H., Brault, J. W. 1982 ApJ 263 999 Covino, S. et al. 2013, MNRAS 432, 1231
Cushing, M.C., Vacca, M.D., & Rayner, J.T. 2004, PASP 116, 362
D’Elia V. et al., 2014, A&A, 564, 38 Draine, B. T. 2000, ApJ, 532, 273
Draine, B. T. & Hao, L. 2002, ApJ, 569, 780 Friis, M. 2015, MNRAS 451, 167
Fynbo, J. P. U. et al. 2006, A&A, 451, L47 Fynbo, J. P. U. et al. 2006b, Nature 444, 1047 Fynbo, J. P. U. et al. 2008, ApJ, 683, 321 Fynbo, J. P. U. et al. 2009, ApJS 185, 526 Fynbo, J. P. U. et al. 2014, A&A 572, 12 Greiner, J. et al. 2015, ApJ 809, 76
Guillard, P., Boulanger, F., Lehnert, M. D., Appleton, P. N. & Pineau des Forˆets, G. 2015, SF2A-2015: Proceedings of the Annual meeting of the French Society of Astronomy and As-trophysics: Warm molecular Hydrogen at high redshift with the James Webb Space Telescope, eds. Martins F., Boissier S., Buat V., Cambr´esy L., Petit P., pp81–85
Guseva, N. G., Izotov, Y. I., Fricke, K. J., Henkel, C. 2011, A&A 534, 84
Hatsukade, B., Ohta, K., Endo, A., et al. 2014, Nature, 510, 247 Heintz, K. E., et al. 2017, A&A, 601, A83
Hjorth, J., et al. 2012, ApJ 756, 187
Izotov, Y. I. & Thuan, T. X. 2011, ApJ, 734, 82 Izotov, Y. I. & Thuan, T. X. 2016, MNRAS 457, 64 Jakobsson, P. et al. 2006, A&A Letters, 460, L13 Kr¨uhler T. et al. 2013, A&A, 557, 18
Kr¨uhler T. et al. 2015, A&A 581, 125 Ledoux, C. et al. 2009, A&A 506, 661 Micha lowski, M. J. et al. 2015, A&A 582, 78
Micha lowski M. J., et al., 2016, A&A, 595, A72 Micha lowski M. J., et al., 2018, arXiv:1804.06492
Noterdaeme, P., Ledoux, C., Petitjean, P., Srianand, R. 2008, A&A 481, 327
Noterdaeme, P., Petitjean, P., Srianand, R. 2015, A&A 578, L5 Pak, S., Jaffe, D. T., Stacey, G. J., Bradford, C. M., Klumpe, E.
W., Keller, L. D. 2004, ApJ 609, 692 Perley, D. A. et al. 2016, ApJ 817, 7 Perley, D. A. et al. 2016, ApJ 817, 8 Perley, D. A. et al. 2017, MNRAS 465, L89 Prochaska, J.X. et al. 2004, ApJ 611, 200
Prochaska, J. X., Chen, H.-W., Wolfe, A. M., Dessauges-Zavadsky, M., Bloom, J. S.
Prochaska, J. X. et al., 2009, ApJ, 691, L27
R´emy-Ruyer, A., Madden, S. C., Galliano, F., et al. 2014, A&A, 563, A31
Savaglio, S., Glazebrook, K. & Le Borgne, D. 2009, ApJ 691, 182 Schady, P. 2015, JHEAp 7, 56
Selsing, J. et al. 2018, arXiv:1802.07727
Sheffer, Y., Prochaska, J. X., Draine, B. T., Perley, D. A., & Bloom, J. S. 2009, ApJ, 701, L63
Smith, J. D. T., Draine, B. T., Dale, D. A., et al. 2007, ApJ, 656, 770
Stanway, E. R., Levan, A. J., Tanvir, N. R., Wiersema, K., van der Horst, A. J., Mundell, C. G., Guidorzi, C. 2015, MNRAS 446, 3911
Stanway, E. R., Levan, A. J., Tanvir, N. R., Wiersema, K., van der Laan, T. P. R. 2015, ApJ 798, 7
Starling, R. L. C. et al. 2011, MNRAS 411, 2792 Symeonidis, M. et al. 2014, MNRAS 443, 124 Togi, A., & Smith, J. D. T. 2016, ApJ, 830, 18
Tumlinson J., Prochaska J. X., Chen H. W., Dessauges-Zavadsky M., Bloom J. S., 2007, ApJ, 668, 667
Vanzi, L., Hunt, L. K. & Thuan, T. X. 2002, A&A 390, 481 Vergani, S. D. et al. 2017, A&A 599, 120
Vernet, J. et al. 2011, A&A, 536, 105 Vreeswijk, P. M. et al. 2007, A&A 468, 83 Watson, D., et al. 2011, ApJ 741, 58 Wiersema, K., et al. 2007, A&A, 464, 529 Wiersema, K. 2011, MNRAS 414, 2793
This paper has been typeset from a TEX/LATEX file prepared by