© 2019, IRJET | Impact Factor value: 7.211 | ISO 9001:2008 Certified Journal | Page 6470
EXPERIMENTALLY AND CFD ANALYSIS ON SPOILER IN WIND TUNNEL
EXPERIMENT
Sabir Hussain
1, Nausad Khan
2, Rupesh Kumar
31
Research Scholar, Dept. of Mechanical Engineering, DITMR Faridabad, India
2Assistant Professor, Dept. of Mechanical Engineering, DITMR Faridabad, India
3Assistant Professor, Dept. of Mechanical Engineering, DITMR Faridabad, India
---***---Abstract -In high speed cars of sedan class, there comes amajor problem of lack of grip on road while running at high speeds. This problem comes due to the geometry of the car outer body. This can be understood by considering the fact, that while running, the upper and lower surface relative wind streams has to meet themselves on back side of the car in the same time. A spoiler was fabricated and tested at different wind velocities on Wind Tunnel available at Al-falah University, Faridabad and the tests yielded the respective lift and drag coefficients. It was noticed that as the wind velocity was decreasing lift and drag coefficients were increasing. At the same time the lift to drag ratio was also increasing. Thereafter the three d dimensional simulation of flow over the fabricated spoiler was carried out on the ANSYS 14.0. workbench. The simulation was done in such a way that it imitated the wind tunnel experiment and also yielded almost same results. Thereafter a comparison was done between the results of wind tunnel experiment and the three dimensional CFD analysis and the percentage error of 3 to 11.11 was recorded. There is find out a small error in Wind Tunnel Experiments and CFD. CFD involves simple geometric construction and changes can be made easily at any stage while actual experimentation requires lots of time and money. That is why CFD analysis is much cheaper than experiments. However the boundary condition data required can only come from experimental techniques. There is still a considerably strong need for wind tunnel experiments to validate CFD data in turbulent flows. The aerodynamic properties of a spoilers only depend on its cross sectional profile and its plan form.
Key Words:Spoiler, Wind Tunnel, CFD Analysis, Ansys,
Solid Works, Fluid Pressure, CAE Tools.
1. INTRODUCTION
In high speed cars of sedan class, there comes a major problem of lack of grip on road while running at high speeds. This problem comes due to the geometry of the car outer body. This can be understood by considering the fact, that while running, the upper and lower surface relative wind streams has to meet themselves on back side of the car in the same time. Now the shape of sedan class cars outer body is such that, while running, the relative wind has to travel a larger distance at the upper surface rather than the lower surface. Now, to fulfill this requirement the
upper surface relative wind velocity has to be greater than that of the lower surface relative wind. Hence pressure on the upper side of the car drops with respect to the lower surface at high speeds. This pressure difference between upper and lower surfaces of the car creates an upwards lift force which adversely affects the road grip of car at high speed. The same phenomenon works on the airplane wings to give it the required lift force. This is because of the resemblance between outer body- geometry of sedan cars and airplane wing’s profile. The profile or cross section of airplane wings is called airfoil.
So due to airfoil like shape of sedans they experience an unwanted lift force at high speeds. Now, to overcome this problem a wing type structure is incorporated on the rare side of the car which is called back air spoiler or simply a spoiler.
1.1 Spoiler
A Spoiler is an aerodynamic device, which give car a downwards force called downwash, to counterbalance the unwanted lift force at high speed runs. A spoiler reduces drag due to air turbulences and wake formations. Spoilers ensure a good road grip and improve the overall performance of the car. They are one of the most important parts of a racing car. In some cases
1.2 Spoiler terminology
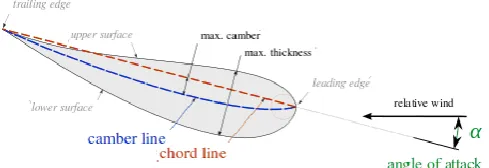
Spoilers are stream line shaped wings which are used in high speed automobiles. These shapes are such that the drag force is a very small fraction of the downwards force (Downwash). The following nomenclatures are used for defining a spoiler.
[image:1.595.314.559.652.736.2]© 2019, IRJET | Impact Factor value: 7.211 | ISO 9001:2008 Certified Journal | Page 6471
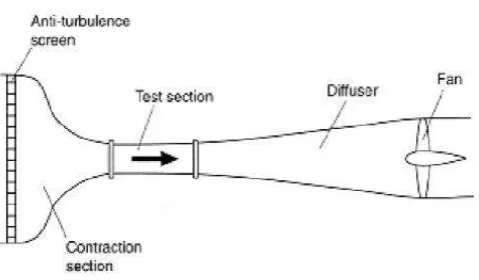
1.3 Wind Tunnel [image:2.595.36.289.208.320.2]Wind-tunnels represent a useful tool for investigating various flow phenomena. An advantage of using wind-tunnels is that experiments there can be performed under well controlled flow circumstances compared to experiments in the open environment. The drawback is that small scale models often have to be used instead full scale ditto.
Fig -2: Wind Tunnel with Spoiler Model
Fig -3: Wind Tunnel Test Section
1.4 Computational Fluid Dynamics (CFD)
Computational Fluid Dynamics or CFD as it is popularly known, is used to generate flow simulations with the help of computers. CFD involves the solution of the governing laws of fluid dynamics numerically. The complex set of partial differential equations is solved on in geometrical domain divided into small volumes, commonly known as a mesh (or grid).
2. LITERATURE REVIEW
Spoilers are aerodynamic device used in automobiles and faster moving cars to remove turbulence across body of car. It is attached to an automobile. One of the problems for vehicles is to control wake. Suggested method is to change rear body shape and change of shape of spoiler and result of experiments is a great reduction in value of CD and
CL (Fukuda, et al. 1995).
(Sunanda and Nayak 2013) This study defines that intended function of this device is to “spoil” unfavorable air movement across body of vehicle of some kind in motion. The main function of a spoiler is diffusing airflow passing over and around a moving vehicle as it passes over vehicle. This diffusion is accomplished by increasing amounts of turbulence flowing over shape, “spoiling” the laminar flow and providing a cushion for the laminar boundary layer often spoilers are added solely for appearance with no thought towards practical purpose.
Yet again fuel consumption is studied and tried to be reduced by changing conventional material to advanced material. These reforms must be taken care to meet high future demand specifications. In this context suggested material for spoilers is unreinforced thermoplastic (Jambor and Beyer 1997).
The most common material in this class is Acrylonitrile Butadiene Styrene (ABS) plastic. For better strength and stress absorption capacity fabrication to be done using sandwich construction in which ±45o orientation of fibers
with foam gives better result than ±45o orientation of
fibers without foam (Chodagudi and Rao 2012).
Comparison of various aspects (likes shape, material) in designing Human Powered Vehicles on various road conditions is studied and found that magnitude of drag depends on physical appearance such that body shape, accessories attached ,extrusions etc. (Alam, et al. 2013) .
For smooth flow around spoiler six basic shapes of rear spoiler have been studied and numerical simulation is performed for analysis of stability and noise produced. This analysis suggest that among six shapes case 4, which is an aerofoil shape, has made flow smooth with lower noise level and proposed for spoiler shape (Figure 2.3: Configuration of spoiler (Tsai, et.al. 2009)). The fact it smoothens flow is that it reduces turbulence at tail.
As CFD tool is an important tool in analyzing fluid behavior. Many studies have been performed in order to get best results and validation. Modeling car geometry and analysing for CFD gives results like experiments and behavior is predicted in advance and effect of applying spoiler on rear part of car is studied by making a basic car model and running CFD simulation to find CD and CL values
first without spoiler and then with spoiler and found percentage reduction in CD and CL value be 1.7 and 4
respectively (Hu and Wong 2011). A similar study has been performed later with different model of car and found drag was reduced by 2.02% while lift reduction was exceptional 14.06% (Ramani and Kumar 2013). Relation between CD and CL is established with variable speed
ranging from 80-200 kmph and obtained that at a certain height of spoiler and wind collision angle; change in CD is
[image:2.595.45.285.354.494.2]© 2019, IRJET | Impact Factor value: 7.211 | ISO 9001:2008 Certified Journal | Page 6472
end increases significantly lower as speed of racing carincreases (Theera-Apisakkul and Kittichaikarn 2009).
(Hsu 1994) Shape optimization is defined as a set of geometrical modeling, structural analysis and optimization. In primary step of making design model, geometrical representation of boundary shapes and design variable are defined. The design optimization problem thus can be written as :
Minimize f(x)
Subject to g1(x) ≤ 0 g2(x) ≤ 0
where x is vector of design variable, f(x) is objective functions, g1(x) ≤ 0 and g2(x) ≤ 0 are constraints. Further
analysis model is created separately by help of design model. Choice of analysis technique depends upon converting design model into analysis model, capability and accuracy of analysis technique. In next steps optimization algorithm is used to optimize component.
3. EXPERIMENTAL WORK
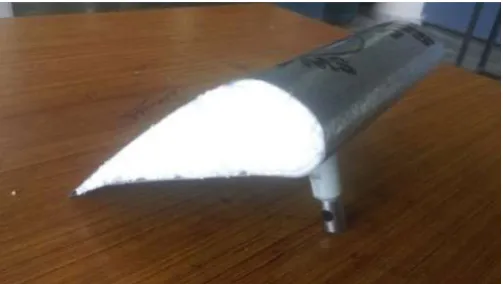
[image:3.595.311.562.434.557.2]As the working of spoiler is quite similar to airfoil so the experiment will be carried out on an airfoil model of suitable dimensions, fabricated by bending a Galvanized Iron (GI) sheet in airfoil shape, to understand the fundamental characteristics and to find coefficient of lift and coefficient of drag forces on the fabricated specimen at a given angle of attack at different wind velocities.
Fig -4: Fabricated spoiler with fixture attachment
Table-1: Spoiler Dimension
Sr. Parameter Symbol Specification
1 Chord Length C 20 (cm)
2 Thickness T 4.4 (cm)
3 Span S 20 (cm)
4 Plan form Area AP 0.04 (m2)
4. METHODOLOGY
An airfoil develops Lift through generally lower pressures above the wing and higher below with respect to the pressure of the approaching air. These lift and drag forces are sensed by load cells incorporated below the airfoil fixture and displayed directly on the test rig. The wind subjected to forces flow by a variable frequency fan is made to pass through a large diffuser which removes the unwanted turbulence and makes the wind flow a streamline while entering the wind tunnel test section. The streamline wind enters into the pitot tube and stagnates inside it. The pressure difference corresponding to the wind velocity is observed from the ‘U tube manometer’ connected with the pitot tube. The wind velocity is calculated using the pressure head, air density and manometer fluid (diesel) density. This wind velocity is used in finding the lift and drag coefficients on the airfoil.
4. 1 Technical Data For Subsonic Wind Tunnel
Electricity supply 440V AC, 50Hz, 32Amp. MCB, 4 Pole with Earth connection Power supply 3 phase
Test section 300mmx300mmx1220mm
[image:3.595.37.289.451.593.2]Maximum air velocity 45 m/s Contracts area required 10mx1m.
Table-2: Technical data for Calculations
Free stream velocity was measured using Pivot Static tube:
Following formula are used for pitot static tube:
Z = ( ) ( 1) m V = Cv√ m/s
Coefficients of drag and Lift :
CD =
CL=
Where FD and FL are the drag and lift coefficients
© 2019, IRJET | Impact Factor value: 7.211 | ISO 9001:2008 Certified Journal | Page 6473
4.2 ObservationsTable-3: Observations and results of wind tunnel Experiment
S
N o
Dra g Forc
e FD (N)
Lift Force
FL (N)
Manometer Readings
(cm)
Pressu re Head
Z (m)
Air Veloc
ity V (m/s)
Drag coeffi cient CD
Lift Coef ficie nt CL
Z1 Z2
1 4.70 12.55 30.5 15.5 103.35 44.12 0. 10 0.27
2 4.41 12.85 30.5 16 99.9 43.38 0.10 0.29
3 3.82 15.30 29 17 82.68 39.47 0.10 0.42
4 3.43 15.50 28.3 18.4 68.21 35.85 0. 1 1 0.5 1
5 2.74 16.67 27 19.6 50.98 31 0. 12 0.74
6 1.96 16.48 26 21 34.45 25.47 0.13 1.09
5. CFD ANALYSIS
5.1 Three Dimensional Analysis
Three dimensional analysis of spoiler is done to just imitate the wind tunnel experiments and compare the results of wind tunnel experiments with CFD results. For this analysis the 3D model of spoiler enclosed in a rectangular box is generated in Rhinoceros software which is directly imported to ANSYS Fluent workbench for
further analysis. The dimensions
(300mmx300mmx1220mm) of the box are kept identical to the wind tunnel test section to exactly imitate the experiment.
[image:4.595.292.560.53.208.2]Fig- 5: Fabricated Spoiler
Fig -6: 3D model of fabricated spoiler
Fig-6: Fluid domain of 3D spoiler
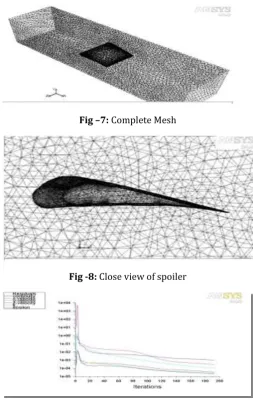
5.2 Mesh
[image:4.595.46.558.323.732.2]Mesh generation is done direct from default settings keeping the relevance size as fine. The front surface is named as inlet and the rare surface is named as outlet. The remaining is named as wall.
[image:4.595.308.562.327.728.2]Fig –7: Complete Mesh
Fig -8: Close view of spoiler
[image:4.595.36.289.458.557.2]© 2019, IRJET | Impact Factor value: 7.211 | ISO 9001:2008 Certified Journal | Page 6474
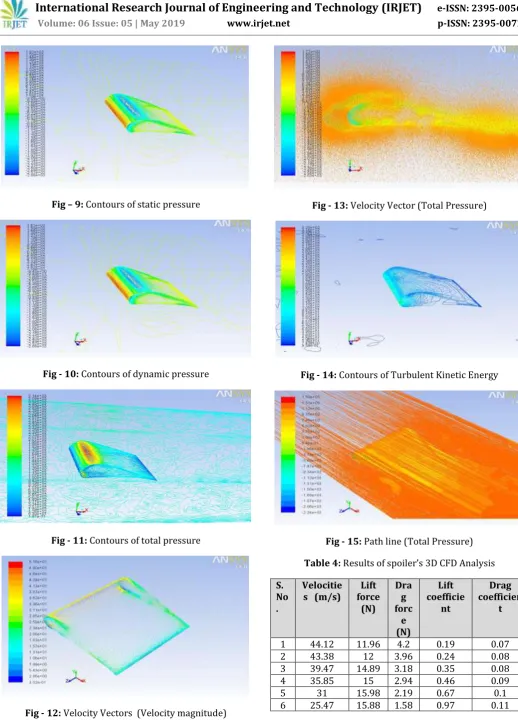
Fig – 9: Contours of static pressureFig - 10: Contours of dynamic pressure
Fig - 11: Contours of total pressure
Fig - 12: Velocity Vectors (Velocity magnitude)
Fig - 13: Velocity Vector (Total Pressure)
Fig - 14: Contours of Turbulent Kinetic Energy
[image:5.595.36.555.48.769.2]Fig - 15: Path line (Total Pressure)
Table 4: Results of spoiler’s 3D CFD Analysis
S. No .
Velocitie
s (m/s) force Lift (N)
Dra g forc
e (N)
Lift coefficie
nt
Drag coefficien
t
1 44.12 11.96 4.2 0.19 0.07
2 43.38 12 3.96 0.24 0.08
3 39.47 14.89 3.18 0.35 0.08
4 35.85 15 2.94 0.46 0.09
5 31 15.98 2.19 0.67 0.1
© 2019, IRJET | Impact Factor value: 7.211 | ISO 9001:2008 Certified Journal | Page 6475
Table 5: Comparison between results of 3D CFDanalysis and Wind tunnel experiment.
S. No.
Velocity
Wind Tunnel Results
CFD
Results Error % Error %
(m/s) C L
CD
CL
CD (CL) (CD)
1 44.12 0.27 0.1 0.24 0.1 11.11 10
2 43.38 0.29 0.1 0.26 0.1 10.3 10
3 39.47 0.42 0.1 0.39 0.1 7.1 10
4 35.85 0.51 0.11 0.46 0.1 9.8 9
5 31 0.74 0.12 0.67 0.1 9.4 8.3
6 25.47 1.09 0.13 0.97 0.1 11 7.7
6. RESULTS AND DISCUSSIONS
6.1 Results
A spoiler was fabricated and tested at different wind velocities on Wind Tunnel available at Al-falah University, Faridabad and the tests yielded the respective lift and drag coefficients. It was noticed that as the wind velocity was decreasing lift and drag coefficients were increasing. At the same time the lift to drag ratio was also increasing. Thereafter the two dimensional CFD analysis of fabricated spoiler’s cross section was carried out on ANSYS 14 Fluent workbench on a single velocity and the respective flow variables such as pressure contours, velocity contours, path line etc. were presented.
6.2 Conclusions:
Here is a small error in Wind Tunnel Experiments and CFD.CFD involves simple geometric construction and changes can be made easily at any stage while actual experimentation requires lots of time and money. That is why CFD analysis is much cheaper than experiments. However the boundary condition data required can only come from experimental techniques. There is still a considerably strong need for wind tunnel experiments to validate CFD data in turbulent flows. The aerodynamic properties of a spoilers only depend on its cross sectional profile and its plan form.
REFERENCES
[1] Abhishek Srivastava. “Shape Optimization of Spoiler” M. Tech Dessertation 2013-14, Department of Mechanical Engineering, IIT Delhi.
[2] Ahmad, Nor Elyana, Essam Abo-Serie, and Adrian Gaylard. “Mesh Optimization for Ground Vehicle Aerodynamics.” CFD Letters 2, no. 1 (2010): 54-65. [3] Alam, Firoz, Harun Chowdhurya, Erika Guillaumea, Jie
Yanga, and Gary Zimmer. “On-road and Wind Tunnel Aerodynamic Study of Human Powered Vehicles.” Procedia Engineering 60 (2013): 473-478.
[4] ANSYS-Inc. “ANSYS FLUENT in ANSYS Workbench User's Guide.” 2011.
[5] Chodagudi, Kamprasad, and T.B.S. Rao. “Analysis of NACA 2412 for Automobile Rear Spoiler Using Composite Material.” International Journal of Engineering Research & Technology 1, no. 7 (2012): 1-5.
[6] Cornell-University.FLUENT-Flow over an Airfoil. https://confluence.cornell.edu/display/SIMULATION /FLUENT+-+Flow+over+an+Airfoil (accessed June 03, 2015).
[7] Deb, Kalyanmoy. Optimization for Engineering Design. PHI Learning Pvt. Ltd, 2010.
[8] Dumas, Laurent. “CFD-based optimization for automotive aerodynamics.” In Optimization and Computational Fluid Dynamics, by Laurent Dumas, 191-215. Springer Berlin Heidelberg, 2008.
[9] Fukuda, Hitoshi, Kazuo Yanagimoto, Hiroshi China, and Kunio Nakagawa. “Improvement of vehicle aerodynamics by wake control.” JSAE Review 16, no. 2 (1995): 151-55.
[10] Hsu, Yeh-Liang. “A review of structural shape optimization.” Computer in Industry 25, no. 1 (1994): 3-13.
[11] Hu, Xu-xia, and Eric T.T. Wong. “A Numerical Study On Rear-spoiler Of Passenger Vehicle.” World Academy of Science, Engineering and Technology 57 (2011): 636-641.
[12] Jambor, Arno, and Matthias Beyer. “New cars-new materials.” Materials & Design 18, no. 4-6 (1997): 203-209.
[13] Liu, Wei, and Yuying Yang. “Multi-objective optimization of an auto panel drawing die face design by mesh morphing.” Computer-Aided Design 39, no. 10 (2007): 863-869.
[14] Mathur, Ajay. “Passenger Vehicle Fuel Economy Standards and Labeling Program.” New Delhi: CSE conference on Clean and Sustainable Mobility for all: Agenda for Reforms, 2011.