
RESEARCH ARTICLE
Effects of acceleration on gait measures in three horse gaits
Sandra Nauwelaerts1,2,*, Lila Zarski2, Peter Aerts1,3and Hilary Clayton4ABSTRACT
Animals switch gaits according to locomotor speed. In terrestrial locomotion, gaits have been defined according to footfall patterns or differences in center of mass (COM) motion, which characterizes mechanisms that are more general and more predictive than footfall patterns. This has generated different variables designed primarily to evaluate steady-speed locomotion, which is easier to standardize in laboratory conditions. However, in the ecology of an animal, steady-state conditions are rare and the ability to accelerate, decelerate and turn is essential. Currently, there are no data available that have tested whether COM variables can be used in accelerative or decelerative conditions. This study used a data set of kinematics and kinetics of horses using three gaits (walk, trot, canter) to evaluate the effects of acceleration (both positive and negative) on commonly used gait descriptors. The goal was to identify variables that distinguish between gaits both at steady state and during acceleration/deceleration. These variables will either be unaffected by acceleration or affected by it in a predictable way. Congruity, phase shift and COM velocity angle did not distinguish between gaits when the dataset included trials in unsteady conditions. Work ( positive and negative) and energy recovery distinguished between gaits and showed a clear relationship with acceleration. Hodographs are interesting graphical representations to study COM mechanics, but they are descriptive rather than quantitative. Force angle, collision angle and collision fraction showed a U-shaped relationship with acceleration and seem promising tools for future research in unsteady conditions.
KEY WORDS: Biomechanics, Center of mass, Locomotion
INTRODUCTION
The existence of different gaits is a fascinating aspect of animal locomotion. Alexander (1989) defined gait as: ‘A pattern of locomotion characteristic of a limited range of speeds described by quantities of which one or more change discontinuously at transition to other gaits’. Animals switch gaits according to locomotor speed, as in the walk, trot, canter, gallop sequence in a horse. It is hypothesized that gaits evolved to optimize energy use (e.g. Hoyt and Taylor, 1981) or minimize stress at the level of the musculo-skeletal system (e.g. Farley and Taylor, 1991) and are the result of a neuromechanical interaction between basal neural control and the intrinsic mechanical properties of the movement apparatus (e.g. Latash, 2008; Nishikawa et al., 2007). However, in some cases, several gaits can be used at a particular speed, making speed a poor
indicator for gait (Fiers et al., 2013; Verstappen and Aerts, 2000). In terrestrial locomotion, either footfalls or center of mass (COM) motion has been used to define gaits, with the latter being usually more general and more predictive than the footfalls. Researchers have proposed different variables and methods designed primarily to evaluate steady-speed locomotion because it is most commonly used in lab conditions. However, in non-standardized, natural conditions, steady-state is rarely used and the ability to accelerate, decelerate and turn is essential (Huey and Hertz, 1984). While gaits are easy to distinguish on the basis of the sequence and timing of the footfalls, the footfalls themselves do not explain anything about the underlying biomechanics. Studying COM behavior might reveal more about the mechanics of locomotion. This paper is the first to evaluate multiple COM variables under non-steady conditions.
Gait variables
One of the approaches to gait classification is the quantification of the extent to which a gait can be considered walking (also referred to as a vaulting mechanism or inverted pendulum model; e.g. Cavagna et al., 1976) or running (also referred to as bouncing mechanism or spring-mass model; e.g. Blickhan, 1989). The out-of-phase patterns of the changes in kinetic and potential energy have been used to distinguish walking from running, in which the energy changes are in phase. A first series of variables (energy recovery, congruity, phase shift) focuses on the relationship between kinetic energy (KE) and potential energy (PE) of the COM. ‘Percentage recovery’ (Cavagna et al., 1977) quantifies how much energy exchange can potentially occur between KE and PE compared with a perfect pendulum in which the KE and PE profiles are exactly out of phase, have the same amplitude and have the same profile shape in order to get 100% energy recovery. A low percentage recovery is usually interpreted as pointing to a bouncing spring-mass mechanism of locomotion.‘Percentage congruity’(Ahn et al., 2004) focuses on one of three contributors to percentage recovery, namely the relative timing of the fluctuations in KE and PE. Percentage congruity is defined as the proportion of the cycle for which KE and PE change in the same direction, so the interpretation of the index is reversed compared with percentage recovery: the value is expected to approach 0% for a pendulum-based exchange such as walking and 100% for a spring-based exchange such as running. Percentage congruity does not take into account the relative magnitudes of the KE and PE fluctuations or the profiles of these fluctuations.‘Phase shift’ (Cavagna et al., 1983) is closely related to percentage congruity in that both focus on the time lag between KE and PE. However, phase shift quantifies one specific event within the stride while percentage congruity looks at the time difference between the two energy profiles throughout an entire stride. Phase shift quantifies the actual difference whereas percentage congruity only measures the percentage of the time that both energy profiles have the same direction. In that regard, phase shift is more closely related to percentage recovery but it does not take into account amplitude differences in the energy profiles. One problem with phase shift is that it is not standardized (Ahn et al., 2004; Cavagna et al., 1983; Received 29 August 2014; Accepted 7 March 2015
1
Functional Morphology Lab, Department of Biology, Antwerp University, Universiteitsplein 1, Wilrijk B-2610, Belgium.2Michigan State University, 736 Wilson Road, East Lansing, MI 48824, USA.3Department of Movement and Sport Sciences, University of Ghent, Campus HILO, Watersportlaan, Ghent B-9000, Belgium.4Sport Horse Science, LC, 3145 Sandhill Road, Mason, MI 48854, USA.
*Author for correspondence ([email protected])
The
Journal
of
Experimental
Farley and Ko, 1997; Full and Tu, 1991; Griffin et al., 1999; Parchman, 2003; Reilly et al., 2006).
A relatively new approach to studying locomotor mechanics looks at the collision-like events that redirect the COM velocity vector and which are thought to be energetically costly (Bertram and Hasaneini, 2013). Several variables can be used to quantify this event. The instantaneous collision angle (Lee et al., 2011, 2013) is the angle between the ground reaction force vector (‘force angle’) and the velocity vector of the COM (‘velocity angle’), shifted by
π/2. The shift makes the angle zero when the two vectors are perpendicular to each other and makes the angle larger when the collision increases. The ‘collision angle’ (one value per stride) is obtained by weighting the instantaneous collision angle by force and velocity, and averaging over an entire stride. Force angle and velocity angle are obtained per stride in a similar way.‘Collision fraction’aims to quantify collision reduction by calculating the ratio of the actual collision to the potential collision, with a smaller fraction representing more reduction, possibly resulting in smaller collisional losses.
Hodographs are a completely different approach to gait classification. Rather than expressing the stride as a single number, hodographs are COM vector maps: graphical representations of the magnitude and direction of the COM velocity vector. The resulting curve, called a‘hodograph’by Hamilton in 1846, has recently been applied to legged locomotion (Adamczyk and Kuo, 2009). Hodographs visualize the entire stride cycle and the shape of the trajectory reveals characteristics of the dynamics of the locomotor system. Footfalls can be indicated on the graph and collisional aspects of locomotion become apparent in sudden changes in the directionality of the hodograph.
Yet another way to quantify gaits is by the amount of work used in a stride. External work is calculated by summing the increments of the sum of PE and KE profiles of the COM. External work can be divided into net positive work and net negative work. Even though work is an indication of the non-steadiness of the COM during a certain gait rather than a pure metric of gait, we included it because the non-steadiness of a steady gait can potentially be used as an indirect metric. In addition, this information is complementary to the information provided by the hodographs, in which velocity profiles are plotted against each other.
Prediction for variables in acceleration and deceleration Acceleration and deceleration change the profile of the KE fluctuations, but may not change the PE fluctuations (Minetti et al., 2013), which has repercussions for most gait variables. A linear increase in COM velocity in the propulsive phase will attenuate an otherwise high percentage recovery because the sum of positive PE increments does not change but the sums of positive increments of both KE and total mechanical energy do change. In contrast, we expect that greater deceleration during the braking phase does not change the percentage recovery as it does not take the negative increments into account, even though the positive increment might be reduced during deceleration as well. In gaits with low recoveries that have KE and PE in phase, percentage recovery will probably remain similar in magnitude because the spring-mass mechanism (Blickhan, 1989) will not be affected by accelerative locomotion. Acceleration seems to merely change the amplitude of the KE peak during the propulsive phase, at least in accelerating humans (Segers et al., 2007). Unfortunately, data on the mechanical energy of the COM of accelerating animals are scarce. Assuming we can extrapolate data from accelerating walking and running humans, we expect that the timing of the energy profiles
and thus percentage congruity will not change during acceleration. This makes it a reasonable candidate to evaluate the pendulum/ spring potential contribution for both accelerative and steady-state sequences. The same reasoning applies to the phase shift; as acceleration and deceleration do not seem to change the timing of the PE and KE profiles, acceleration should not affect the outcome of percentage congruity.
Mauroy et al. (2013) calculated the angle between force and COM velocity vectors during the positive work phase for runners approaching an obstacle. This angle increased with speed during the accelerative bout, but it was lower than in steady-state running. This means the collision angle defined by Lee et al. (2011) would be increased compared with steady-state running. In deceleration, one might expect higher collisional losses to occur in order to dissipate energy to slow the COM, resulting in higher collision angles. During acceleration, it is likely that collision losses are avoided to the same extent as in steady state locomotion. Therefore, the prediction is that collision fraction will be higher in deceleration.
During steady-state running, apart from compensations for collisional losses, negative and positive work done on the COM should cancel out. During acceleration, a net propulsive impulse can be achieved either by reducing braking forces or by increasing accelerative forces – or both (Roberts and Scales, 2002). This means that when KE increases, there will be an increase in positive work, a decrease in negative work or a combination of the two. In deceleration, the reverse is expected. Both in turkeys (Roberts and Scales, 2002) and in humans (Van Caekenberghe et al., 2013; Hunter et al., 2005; Kugler and Janshen, 2010), a combination of both strategies was found during acceleration, making it difficult to predict the change in external work for a given acceleration.
To the best of our knowledge, hodographs during acceleration or deceleration have not been reported. We expected that during the propulsive phase of accelerating sequences, the vector will overshoot the steady-state forward velocity causing the hodograph to shift its trajectory to the right. The opposite can be predicted in deceleration, with the hodograph shifting to the left. Acceleration/ deceleration could also have more drastic effects, which would be apparent in shape changes of the trajectory.
Aims
In this paper, we examined three gaits using data from trials performed by miniature horses (Equus ferus caballusL.) in steady state, acceleration or deceleration to test predictions for this particular quadruped. The goal was to compare commonly used and newly emerging analytic gait variables on one data set. We aimed to evaluate which measures are more useful in both steady-state and non-steady conditions.
RESULTS
Percentage recovery
Significant differences in percentage recovery (Cavagna et al., 1977) were found between gaits (P=0.012), with significantly lower values in trot (19±1%) and walk (24±3%) compared with canter (54±2%). In walk, acceleration/deceleration did not affect percentage recovery (P=0.82). In trot, percentage recovery values were lower in acceleration and higher in deceleration (P=0.001); the regression lines decreased significantly with acceleration and simultaneously decreased significantly with velocity. In canter, percentage recovery values were higher in deceleration (P=0.025) and percentage recovery significantly decreased with acceleration but not with velocity. Walk trials showed high variability and values
The
Journal
of
Experimental
overlapped with both canter and trot. Canter and trot values were more consistent and did not overlap with each other (Fig. 1).
Percentage congruity
Percentage congruity (Ahn et al., 2004) was significantly smaller in canter (32±1%) compared with trot (55±1%) and walk (58±3%), with higher variability in the walk trials. There were no linear effects of acceleration within each gait, except when velocity was also taken into account. Percentage congruity increased rapidly with velocity during walking, and to a lesser degree in trotting. When velocity was included in the analysis, acceleration made a significant contribution to the predicted value of congruity in trot, suggesting an interaction effect. Percentage congruity was also found to be highly horse dependent (P=0.03).
Phase shift
Phase shift (Cavagna et al., 1983) did not distinguish between gaits and did not change with acceleration/deceleration. There were no effects of horse. Variability in each gait was very high.
Collision-based parameters Force angle
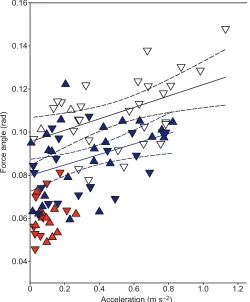
Differences between gaits were apparent in the force angle (Lee et al., 2011) (P=0.002, canterN=30, trotN=43, walkN=23), with smaller values (mean±s.d.) for walk (0.061±0.002 rad) than trot (0.088±0.002 rad), which had smaller values than canter (0.1091±0.003 rad). There were no differences between horses but there was an interaction effect between horse and gait. Because a
U-shaped profile is expected with acceleration, we added the absolute value of acceleration as a covariate in the analysis (Fig. 2). This gave a significant increase in force angle in both trot and canter trials, with velocity itself being significant in the trot trials.
Velocity angle
No differences were found in velocity angle (Lee et al., 2011) between the three gaits but there were strong horse effects. When using absolute values of acceleration and adding velocity to the statistical model, both variables were significant factors in the model in the canter trials, only velocity was significant in the trot trials and only absolute acceleration was significant in the walk trials.
Collision angle
The collision angle (Lee et al., 2011) differed between gaits: it was highest in trot (0.17±0.02 rad), lowest in walk (0.10±0.02 rad) and intermediate in canter (0.13±0.02 rad). When the absolute value of acceleration was tested as a covariate, it was found to be significant in all gaits (Fig. 3).
Collision fraction
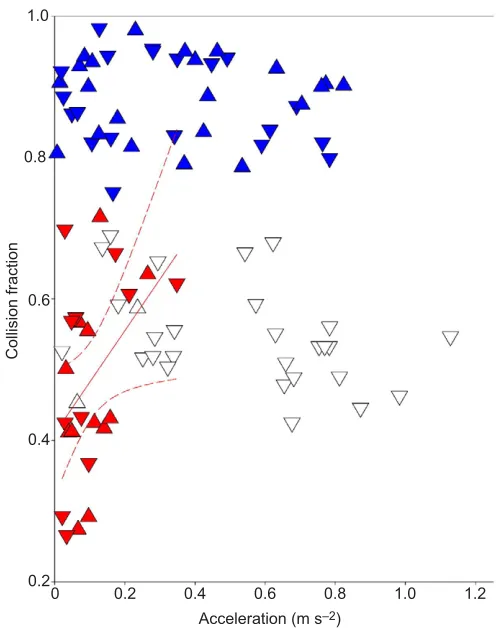
Collision fraction (Lee et al., 2011) differed between gaits and no individual effects were detected. Values were lowest in walk (0.49±0.03), highest in trot (0.88±0.01) and intermediate in canter (0.55±0.01), which was significantly different from both trot and
100
80
60
40
20
0
–1.0 –0.5 0 0.5 1.0
Acceleration (m s–2)
[image:3.612.315.565.351.653.2]% Recovery
Fig. 1. Percentage recovery plotted against acceleration for three gaits: walk (red), trot (blue) and canter (white).Two significant regression lines (solid lines; 95% confidence interval shown as dashed lines) are shown: blue for trot (y=−7.7x+19.2,R2=0.42) and black for canter (y=−17.4x+45.7,
R2=0.40).
0.16
0.14
0.12
0.10
0.08
0.06
0.04
0 0.2 0.4 0.6 0.8 1.0 1.2
Acceleration (m s–2)
Force angle (rad)
Fig. 2. Force angle plotted against the absolute values of acceleration for three gaits: walk (red), trot (blue) and canter (white).Absolute values are shown rather than negative and positive values because absolute values were used in the statistical model. Positive acceleration is indicated as a triangle pointing up, negative acceleration as a triangle pointing down. Two significant regression lines (solid lines; 95% confidence interval shown as dashed lines) are shown: blue for trot (y=0.024x+0.080,R2=0.16) and black for canter
(y=0.027x+0.096,R2=0.23).
The
Journal
of
Experimental
[image:3.612.55.295.374.686.2]walk (Fig. 4). There was an interaction effect between gait and horse. Using absolute values of acceleration as a covariate, acceleration became a significant factor in the walk trials, with fractions being higher in acceleration.
Hodographs
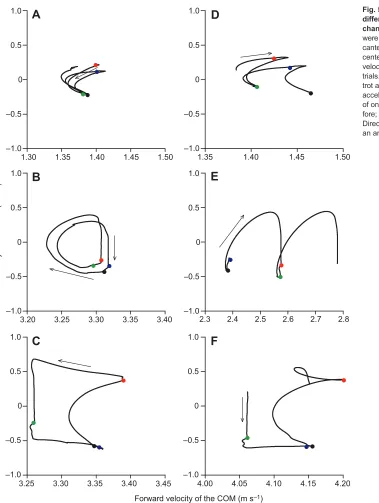
The walking hodograph (Lee et al., 2011) isC-shaped (Fig. 5). For each stride, this C is traced four times, with forelimb contacts occurring just prior to the highest vertical velocities and hindlimb contacts occurring prior to minimal vertical velocity. In acceleration/ deceleration, the increase/decrease in forward velocity occurs between hindlimb contact and forelimb contact.
The trotting hodograph describes a double, clockwise,
reversed-Dloop with mostly changes in the vertical direction (Fig. 5). The vertical portion of the curve represents the suspension phase where COM horizontal velocity remains constant while the ballistic vertical motion changes from moving upward to moving downward. In acceleration, the braking part of the loop remains the same but the propulsive part makes the loop overshoot in the horizontal direction, which shifts the vertically linear component of the trace to the right. The reverse happens in deceleration, with the loop crossing the vertically linear trace in order to shift to the left.
The hodograph during canter describes a counter-clockwise square (Fig. 5). After the suspension phase, which is the vertical part on the left of the hodograph, the dissociated hindlimb, the hindlimb
of the pair that does not move in unison with its diagonal forelimb, contacts the ground and propels the COM forward. The curved side represents the diagonal pair contacting the ground and increasing the vertical velocity of the COM similar to trot, while the decelerating part is due to the braking action of the dissociated forelimb.
Positive work
Positive work (Cavagna and Kaneko, 1977) was significantly different between gaits (P=0.01) and there was an interaction effect between gait and horse. Positive work was significantly higher in trot (0.90± 0.04 J kg−1m−1) than in walk (0.43±0.03 J kg−1m−1) or canter (0.47±0.02 J kg−1m−1). In trot and canter, there was a linear relationship between positive work and acceleration (P<0.001, slope=0.38±0.05, intercept=0.88± 0.02) if velocity and acceleration were tested in the model, with velocity being a significant second factor only in trot.
Negative work
Negative work (Cavagna and Kaneko, 1977) differed between gaits (P=0.001). No interaction effects or horse effects were found. Less negative work per kilogram and per meter was performed during walk (−0.45±0.05 J kg−1 m−1) compared with trot (−0.81±0.04 J kg−1m−1) and canter (−0.92±0.06 J kg−1m−1). More negative work was performed during positive acceleration 0 0.2 0.4 0.6 0.8 1.0 1.2
0.04 0.06 0.10
0.08 0.12 0.14 0.16 0.18 0.20 0.22
Acceleration (m s–2)
[image:4.612.52.294.54.371.2]Collision angle (rad)
Fig. 3. Collision angle plotted against the absolute values of acceleration for three gaits: walk (red), trot (blue) and canter (white).Absolute values are shown rather than negative and positive values because absolute values were used in the statistical model. Positive acceleration is indicated as a triangle pointing up, negative acceleration as a triangle pointing down. Three significant regression lines (solid lines; 95% confidence interval shown as dashed lines) are shown: red for walk (y=0.089x+0.09,R2=0.16) blue for trot (y=0.038x+0.16,R2=0.23) and black for canter (y=0.030x+0.12,R2=0.15).
0 0.2 0.4 0.6 0.8 1.0 1.2 1.0
0.8
0.6
0.4
0.2
Acceleration (m s–2)
[image:4.612.312.560.55.370.2]Collision fraction
Fig. 4. Collision fraction plotted against the absolute values of acceleration for three gaits: walk (red), trot (blue) and canter (white). Absolute values are shown rather than negative and positive values because absolute values were used in the statistical model. Positive acceleration is indicated as a triangle pointing up, negative acceleration as a triangle pointing down. The regression line (solid line; 95% confidence interval shown as dashed lines) for walk, in red, had a significant slope (y=0.73x+0.41,
R2 =0.19).
The
Journal
of
Experimental
(−0.86±0.04 J kg−1m−1) compared with steady state (−0.53± 0.08 J kg−1m−1) and deceleration (−0.57±0.05 J kg−1 m−1). The slope of the linear relationship between negative work and acceleration was similar for trot (slope=0.51±0.04; intercept= 0.84±0.01) and canter (slope=0.62±0.13; intercept=−0.61±0.08). In trotting, velocity had an additional significant effect on negative work.
DISCUSSION
Most of the gait parameters used in the literature were developed with steady-speed conditions in mind. Applying them to unsteady trials can have somewhat unexpected results. Percentage congruity, phase shift and velocity angle were not able to distinguish between gaits. Of the variables that showed a change with acceleration, some showed a clear pattern with acceleration without having to take
velocity into account as well ( percentage recovery, force angle, collision angle and collision fraction).
Percentage recovery increased during deceleration, which was not predicted theoretically. The assumption that potential energy fluctuations do not change in deceleration was met but, contrary to theoretical calculations, deceleration did not occur entirely within the braking phase. Instead, the propulsive phase was much less pronounced, making the positive kinetic energy increments much smaller during deceleration. Compared with the study of Minetti et al. (1999), our values of energy recovery are rather low for walk but are higher for trot and canter. Because we calculated recovery in the same way, we suggest the smaller animals used in our study have slightly different values for each gait and the fact that they walked at relatively high speed for their size would explain the low percentage recovery values for walk reported here. In dogs, lower values also
A
B
C
D
E
F
V
e
rtical velocity of the COM (m s
–1
)
1.0
0.5
0
–0.5
–1.0
1.0
0.5
0
–0.5
–1.0
1.0
0.5
0
–0.5
–1.0
1.0
0.5
0
–0.5
–1.0 1.0
0.5
0
–0.5
–1.0 1.0
0.5
0
–0.5
–1.0
1.30 1.35 1.40 1.45 1.50 1.35 1.40 1.45 1.50
3.20 3.25 3.30 3.35 3.40
3.25 3.30 3.35 3.40 3.45
2.3 2.4 2.5 2.6 2.7 2.8
4.00 4.05 4.10 4.15 4.20
[image:5.612.57.436.52.555.2]Forward velocity of the COM (m s–1)
Fig. 5. Hodographs reveal shape differences between gaits and predictable changes with acceleration.Hodographs were drawn for walk (A,D), trot (B,E) and canter (C,F) by plotting forward velocity of the center of mass (COM) against vertical velocity of the COM using data from example trials. The hodographs are shown for walk, trot and canter in steady state in A–C and in acceleration in D–F. Circles indicate contact of one of the limbs (red, right fore; blue, left fore; black, right hind; green, left hind). Direction of the hodograph is indicated with an arrow.
The
Journal
of
Experimental
have been found at both low and high speeds (Griffin et al., 2004). At high walking speeds, ground reaction force profiles tend to shift from a double-humped profile towards a more trot-like bell-shaped curve (Weishaupt et al., 2010). Indeed, the values reported in this study are so low that they are comparable to those for trot trials. As we didn’t observe high percentage recovery values, we could not test the prediction that values would be lower in acceleration for high percentage recovery values. During trotting, percentage recovery values were low because the timing of the energies was in phase; they differ from zero because of the difference in amplitude between potential and kinetic energy.
Phase shift was not a good candidate for predicting the gait. Even though it did not change with acceleration regime, the data within each gait were so variable that phase shift became a poor predictor for gait itself because in trot and walk there were four maxima of similar magnitude in each stride. Selecting a maximum based on magnitude gave each peak an equal chance of being chosen, which created high variability in the results. The results clearly show four groups within the data depending on which peak was maximal during the entire stride. Strict implementation of Cavagna’s method (Cavagna et al., 1983) or any method that selects one instantaneous event in the stride is difficult to use consistently on experimental data. One solution is to choose a particular peak in the energy profile but that requiresa
prioriknowledge of the shape of the energy profile and the choice of which peak to use might bias the data. Percentage congruity, which is calculated over the entire stride, should not face the same problems, but this variable was not able to distinguish between gaits, perhaps because of the more complex pattern of the energy profiles coming from experimental data rather than theoretical sinusoidal profiles.
Force angles, collision angles and collision fractions differed significantly between gaits. Even though the effects of acceleration on the two angles were small (changes in angle were between 8 and 11 deg), they showed a consistentU-shaped pattern with acceleration without having to account for the additional effects of velocity. The consistency in the small changes and in the shapes of the profiles within the gait (supplementary material Figs 1–3) means these two variables show promise for use in locomotor studies that include accelerative effects, both as mean values over a stride or as the instantaneous profiles. Collision fractions remain constant within a gait, except for during walks. Comparing the shape profiles of our data with that presented by Lee et al. (2011), the resemblance between the patterns of a dog and a horse are striking. As the patterns are clearly different between the gaits and the interspecific differences are small–even when comparing digitigrade species with unguligrade ones–the shape of the collision angle profiles could potentially be used as a categorizing tool.
Hodographs are useful for graphical representation and interpretation of the mechanisms moving the COM because they indicate both the effect of collisions and the action of individual limbs on the COM. Even though each gait seems to exhibit a highly unique pattern and effects of acceleration and deceleration are visually apparent and interpretable, a strong element of visual interpretation is involved, making hodographs more difficult to use quantitatively for categorizing gaits.
Both positive and negative work were good indicators for gait but the effect of acceleration was complicated because of the need to add velocity to the statistical model in order to find acceleration effects. As opposed to other variables that are dimensionless, work is expressed in joules. Even when size was accounted for by expressing work in J kg−1, the dimensionality of the variable might be problematic when comparing across size and species. In human walking, the calculation of the COM work has been shown to underestimate the total work done by both limbs by 33% (Donelan et al., 2002). It is highly likely that using the individual limb method in horses will demonstrate a similar underestimation of the total work done by all limbs. This correction factor will probably be different for each gait as the gaits differ in the number of limbs working simultaneously.
In this study, 96 trials were used, consisting of 23 walks, 43 trots and 30 canters. The trotting data represented a continuous acceleration range between−0.8 and +0.8 m s−2. For walking, it was difficult to obtain a large range of accelerative trials because the miniature horses would transition to trots in acceleration. In the canters, we obtained many trials in deceleration and at steady state but accelerative trials were limited because the handlers could not keep up with the high speeds reached by the miniature horses. The composition of the data could explain, in part, why certain patterns were not observed within walk but could be found in trot. The fact that walk trials contained a lot more variability in the measures compared with trot or canter trials contributed to the inability of some measures to distinguish between gaits.
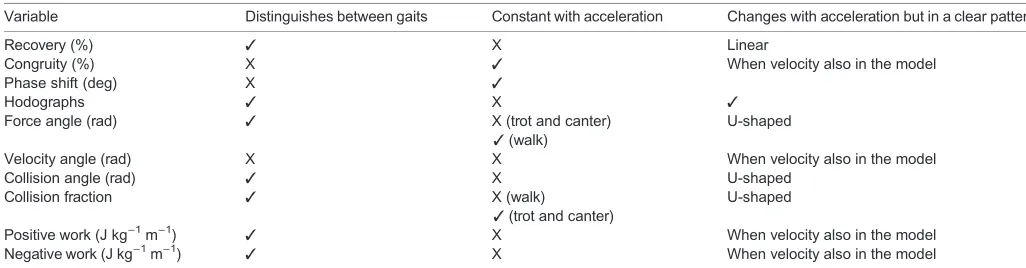
In conclusion, percentage recovery, force angle, collision angle and collision fraction look promising as metrics for studies investigating the mechanics of locomotion in both steady and unsteady conditions when one value per stride is desired (Table 1). We also recommend visualizing hodographs, and collision and force angle profiles for a better understanding of the underlying mechanics of gait.
MATERIALS AND METHODS Experiment
[image:6.612.46.559.584.718.2]Thirty-four reflective 6 mm markers were attached to the skin of five miniature horses (mass: 116±38 kg; mean±s.d.) over anatomical landmarks (Nauwelaerts et al., 2013). Positions of all markers were
Table 1. Summary of the criteria necessary for a good gait indicator in unsteady locomotion
Variable Distinguishes between gaits Constant with acceleration Changes with acceleration but in a clear pattern
Recovery (%) ✓ X Linear
Congruity (%) X ✓ When velocity also in the model
Phase shift (deg) X ✓
Hodographs ✓ X ✓
Force angle (rad) ✓ X (trot and canter)
✓(walk)
U-shaped
Velocity angle (rad) X X When velocity also in the model
Collision angle (rad) ✓ X U-shaped
Collision fraction ✓ X (walk)
✓(trot and canter)
U-shaped
Positive work (J kg−1m−1) ✓ X When velocity also in the model
Negative work (J kg−1m−1) ✓ X When velocity also in the model
A good gait indicator needs to distinguish between gaits (column 2) and either be constant with acceleration (column 3) or have a clear relationship with
acceleration (column 4).
The
Journal
of
Experimental
tracked using 10 Eagle infrared cameras (Motion Analysis Corp., Santa Rosa, CA, USA) recording at 120 Hz. The floor of the capture volume was instrumented with four Bertec force plates (Bertec Corporation, Columbus, OH, USA). The horses were trained to keep up with a runner who led the horses through the volume holding a loose rope. A total of 96 trials divided over three gaits (walk,N=23; trot,N=43; and canter,N=30) were analyzed.
Trials were visually categorized into specific gaits based on footfall patterns. Walk is a four-beat gait with each limb moving separately, trot is a two-beat gait in which diagonal limb pairs move simultaneously and pairs alternate, and canter is a three-beat gait in which one diagonal pair moves synchronously while the other pair is dissociated.
Calculations
Initial COM position was calculated using the mass distribution and position of segmental COMs based on anatomical data (Buchner et al., 1997; Nauwelaerts et al., 2011; van den Bogert, 1989). Initial COM velocities and accelerations were obtained from numerical differentiation of the positional data in the vertical and forward directions. These initial data were used as input to calculate velocities and accelerations from ground reaction forces. Kinetic energy (KE=½mv2) and potential energy
(PE=mgh) were calculated based on optimized body mass (m), velocity (v) and height (h) and the gravitational acceleration (g). Data were separated into strides based on the start of contact of the right forelimb. Stride velocity and acceleration, respectively, were calculated as the means of the forward velocity and acceleration over one stride. The measured variables were percentage recovery, percentage congruity, phase shift, collision variables, negative work, positive work and hodograph analysis.
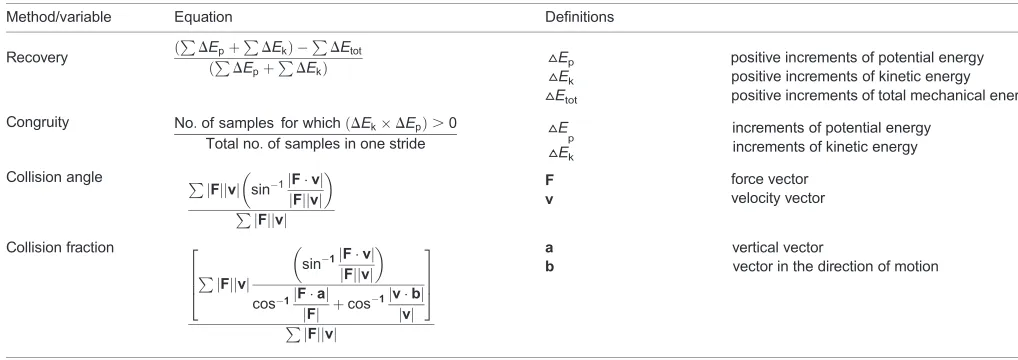
Percentage recovery was calculated as the difference between the sum of the positive increments in potential and kinetic energy and the positive increments in total mechanical energy divided by the sum of the positive increments in potential and kinetic energy (Table 2).
Percentage congruity was calculated as the sum of the portions of the cycle during which kinetic and potential energies are congruent (Ahn et al., 2004). The two energies were considered congruent if the product of their instantaneous rate of change of energy (time derivatives of kinetic and potential energy over an entire stride) had a positive sign (Table 2).
We calculated the phase shift as the time difference between maximal kinetic energy and minimal potential energy (Cavagna et al., 1983; Griffin et al., 1999) per stride.
The instantaneous collision angle (Lee et al., 2011, 2013) was calculated as the angle between the ground reaction force vector and the velocity vector of the COM, shifted by π/2. The overall collision angle (one value) is obtained by weighting the collision angle by force and velocity and averaging over an entire stride (Table 2). Overall values were also obtained for force angle and velocity angle in a similar manner. Collision fractions were calculated for each stride (Table 2).
External work was calculated by summing the increments of the sum of potential and kinetic energy profiles of the COM. External work was divided into positive and negative work by summing the positive and negative increments separately.
Hodographs were created by plotting the forward velocity on theX-axis and the vertical velocity on theY-axis, creating a trajectory of the terminal point of the velocity vector with the origin of the graph at the origin of the velocity vector.
Velocity was calculated as the mean forward velocity of the COM over an entire stride; acceleration was calculated as the mean forward acceleration of the COM over an entire stride.
Statistics
Univariate ANOVA were performed with horse as a random effect and gait as a fixed effect. Within each gait, univariate tests were used to test for effects of acceleration regime. Scheffepost hoctests were performed after finding significant effects. When expecting aV-shaped relationship between acceleration and a variable, absolute values of acceleration were used as a covariate in the univariate tests. When expecting a linear relationship and an additional effect of velocity, acceleration and velocity were tested as covariates simultaneously.
Acknowledgements
The authors would like to thank Sheila Boyer, Alexia Heney, and Dan and Bess Ohlgren-Miller, the owners of the horses for allowing their horses to participate in this study. Emily Compton, Nathalie Cousin, Kelly Smith, Rachel Wright, Jasmine Lane, Rachel Buchholz, Katherine O’Connor, Andrea Lawrence, Whitney Allen, Megan Schra and Erin Tans helped with the experiments and the analysis. This paper was greatly improved with the help of two anonymous referees.
Competing interests
The authors declare no competing or financial interests.
Author contributions
S.N. and P.A. developed the concept and designed experiments. H.C. organized the data collection, advised on the setup and gave technical support. S.N., L.Z. and H.C. performed the experiments. S.N. and L.Z. conducted the analysis. S.N. wrote the manuscript and received feedback from H.C. and P.A. on the analysis and writing.
Funding
This study was funded by the McPhail endowment and a postdoctoral research grant and a travel grant from the Flemish Science Foundation FWO-Flanders, both to S.N. and a FWO-Flanders project grant G.0183.09N and a grant from the European Community’s Seventh Framework Program FP7/2007–2013–Future Emerging Technologies, Embodied Intelligence, under grant agreement no. 231688, both to P.A.
Supplementary material
Supplementary material available online at
[image:7.612.45.554.68.248.2]http://jeb.biologists.org/lookup/suppl/doi:10.1242/jeb.113225/-/DC1 Table 2. Equations used to calculate some of the variables discussed here
Method/variable Equation Definitions
Recovery ð
PDE
pþPDEkÞ PDEtot ðPDEpþ
P
DEkÞ ▵
Ep ▵Ek ▵Etot
positive increments of potential energy positive increments of kinetic energy positive increments of total mechanical energy
Congruity No:of samples for whichðDEkDEpÞ.0
Total no:of samples in one stride ▵
E
p ▵Ek
increments of potential energy increments of kinetic energy
Collision angle P
jFjjvj sin1jFvj jFjjvj
P jFjjvj
F v
force vector velocity vector
Collision fraction
P jFjjvj
sin1jFvj jFjjvj
cos1jFaj
jFj þcos
1jvbj
jvj 2
6 6 4
3 7 7 5
Pj Fjjvj
a b
vertical vector
vector in the direction of motion
The
Journal
of
Experimental
References
Adamczyk, P. G. and Kuo, A. D.(2009). Redirection of center-of-mass velocity during the step-to-step transition of human walking.J. Exp. Biol.212, 2668-2678. Ahn, A. N., Furrow, E. and Biewener, A. A.(2004). Walking and running in the
red-legged running frog, Kassina maculata.J. Exp. Biol.207, 399-410.
Alexander, R. M.(1989). Optimization and gaits in the locomotion of vertebrates.
Physiol. Rev.69, 1199-1227.
Bertram, J. E. A. and Hasaneini, S. J.(2013). Neglected losses and key costs: tracking the energetics of walking and running.J. Exp. Biol.216, 933-938. Blickhan, R.(1989). The spring-mass model for running and hopping.J. Biomech.
22, 1217-1227.
Buchner, H. H. F., Savelberg, H. H. C. M., Schamhardt, H. C. and Barneveld, A. (1997). Inertial properties of Dutch Warmblood horses.J. Biomech.30, 653-658. Cavagna, G. and Kaneko, M.(1977). Mechanical work and efficiency in level
walking and running.J. Physiol.268, 467-481.
Cavagna, G. A., Thys, H. and Zamboni, A.(1976). The sources of external work in level walking and running.J. Physiol.262, 639-657.
Cavagna, G. A., Heglund, N. C. and Taylor, C. R.(1977). Mechanical work in terrestrial locomotion- 2 basic mechanisms for minimizing energy-expenditure.
Am. J. Physiol.233, R243-R261.
Cavagna, G. A., Franzetti, P. and Fuchimoto, T.(1983). The mechanics of walking in children.J. Physiol.343, 323-339.
Donelan, J., Kram, R. and Kuo, A.(2002). Mechanical work for step-to-step transitions is a major determinant of the metabolic cost of human walking.J. Exp. Biol.205, 3117-3727.
Farley, C. T. and Ko, T. C.(1997). Mechanics of locomotion in lizards.J. Exp. Biol.
200, 2177-2188.
Farley, C. T. and Taylor, C. R.(1991). A mechanical trigger for the trot-gallop transition in horses.Science253, 306-308.
Fiers, P., De Clercq, D., Segers, V. and Aerts, P.(2013). Biomechanics of human bipedal gallop: asymmetry dictates leg function.J. Exp. Biol.216, 1338-1349. Full, R. J. and Tu, M. S.(1991). Mechanics of a rapid running insect: two-, four- and
six-legged locomotion.J. Exp. Biol.156, 215-231.
Griffin, T. M., Tolani, N. A. and Kram, R.(1999). Walking in simulated reduced gravity: mechanical energy fluctuations and exchange. J. Appl. Physiol. 86, 383-390.
Griffin, T. M., Main, R. P. and Farley, C. T.(2004). Biomechanics of quadrupedal walking: how do four-legged animals achieve inverted pendulum-like movements?J. Exp. Biol.207, 3545-2558.
Hoyt, D. F. and Taylor, C. R.(1981). Gait and the energetics of locomotion in horses.Nature292, 239-240.
Huey, R. B. and Hertz, P. E.(1984). Is a Jack-of-All-Temperatures a master of none?Evolution (N. Y.)38, 441.
Hunter, J. P., Marshall, R. N. and McNair, P. J.(2005). Relationships between ground reaction force impulse and kinematics of sprint-running acceleration.
J. Appl. Biomech.21, 31-43.
Kugler, F. and Janshen, L.(2010). Body position determines propulsive forces in accelerated running.J. Biomech.43, 343-348.
Latash, M. L.(2008).Neurophysiological Basis of Movement, 2nd edn. Champaign, IL: Human Kinetics Publishers Inc.
Lee, D. V., Bertram, J. E. A., Anttonen, J. T., Ros, I. G., Harris, S. L. and Biewener, A. A.(2011). A collisional perspective on quadrupedal gait dynamics.
J. R. Soc. Interface8, 1480-1486.
Lee, D. V., Comanescu, T. N., Butcher, M. T. and Bertram, J. E. A.(2013). A comparative collision-based analysis of human gait.Proc. R. Soc. B Biol. Sci.280, 20131779-20131779.
Mauroy, G., Schepens, B. and Willems, P. A.(2013). The mechanics of running while approaching and jumping over an obstacle.Eur. J. Appl. Physiol.113, 1043-1057.
Minetti, A. E., Ardigo, L. P., Reinach, E. and Saibene, F.(1999). The relationship between mechanical work and energy expenditure of locomotion in horses.
J. Exp. Biol.202, 2329-2338.
Minetti, A. E., Gaudino, P., Seminati, E. and Cazzola, D.(2013). The cost of transport of human running is not affected, as in walking, by wide acceleration/ deceleration cycles.J. Appl. Physiol.114, 498-503.
Nauwelaerts, S., Allen, W. A., Lane, J. M. and Clayton, H. M.(2011). Inertial properties of equine limb segments.J. Anat.218, 500-509.
Nauwelaerts, S., Aerts, P. and Clayton, H. (2013). Spatio-temporal gait characteristics during transitions from trot to canter in horses.Zoology 116, 197-204.
Nishikawa, K., Biewener, A. A., Aerts, P., Ahn, A. N., Chiel, H. J., Daley, M. A., Daniel, T. L., Full, R. J., Hale, M. E., Hedrick, T. L. et al. (2007). Neuromechanics: an integrative approach for understanding motor control.
Integr. Comp. Biol.47, 16-54.
Parchman, A. J.(2003). Whole-body mechanics and gaits in the gray short-tailed opossum Monodelphis domestica: integrating patterns of locomotion in a semi-erect mammal.J. Exp. Biol.206, 1379-1388.
Reilly, S. M., McElroy, E. J., Andrew Odum, R. and Hornyak, V. A.(2006). Tuataras and salamanders show that walking and running mechanics are ancient features of tetrapod locomotion.Proc. Biol. Sci. B Biol. Sci273, 1563-1568. Roberts, T. J. and Scales, J. A.(2002). Mechanical power output during running
accelerations in wild turkeys.J. Exp. Biol.205, 1485-1494.
Segers, V., Aerts, P., Lenoir, M. and De Clerq, D.(2007). Dynamics of the body centre of mass during actual acceleration across transition speed.J. Exp. Biol.
210, 578-585.
Van Caekenberghe, I., Segers, V., Aerts, P., Willems, P. and De Clercq, D. (2013). Joint kinematics and kinetics of overground accelerated running versus running on an accelerated treadmill.J. R. Soc. Interface10, 20130222. Van den Bogert, A. J.(1989). Computer simulation of locomotion in the horse. PhD
thesis, Utrecht University, pp. 68-89.
Verstappen, M. and Aerts, P.(2000). Terrestrial locomotion in the black-billed magpie. I. Spatio-temporal gait characteristics.Motor Control4, 150.
Weishaupt, M. A., Hogg, H. P., Auer, J. A. and Wiestner, T.(2010). Velocity-dependent changes of time, force and spatial parameters in Warmblood horses walking and trotting on a treadmill.Equine Vet. J.42, 530-537.
![catena Poly[bis[aquacopper(I) μ 4,4′ bipyridine κ2N:N′] terephthalate dihydrate]](data:image/gif;base64,R0lGODlhAQABAIAAAP///wAAACH5BAEAAAAALAAAAAABAAEAAAICRAEAOw==)