RESEARCH ARTICLE
Daily temperature extremes play an important role in predicting
thermal effects
Gang Ma1, Ary A. Hoffmann2and Chun-Sen Ma1,*
ABSTRACT
Organisms in natural environments experience diel temperature fluctuations, including sporadic extreme conditions, rather than constant temperatures. Studies based mainly on model organisms have tended to focus on responses to average temperatures or short-term heat stress, which overlooks the potential impact of daily fluctuations, including stressful daytime periods and milder night-time periods. Here, we focus on daily maximum temperatures, while holding night-time temperatures constant, to specifically investigate the effects of high temperature on demographic parameters and fitness in the English grain aphidSitobion avenae. We then compared the observed effects of different daily maximum temperatures with predictions from constant temperature–performance expectations. Moderate daily maximum temperatures depressed aphid performance while extreme conditions had dramatic effects, even when mean temperatures were below the critical maximum. Predictions based on daily average temperature underestimated negative effects of temperature on performance by ignoring daily maximum temperature, while predictions based on daytime maximum temperatures overestimated detrimental impacts by ignoring recovery under mild night-time temperatures. Our findings suggest that daily maximum temperature will play an important role in regulating natural population dynamics and should be considered in predictions. These findings have implications for natural population dynamics, particularly when considering the expected increase in extreme temperature events under climate change.
KEY WORDS: Average temperature, Climate change, Life history trait, Mild temperature, Model prediction, Temperature extreme
INTRODUCTION
Climate change is expected to increase temperature variability and lead to a substantial increase in temperature extremes such as the daily maximum temperature (Tmax) (Easterling et al., 1997; IPCC, 2013). While average temperatures in temperate regions are rarely expected to exceed optimum temperatures for many organisms (Deutsch et al., 2008),Tmaxon summer days is often predicted to surpass critical thermal maxima (Kearney et al., 2009; Bale and Hayward, 2010), resulting in stressful conditions for many mid-latitude ectotherms (Hoffmann et al., 2013; Zhang et al., 2013; Vasseur et al., 2014). Even small increases in maximum temperature may impact organism phenology (Semenov, 2009), species
distribution (Overgaard et al., 2014), population dynamics (Welbergen et al., 2008) and community structure (Ma et al., 2015). However, previous studies often model or predict effects on the distribution and population growth of organisms based on changes in average temperature (Cannon, 1998; Parmesan and Yohe, 2003; Rall et al., 2010; Vucic-Pestic et al., 2011) rather than Tmax(Easterling et al., 2000; Smith, 2011; Reyer et al., 2013).
Organisms in many natural terrestrial environments experience diel temperature fluctuations rather than constant temperatures (Colinet et al., 2015), including sporadic extreme conditions involvingTmax. Responses to constant conditions with no temperature fluctuations have been found to overestimate organisms’optimal temperature, thermal safety margins and temperature-dependent fitness in both animals and plants (Clusella-Trullas et al., 2011; Paaijmans et al., 2013; Reyer et al., 2013), by overlooking the negative impact ofTmax. When natural temperature variation is simulated, Tmax is often deliberately avoided to minimize mortality (Bradshaw et al., 2004; Whitney-Johnson et al., 2005; Warren and Anderson, 2013; Jeffs and Leather, 2014). Temperature fluctuations that vary in amplitude to approximate extremes in nature depress fitness components such as development, survival and fecundity (Ragland and Kingsolver, 2008; Paaijmans et al., 2010; Carrington et al., 2013; Xing et al., 2014), pointing to adverse effects of Tmax on organism performance. However, predictions based on short periods of high-temperature stress may neglect the effect of mild night-time temperatures (Carter et al., 1982; Zhou et al., 1989; Triltsch et al., 1998), which allow organisms sufficient time to recover during intervals of successive episodes of thermal stress (Davis et al., 2006; Sentis et al., 2013). Regimes used in previous studies on temperature fluctuations (reviewed by Colinet et al., 2015) tend to focus on the amplitude of fluctuating conditions and confound changes inTmaxwith different daily minima, which also affect performance (Zhao et al., 2014). This makes it difficult to isolate the specific effects of changes inTmax.
Aphids are important pests widely distributed in temperate areas (van Emden and Harrington, 2007). They have rapid rates of heat transfer and short life cycles and thus are highly vulnerable to variation in temperature (Brown et al., 2004; Danks, 2006; Angilletta, 2009). In this study, we used the English grain aphid Sitobion avenae(Fabricius 1775), as a model species. This aphid is one of the most important agricultural pests, not only in European countries, but also in China and the United States where average temperatures can be high and hot events occur frequently during the growing season. For instance, during mid June in 2013 near Beijing (40°N), a typical temperate region in China, changes inTmax(31– 41°C) were nearly twice as variable as daily average temperatures (Tav, 22–27°C) and there were seven consecutive days with Tmax exceeding 30°C (Fig. 1A,B). Since these aphids mostly select microhabitats around plant spikelets, which are directly exposed to sunlight, the aphids may face extremeTmax.
Here, we used a modified life-table experiment to test how different Tmax affect demographic parameters and fitness of the
Received 11 March 2015; Accepted 13 May 2015 1
Climate Change Biology Research Group, State Key Laboratory for Biology of Plant Diseases and Insect Pests, Institute of Plant Protection, Chinese Academy of Agricultural Sciences, No 2, Yuanmingyuan West Road, Haidian District, Beijing
100193, China.2Departments of Zoology and Genetics, Bio21 Institute,
The University of Melbourne, Victoria 3010, Australia.
*Author for correspondence (machunsen@caas.cn)
The
Journal
of
Experimental
aphids. Life history data collected under different constant temperatures are available for building constant temperature– performance models, which can be compared with the observed effects of differentTmaxvalues. By manipulatingTmaxand fixing the same night-time temperatures to a mild constant value, our study aims to limit possible confounding effects of thermal changes not involvingTmax(c.f. Flynn et al., 2006; Folguera et al., 2009; Gillespie et al., 2012; Bannerman and Roitberg, 2014). Since organism responses to climate change can vary across life history traits (Radchuk et al., 2013; Ma et al., 2015), we tested multiple demographic parameters including development, survival, fecundity and adult longevity, and used the intrinsic rate of increase (rm) as an overall fitness measure. Thus, the present study helps to indicate how changes inTmaxaffect organism performance, along with implications for predicting the impact of climate change. We focus in particular on the following questions: (1) DoesTmax depress aphid performance when the means are below the critical maximum mean temperatures? (2) To what extent do differentTmax values affect aphid performance in contrast to corresponding constant temperatures? (3) How do these findings translate into population predictions and what are the implications for climate change studies?
RESULTS Development
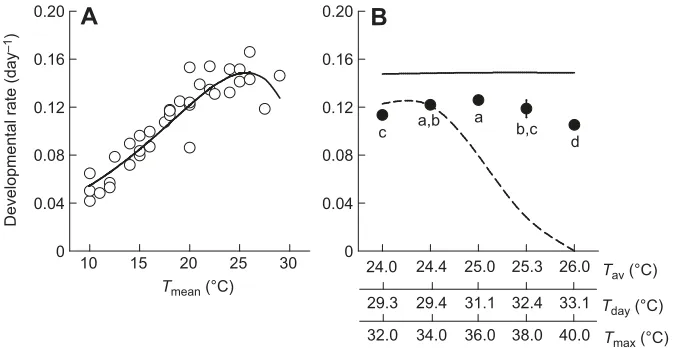
The developmental rate of nymphs at constant temperature estimated from the literature (Dean, 1974; Lykouressis, 1985; Li, 1990; Liu and Li, 1990; Sengonca et al., 1994; Yin et al., 2003) provided a good fit to the Lactin model (Lactin et al., 1995) (Fig. 2A, solid line;Dr=e0.137T−e(4.514−(32.947−T)/7.267),R2=0.864). Based on this model, nymphal developmental rate was expected to be stable with temperature in our experiment when dailyTavwere
considered, whereas these values were predicted to decrease dramatically when daylight temperatures (Tday) were considered (Fig. 2B). However, our data show that the nymphal developmental rate varied significantly (F4,25=16.83,P<0.0001) and increased first and then decreased as the daily Tmax increased, with the values varying between 0.105 and 0.126 (Fig. 2B). In general, the observed values were higher than model predictions based onTday, whereas they were lower than model predictions based onTav.
Survival
Nymphal survival under constant temperatures (Dean, 1974; Lykouressis, 1985; Acreman and Dixon, 1989; Li, 1990; Asin and Pons, 2001; Yin et al., 2003) fitted a nonlinear model [Fig. 3A, solid line; survival=1−T/(316.118−0.314T2),R2=0.888]. Based on this relationship, nymphal survival is high across a range of different Tavbefore dropping abruptly, whereas these values differ sharply from those observed under the range ofTdaytested (Fig. 3B). Our observed data also shows that Tmax over 36°C dramatically decreased survival (Fig. 3B;χ2=63.51, d.f.=4,P<0.0001).
Longevity
The best-fit equation for adult longevity at constant temperatures (Dean, 1974; Li, 1990; Sengonca et al., 1994; Zhang, 1994) was linear (Fig. 4A, solid line; longevity=33.342−0.932T,R2=0.651). Our observed longevity under various regimes with differentTmax varied (F4,25=2.91,P=0.0461) and was lower than model prediction under equivalent Tav, whereas the values were higher than the prediction underTday(Fig. 4B).
Fecundity
The best-fit equation for adult fecundity under constant temperatures (Dean, 1974; Lykouressis, 1984; Acreman and Dixon, 1989; Li,
A
0 10 15 20 25 30 35 40 45
24 48 72 96 120 144 168
C
Time (h) Time (h)
0 18 24
T
e
mperature (°C)
20 25 30 35 40
45
D
Day
1 2 3
32°C 34°C
36°C
38°C
40°C
Day
11 13 15 17 19
Tmax Tday Tav
B
[image:2.612.48.365.54.370.2]12 6
Fig. 1. Temperature fluctuation records in nature and temperature regimens used in the experiment. (A) Daily temperature fluctuations for 168 h, i.e. seven consecutive days from 12 to 18 June in 2013 in Beijing. (B) Variation in daily maximum temperatures (Tmax),
daylight temperatures (Tday) from 08:00 h to 16:00 h and
daily average temperatures (Tav) from 12 to 18 June.
(C) Temperature regimes designed for generating various daily maximum temperatures (32, 34, 36, 38 or 40°C, respectively) with the same daily low temperature (gray line). (D) Observed temperatures for three consecutive days during the experiment.
The
Journal
of
Experimental
1990; Asin and Pons, 2001) involved a second-order polynomial model (Fig. 5A, solid line; fecundity=−73.586+12.974T−0.353T2,
R2=0.821). Fecundity under both constant and daily high temperatures (Fig. 5B) varied in a similar way to longevity (cf. Fig. 4B). Observed fecundity values under various regimes with differentTmaxvaried (F4,29=12.97,P<0.0001) and were lower than predictions based onTav, whereas they were higher than predictions based onTday(Fig. 5B).
Population growth (rm)
Similar to fecundity, intrinsic rate of increase (rm) under constant temperatures (Li, 1990; Asin and Pons, 2001) also fitted a second-order polynomial model (Fig. 6A, solid line;rm=−1.1884+0.1399T− 0.0033T2, R2=0.908). Based on this model, r
m was expected to decrease slowly with temperature in our experiment whenTavwere considered, whereas it was predicted to decrease dramatically when Tday were considered (Fig. 6B). However, the observed rm was unchanged until Tmax reached 36°C, after which rm decreased quickly (Fig. 6B;F4,24=51.93,P<0.0001). Overall, thermvalues observed were higher than the model prediction based on Tday, whereas they were lower than the prediction based onTav.
DISCUSSION
Organisms in natural conditions experience temperature fluctuations involving high daily temperatures, which are expected to increase in both magnitude and frequency under climate change (Meehl and Tebaldi, 2004; IPCC, 2013). However, previous studies often
overlook the potential impact of changes in Tmax or confound it with other thermal effects. Our study explicitly considers the impact of ecologically relevantTmaxon organism performance and fitness. The results point to aphid fitness declining with Tmax, in contrast to predictions based on daily average temperature. The main driver of this decline is decreased survival at the maximum temperature treatments and to some extent, reductions in adult longevity and lifetime fecundity, although the effect ofTmaxon development rate is relatively small. Aphids are more likely to be exposed to the most extreme temperatures and may not seek thermal refuges in the same way as other species. Therefore,Tmaxmay be more crucial for models on aphid thermal performance and other species that are less mobile compared with species that actively thermoregulate to avoid temperature extremes.
Daily maximum temperatures depress aphid performance even when means are near the critical maximum mean temperatures
An important finding of this work is thatTmaxcan clearly depress life history performance even when average temperatures are still below the critical maximum mean temperature. Our experiments isolated effects ofTmaxby fixing night-time temperatures. AsTmax increased from 32°C to 40°C, the mean temperatures (24–26°C) used are still below or near the critical maximum mean temperatures (26–26.5°C) (Li, 1990; Asin and Pons, 2001), but aphid performance was dampened. Compared with observations from constant-temperature studies (see Ma et al., 2015), the observed
0.2 0.4 0.6 0.8 1.0
24.0 24.4 25.0 25.3 26.0
29.3 29.4 31.1 32.4 33.1
10 15 20 25 30
Proportional survival
A
a a
a
b
c
32.0 34.0 36.0 38.0 40.0
B
Tav (°C)
Tday (°C) Tmean (°C)
Tmax (°C) 0.2
0 0
[image:3.612.49.390.57.232.2]0.4 0.6 0.8 1.0
Fig. 3. Predictions for nymphal survival based on daily average temperature and the differences between observed results and
constant-temperature models.(A) Nonlinear model describing nymphal survival ofS. avenaeas functions of constant temperatures based on data from literature (Dean, 1974; Lykouressis, 1985; Acreman and Dixon, 1989; Li, 1990; Asin and Pons, 2001; Yin et al., 2003) (adapted from Zhao et al., 2014). (B) Comparison of nymphal survival between our results and constant temperature models. Short vertical lines indicate 95% CI. Different letters in the plot represent significantly different daily maximum temperatures (Tmax) at
P=0.05. Black solid and dashed lines represent models based on daily 24 h average temperatures (Tav) and daylight 8 h temperatures (Tday),
respectively. Tav (°C)
0 0.04 0.08 0.12 0.16 0.20
0 0.04 0.08 0.12 0.16 0.20
24.0 24.4 25.0 25.3 26.0
Tday (°C) 29.3 29.4 31.1 32.4 33.1
Tmean (°C)
10 15 20 25 30
Developmental rate (day
–1
)
A
B
c a,b a b,c d
Tmax (°C) 32.0 34.0 36.0 38.0 40.0
Fig. 2. Predictions of developmental rate based on daily average temperature and the differences between observed results and constant-temperature models.(A) Nonlinear model describing developmental rate inS. avenaenymphs as functions of constant temperatures based on data from literature (Dean, 1974; Lykouressis, 1985; Li, 1990; Liu and Li, 1990; Sengonca et al., 1994; Yin et al., 2003). (B) Comparison of development rate between our results (means±s.d.) and constant-temperature models. Different letters in the plot represent significantly different daily maximum temperatures (Tmax) atP=0.05. Solid and dashed
lines represent models based on daily 24 h average temperatures (Tav) and daylight 8 h temperatures
(Tday), respectively.
The
Journal
of
Experimental
[image:3.612.46.373.566.733.2]demographic parameters and fitness (rm) of S. avenae were decreased to some extent when Tmax varied between 32°C and 36°C. WhenTmaxexceeded 36°C, the demographic parameters and fitness declined dramatically (Figs 2–6). This suggests thatTmaxwill reduce fitness to 0 when it reaches a critical threshold. During the daytime, episodic high temperatures can lead to a series of severe physiological and developmental problems in organisms (Denlinger and Yocum, 1998; Karl et al., 2011; Zhang et al., 2013) and further result in mass mortality (Welbergen et al., 2008).
In temperate regions with a large daily temperature range, moderate mean daily temperatures but high daytime maximum temperatures often occur during the growing season. For example, during 1 week in mid June in 2013 at Beijing, five out of seven days had moderate daily average temperatures, which were below the mean threshold (25°C) for the fitness ofS. avenae. However, the Tmaxof these days exceeded 36°C which are critical for the aphid (Fig. 1A). Thus, the temperature regimens we used can reflectTmax under field conditions. These findings point to a crucial effect of Tmax, even when the means are still below critical maximum mean temperatures.
Intermediate effects of daily maximum temperatures on aphid performance in contrast to constant temperatures We found thatTmaxgenerate particular effects on organisms and result in life-history performances that are lower than predicted based on daily average temperature (Tav), but higher than predicted based on average daylight temperatures (Tday). For the demographic
parameters including development rate, survival, adult longevity and lifetime fecundity, the observed values were lower than model predictions based on Tav, especially when Tmax exceeded 36°C (Figs 2–5). As a consequence, the fitness (rm) decreased asTmax increased, in contrast to model predictions based onTav(Fig. 6). Even short-term extreme high temperatures can denature proteins and cause numerous physiological problems (Feder and Hofmann, 1999; Harmon et al., 2009). Our results, together with these findings, indicate detrimental effects of Tmax on organisms. However, the observed demographic parameters and fitness were stable under Tmax≤36°C and were much higher than predictions based onTday(Figs 2–6). This suggests that organisms can recover or even compensate for heat stress under mild temperatures during the night (Davis et al., 2006; Sentis et al., 2013; Colinet et al., 2015).
Predictions based on Tav underestimate the impacts of temperature by neglecting the negative effects of Tmax, while predictions based onTdayoverestimate the detrimental impacts of temperature by ignoring the recovery effects of mild night-time temperatures. Previous studies suggest a trade-off between thermal tolerance and energy allocation in organisms (Neargarder et al., 2003). On the one hand, when facing high daytime temperatures, organisms consume more resources and energy in producing and/or accumulating substances such as heat shock proteins (McMillan et al., 2005), exoskeletal proteins (Nguyen et al., 2009), mannitol and sorbitol (Hendrix and Salvucci, 1998) to enhance their heat resistance and rapidly adapt to daily maximum temperatures
0 5 10 15 20 25
24.0 24.4 25.0 25.3 26.0
29.3 29.4 31.1 32.4 33.1
10 15 20 25 30
Adult longevity (days)
0 5 10 15 20 25
A
a
b a
a a
32.0 34.0 36.0 38.0 40.0
B
Tav (°C)
Tday (°C) Tmean (°C)
[image:4.612.47.380.56.229.2]Tmax (°C)
Fig. 4. Predictions for adult longevity based on daily average temperature and the differences between observed results and
constant-temperature models.(A) Linear relationship between adult longevity and constant temperature inS. avenae
(Dean, 1974; Li, 1990; Sengonca et al., 1994; Zhang, 1994) (adapted from Zhao et al., 2014). (B) Comparison of adult longevity between our results (means±s.d.) and constant temperature models. Different letters in the plot represent significantly different daily maximum temperatures (Tmax) atP=0.05. Solid and dashed lines represent models based on daily 24 h average temperatures (Tav) and daylight 8 h temperatures
(Tday), respectively.
0 20 40 60
24.0 24.4 25.0 25.3 26.0
29.3 29.4 31.1 32.4 33.1
10 15 20 25 30
Lifetime fecundity (nymphs per adult) 0
20 40 60
A
a a a
b c
32.0 34.0 36.0 38.0 40.0
B
Tav (°C)
Tday (°C) Tmean (°C)
Tmax (°C)
Fig. 5. Predictions for lifetime fecundity based on daily average temperature and the differences between observed results and constant temperature models.(A) Nonlinear relationship between lifetime fecundity and constant temperature inS. avenae(Dean, 1974; Lykouressis, 1984; Acreman and Dixon, 1989; Li, 1990; Asin and Pons, 2001) (after Zhao et al., 2014). (B) Comparison of lifetime fecundity between experimental results (means±s.d.) and constant temperature models. Different letters in the plot represent significantly different daily maximum temperatures (Tmax) atP=0.05. Solid and dashed lines
represent models based on daily 24 h average temperatures (Tav) and daylight 8 h temperatures (Tday)
respectively.
The
Journal
of
Experimental
[image:4.612.48.383.563.734.2](Overgaard and Sørensen, 2008). These substances, combined with excessive consumption of resources and energy in promoting heat resistance, in turn reduce performance for life history traits (Krebs and Feder, 1998; Silbermann and Tatar, 2000). Yet on the other hand, at mild night-time temperatures, organisms may spend more resources and energy on repairing and compensating performance such as development and reproduction (Davis et al., 2006; Sentis et al., 2013; Colinet et al., 2015). For example, some aphid species can buffer the negative impact of high daytime temperatures by recovering at relatively lower night-time temperatures (Ma et al., 2004a,b; Zhao et al., 2014). Therefore, our results emphasize the ecological significance of natural fluctuating temperatures with both daytime maximum temperatures and mild night-time temperatures.
Population predictions and climate change
Our findings indicate that daily maximum temperature plays an important role in regulating natural population dynamics and should be considered as an independent variable in predictive models. Effects of realistic dailyTmaxare different from predictions based on constant temperatures which either overestimate or underestimate the impact of temperature (Overgaard et al., 2014). Previous studies on model organisms are mainly based on daily average temperatures, which either overlook daily maximum temperature (Rossberg et al., 1986; Freier et al., 1996; Tobin et al., 2008) or use the mean of the daily average and daily maximum temperatures (van Asch et al., 2007), and thus may underestimate the adverse impact of daily maximum temperature. By contrast, model predictions based on hourly or two-hourly average temperature (Carter et al., 1982; Zhou et al., 1989; Triltsch et al., 1998) focus on the immediate effect of temperature extremes rather than allowing for recovery at other times of the day, and thereby may overestimate the detrimental effect of daily maximum temperature. Our results may be useful for improving population dynamics prediction, as in the case of the aphid Metopolophium dirhodum (Ma, 2000). Data for daily maximum temperatures are easily accessed from most meteorological databases. Since even small changes in maximum temperature can dramatically influence organism phenology (Beebee, 1995; Semenov, 2009), distribution (Overgaard et al., 2014) and population dynamics (Welbergen et al., 2008), our findings highlight the importance for establishingTmax-dependent performance models.
Accurate prediction of the impact of climate change on organisms is a major challenge in this century. The present study emphasizes the need for taking daily maximum temperature into account in making these predictions. Warming is expected to lead to an increase in surface average temperature as well as in daily maximum
temperature (IPCC, 2013). Temperate organisms are thought to have broader thermal tolerance and live in climates that are currently far from their optimal temperature (Deutsch et al., 2008). As a consequence, temperate organisms are expected to increase in abundance under climate change because fecundity and developmental rate are often enhanced by a small increase in mean temperature (Cannon, 1998; Parmesan and Yohe, 2003; Rall et al., 2010). However, previous studies on the impact of short-term heat stress (for several hours at constant high temperatures) show that temperate organisms are particularly vulnerable to extreme high temperatures (Tomanek, 2005; Huang et al., 2007) and predict a substantial decrease in these populations (Terblanche et al., 2008; Chidawanyika and Terblanche, 2011; Zizzari and Ellers, 2011). However, our results show that ecologically relevant daily maximum temperatures have an intermediate impact, in contrast to model predictions based on either mean daily temperatures or mean daylight temperatures. These novel findings point to the requirements for a comprehensive understanding of the impact of climate change in the context of increasingly extreme temperature events.
MATERIALS AND METHODS
Experimental design
We established five temperature regimens in climate chambers (PQX, Laifu Ltd., Ningbo, China; accuracy: 1°C), with differentTmax(increased from 32 to 40°C by increments of 2°C) and the same constant night-time temperature of 22°C (Fig. 1). These five temperature patterns were designed to simulate field temperature changes in late spring and summer days in a typical temperate area with highTmax, such as near Beijing during the growing season. We selected 40°C as the maximum peak temperature because the microhabitat temperatures which the aphids would experience in field were often ≥40°C (the aphids mostly distribute on the spikelet and thus are directly exposed to sunlight) on sunny days (see Fig. 1A,B). Importantly, the frequency ofTmaxexceeding 40°C is predicted to increase by the end of this century (IPCC, 2013), and this temperature was near to the upper thermal limits of most ectothermic species (Hoffmann et al., 2013; Bale and Hayward, 2010).
During the day, temperature started to increase linearly at 08:00 h, reached and stayed at a high level (32, 34, 36, 38 or 40°C) from 12:00 to 13:00 h, and then decreased to 22°C by 16:00 h. Temperature was kept constant at 22°C for the rest of the day. Although this inevitably led to small differences in daily mean temperatures under the five regimes (24, 24.4, 25, 25.3 and 26°C respectively), keeping minimum temperatures constant eliminated the confounding effects of different minimum temperatures. In fact, separating the effect of changes in mean and extreme is challenging and poses an interesting experimental problem because one cannot create different Tmax regimes with the same mean –0.2
–0.1 0 0.1 0.2 0.3
24.0 24.4 25.0 25.3 26.0
29.3 29.4 31.1 32.4 33.1
10 15 20 25 30
Intrinsic rate of increase (
rm
)
–0.2 –0.1 0 0.1 0.2
0.3
A
a a a
b
c
32.0 34.0 36.0 38.0 40.0
B
Tav (°C)
Tday (°C)
Tmean (°C)
[image:5.612.48.381.58.230.2]Tmax (°C)
Fig. 6. Predictions for population growth based on daily average temperature and the differences between observed results and constant-temperature models.(A) Nonlinear relationship between population growth and constant temperature inS. avenae(Li, 1990; Asin and Pons, 2001). (B) Comparison of population growth between experimental results (means±s.d.) and constant-temperature models. Different letters in the plot represent significantly different daily maximum temperatures (Tmax) atP=0.05. Solid and dashed lines represent models based on daily 24 h average temperatures (Tav) and daylight 8 h temperatures
(Tday), respectively.
The
Journal
of
Experimental
temperatures without changing any other part of the temperature regime, e.g. duration of peak temperatures, or minimum temperature for eliminating the disturbing impacts of mean temperature. Importantly, the daily means (24–26°C) used were below or near the critical maximum mean temperatures for population growth [intrinsic rate of increase (rm) >0] recorded for this species, i.e. 26–26.5°C (Li, 1990; Asin and Pons, 2001). Thus, the small differences in mean temperatures are unlikely to impact life history traits of this species, whereas changing other aspects of the temperature regime (e.g. reducing minimum temperatures) are known to alter life history traits and thereby lead to confounding effects of theTmax
treatments (Zhao et al., 2014).
Stock and experimental protocol
Aphids were collected from a winter wheat field near Beijing (39°48′N, 116°28′E) during May 2010.Sitobion avenaewas identified from the aphid samples, and then reared on 5–20 cm high winter wheat seedlings (CA0045) in screen cages (60×60×60 cm) at 22±0.5°C, 50∼60% RH, and a photoperiod of 16 h:8 h (L:D). Aphids were transferred to new seedlings weekly.
For each temperature regimen, 30 newborn aphids (0–6 h old) were monitored until death. These aphids were placed in six translucent clip cages (diameter 35 mm, with two window screens for ventilation) in groups of five. The aphids in each clip-cage were fed on one fresh leaf (clamped by the clip-cage) from a wheat seedling. Nymphal development and survival were checked twice per day at 07:00 and 19:00 h, respectively. Different instar nymphs were determined by their exuvia, which were removed (along with any dead nymphs) from the clip-cage. Reproduction and survival of adults were recorded once a day at 19:00 h, and dead adults and new offspring were removed. After each observation, the focal aphids from a clip-cage were placed into a new one and returned to the climate chambers. The aphids were transferred to new seedlings weekly. Within each chamber, photoperiod was 16 h:8 h (L:D), with light from 06:00 to 22:00 and darkness from 22:00 to 06:00, while relative humidity was 50–60%.
Developmental rate, proportional survival, lifetime fecundity and adult longevity were used as demographic variables, and the intrinsic rate of increasermwas computed as a measure of relative fitness and population growth. For each variable, we calculated cage means by averaging across all five individuals within a cage. Survival was expressed as the proportion of live nymphs that developed into the adult stage. Developmental rate was given by the number of days until nymphs reached the adult stage. Lifetime fecundity (number of offspring per female) and adult longevity were calculated as the total number of offspring and days from adult emergence until death, respectively. The overall fitness measurerm was calculated from the life table with PopTools 3.2.5 according to Hood (2011).
To reveal the extent to which the realistic temperature fluctuations affect aphid performance relative to temperature means and short-term heat stress, we compared the observed effects of these regimens with the predictions based on daily average temperatures (Tav) and the average temperature during daylight hours (Tday, reflecting heat stress). Tav under the five different regimens were calculated as the means of diel 24 h average temperatures (24, 24.4, 25, 25.3 and 26°C respectively), whereasTdaywas calculated as the mean of daylight 8 h (08:00–16:00) temperatures coinciding with periods of high temperature (29.1, 29.2, 31.1, 32.4 and 33.1°C, respectively).
For nymphal developmental rate, survival, adult fecundity and longevity, the constant temperature-dependent performance models are the same as those used in Zhao et al. (2014). Nymphal development data (10–30°C) extracted from the literature (Dean, 1974; Lykouressis, 1985; Li, 1990; Liu and Li, 1990; Sengonca et al., 1994; Yin et al., 2003) were used. Survival data for nymphs (14–30°C) were extracted from the literature (Dean, 1974; Lykouressis, 1985; Acreman and Dixon, 1989; Li, 1990; Asin and Pons, 2001; Yin et al., 2003). Existing data for longevity (Dean, 1974; Li, 1990; Sengonca et al., 1994; Zhang, 1994) and fecundity (Dean, 1974; Lykouressis, 1985; Acreman and Dixon, 1989; Li, 1990; Asin and Pons, 2001) were used. For fitness (rm), data extracted from the literature (Li, 1990; Asin and Pons, 2001) were used to construct a constant
temperature-dependent second-order polynomial model (14–30°C) and the values of regression parameters were estimated with SigmaPlot 11:
rmðTÞ ¼aþbTþcT2: ð1Þ
Statistical analysis
The effects of different temperature regimens on developmental rate, adult longevity, lifetime fecundity andrmwere analyzed with one-way ANOVAs and normally distributed errors using the GLM procedure in SAS V8, and means separated with Duncan’s multiple range tests. Proportional survival was analyzed with a generalized linear mixed model (GLM) with binomial error distribution using the GENMOD procedure, and the levels of significant differences between regimes were compared using planned contrasts based on least-square means.
Acknowledgements
We thank Mrs Yao Du for assistance with experiments.
Competing interests
The authors declare no competing or financial interests.
Author contributions
C.-S.M. conceived and designed the experiments. G.M. and C.-S.M. performed the experiments. G.M., A.A.H. and C.-S.M. analyzed the data and wrote the paper. All authors reviewed the manuscript.
Funding
This research was mainly financially supported by research grants of the Beijing Natural Science Foundation [6132029] and National Natural Science Foundation of China [31170393, 31272035 and 31400350]. Partial financial support was provided by a research project grant [2011-G9] from the Ministry of Agriculture (MOA), China.
References
Acreman, S. J. and Dixon, A. F. G.(1989). The effects of temperature and host quality on the rate of increase of the grain aphid (Sitobion avenae) on wheat.Ann. Appl. Biol.115, 3-9.
Angilletta, M. J. (2009). Thermal Adaptation: A Theoretical and Empirical Synthesis. New York, NY: Oxford University Press.
Asin, L. and Pons, X. (2001). Effect of high temperature on the growth and reproduction of corn aphids (Homoptera: Aphididae) and implications for their population dynamics on the Northeastern Iberian peninsula.Environ. Entomol. 30, 1127-1134.
Bale, J. S. and Hayward, S. A. L.(2010). Insect overwintering in a changing climate.
J. Exp. Biol.213, 980-994.
Bannerman, J. A. and Roitberg, B. D.(2014). Impact of extreme and fluctuating temperatures on aphid-parasitoid dynamics.Oikos123, 89-98.
Beebee, T. J. C.(1995). Amphibian breeding and climate.Nature374, 219-220.
Bradshaw, W. E., Zani, P. A. and Hozapfel, C. M.(2004). Adaptation to temperate climates.Evolution58, 1748-1762.
Brown, J. H., Gillooly, J. F., Allen, A. P., Savage, V. M. and West, G. B.(2004). Toward a metabolic theory of ecology.Ecology85, 1771-1789.
Cannon, R. J. C.(1998). The implications of predicted climate change for insect pests in the UK, with emphasis on non-indigenous species.Glob. Change Biol.4, 785-796.
Carrington, L. B., Armijos, M. V., Lambrechts, L., Barker, C. M. and Scott, T. W.
(2013). Effects of fluctuating daily temperatures at critical thermal extremes on
Aedes aegyptilife-history traits.PLoS ONE8, e58824.
Carter, N., Dixon, A. F. G. and Rabbinge, R. (1982). Cereal Aphid Populations: Biology, Simulation and Prediction. Simulation Monograph. Wageningen, The Netherlands: Pudoc.
Chidawanyika, F. and Terblanche, J. S.(2011). Rapid thermal responses and thermal tolerance in adult codling moth Cydia pomonella (Lepidoptera: Tortricidae).J. Insect Physiol.57, 108-117.
Clusella-Trullas, S., Blackburn, T. M. and Chown, S. L.(2011). Climatic predictors of temperature performance curve parameters in ectotherms imply complex responses to climate change.Am. Nat.177, 738-751.
Colinet, H., Sinclair, B. J., Vernon, P. and Renault, D.(2015). Insects in fluctuating thermal environments.Annu. Rev. Entomol.60, 123-140.
Danks, H. V.(2006). Short life cycles in insects and mites.Can. Entomol.138, 407-463.
Davis, J. A., Radcliffe, E. B. and Ragsdale, D. W.(2006). Effects of high and fluctuating temperatures onMyzus persicae (Hemiptera: Aphididae).Environ.
Entomol.35, 1461-1468.
The
Journal
of
Experimental
Dean, G. J.(1974). Effect of temperature on the cereal aphidsMetopolophium dirhodum(Wlk.),Rhopalosiphum padi(L.) andMacrosiphum avenue(F.) (Hem., Aphididae).Bull. Entomol. Res.63, 401-409.
Denlinger, D. L. and Yocum, G. D.(1998). Physiology of heat sensitivity. In
Temperature Sensitivity in Insects and Application in Integrated Pest Management
(ed. G. J. Hallman and D. L. Denlinger), pp. 7-57. Oxford: Westview Press.
Deutsch, C. A., Tewksbury, J. J., Huey, R. B., Sheldon, K. S., Ghalambor, C. K., Haak, D. C. and Martin, P. R.(2008). Impacts of climate warming on terrestrial ectotherms across latitude.Proc. Natl. Acad. Sci. USA105, 6668-6672.
Easterling, D. R., Horton, B., Jones, P. D., Peterson, T. C., Karl, T. R., Parker, D. E., Salinger, M. J., Razuvayev, V., Plummer, N., Jamason, P. et al.(1997). Maximum and minimum temperature trends for the globe.Science277, 364-367.
Easterling, D. R., Meehl, G. A., Parmesan, C., Changnon, S. A., Karl, T. R. and Mearns, L. O.(2000). Climate extremes: observations, modeling, and impacts.
Science289, 2068-2074.
Feder, M. E. and Hofmann, G. E. (1999). Heat-shock proteins, molecular chaperones, and the stress response: evolutionary and ecological physiology.
Annu. Rev. Physiol.61, 243-282.
Flynn, D. F. B., Sudderth, E. A. and Bazzaz, F.(2006). Effects of aphid herbivory on biomass and leaf-level physiology of Solanum dulcamara under elevated temperature and CO2.Environ. Exp. Bot.56, 10-18.
Folguera, G., Bastı́as, D. A. and Bozinovic, F.(2009). Impact of experimental thermal amplitude on ectotherm performance: adaptation to climate change variability?Comp. Biochem. Physiol. A Mol. Integr. Physiol.154, 389-393.
Freier, B., Triltsch, H. and Rosserg, M.(1996). GTLAUS–A model of wheat–
cereal aphid–predator interaction and its use in complex agroecological studies.
J. Plant Dis. Prot.103, 543-554.
Gillespie, D. R., Nasreen, A., Moffat, C. E., Clarke, P. and Roitberg, B. D.(2012). Effects of simulated heat waves on an experimental community of pepper plants, green peach aphids and two parasitoid species.Oikos121, 149-159.
Harmon, J. P., Moran, N. A. and Ives, A. R. (2009). Species response to environmental change: impacts of food web interactions and evolution.Science 323, 1347-1350.
Hendrix, D. L. and Salvucci, M. E.(1998). Polyol metabolism in homopterans at high temperatures: accumulation of mannitol in aphids (Aphididae: Homoptera) and sorbitol in whiteflies (Aleyrodidae: Homoptera).Comp. Biochem. Physiol. A Mol. Integr. Physiol.120, 487-494.
Hoffmann, A. A., Chown, S. L. and Clusella-Trullas, S.(2013). Upper thermal limits in terrestrial ectotherms: how constrained are they?Funct. Ecol.27, 934-949.
Hood, G. M.(2011). PopTools version 3.2.5. Available at http://www.poptools.org.
Huang, L.-H., Chen, B. and Kang, L.(2007). Impact of mild temperature hardening on thermotolerance, fecundity, and Hsp gene expression in Liriomyza huidobrensis.J. Insect Physiol.53, 1199-1205.
IPCC(2013). Climate Change 2013:The physical science basis. InContribution of Working Group I to the Fifth Assessment Report of the Intergovernmental Panel on Climate Change(ed. T. F. Stocker, D. Qin, G. K. Plattner, M. Tignor, S. K. Allen, J. Boschung et al.). Cambridge, NY, USA: Cambridge University Press.
Jeffs, C. T. and Leather, S. R.(2014). Effects of extreme, fluctuating temperature events on life history traits of the grain aphid,Sitobion avenae.Entomol. Exp. Appl. 150, 240-249.
Karl, I., Stoks, R., De Block, M., Janowitz, S. A. and Fischer, K. (2011). Temperature extremes and butterfly fitness: conflicting evidence from life history and immune function.Glob. Change Biol.17, 676-687.
Kearney, M., Shine, R. and Porter, W. P.(2009). The potential for behavioral thermoregulation to buffer“cold-blooded”animals against climate warming.Proc. Natl. Acad. Sci. USA106, 3835-3840.
Krebs, R. A. and Feder, M. E.(1998). Hsp70 and larval thermotolerance in
Drosophila melanogaster: how much is enough and when is more too much?
J. Insect Physiol.44, 1091-1101.
Lactin, D. J., Holliday, N. J., Johnson, D. L. and Craigen, R.(1995). Improved rate model of temperature-dependent development by arthropods.Environ. Entomol. 24, 68-75.
Li, H. M.(1990). Studies on the population ecology of English grain aphid.J. Jishou Univ.11, 59-70.
Liu, S. Y. and Li, D. X.(1990). Studies on developmental threshold temperature and effective accumulated temperature of Sitobion avenae.Entomol. Knowl. 27, 132-134.
Lykouressis, D. P. (1984). A comparative study of different aphid population parameters in assessing resistance in cereals.J. Appl. Entomol.97, 77-84.
Lykouressis, D. P.(1985). Temperature requirements ofSitobion avenae (F.) necessary for ecological studies, by assessing methods for the estimation of instar duration.J. Appl. Entomol.100, 479-493.
Ma, C.-S.(2000).Modelling and Simulation of the Population Dynamics of the Cereal Aphid Metopolophium Dirhodum in Northern Germany. Berlin: Verlag Franzbecker.
Ma, C.-S., Hau, B. and Poehling, H.-M.(2004a). Effects of pattern and timing of high temperature exposure on reproduction of the rose grain aphid,
Metopolophium dirhodum.Entomol. Exp. Appl.110, 65-71.
Ma, C.-S., Hau, B. and Poehling, H.-M.(2004b). The effect of heat stress on the survival of the rose grain aphid, Metopolophium dirhodum (Hemiptera: Aphididae).Eur. J. Entomol.101, 327-331.
Ma, G., Rudolf, V. H. W. and Ma, C.-S.(2015). Extreme temperature events alter demographic rates, relative fitness, and community structure.Glob. Change Biol. 21, 1794-1808.
McMillan, D. M., Fearnley, S. L., Rank, N. E. and Dahlhoff, E. P.(2005). Natural temperature variation affects larval survival, development and Hsp70 expression in a leaf beetle.Funct. Ecol.19, 844-852.
Meehl, G. A. and Tebaldi, C.(2004). More intense, more frequent, and longer lasting heat waves in the 21st century.Science305, 994-997.
Neargarder, G., Dahlhoff, E. P. and Rank, N. E.(2003). Variation in thermal tolerance is linked to phosphoglucose isomerase genotype in a montane leaf beetle.Funct. Ecol.17, 213-221.
Nguyen, T. T. A., Michaud, D. and Cloutier, C.(2009). A proteomic analysis of the aphidMacrosiphum euphorbiaeunder heat and radiation stress.Insect Biochem. Mol. Biol.39, 20-30.
Overgaard, J. and Sørensen, J. G.(2008). Rapid thermal adaptation during field temperature variations inDrosophila melanogaster.Cryobiology56, 159-162.
Overgaard, J., Kearney, M. R. and Hoffmann, A. A.(2014). Sensitivity to thermal extremes in AustralianDrosophilaimplies similar impacts of climate change on the distribution of widespread and tropical species.Glob. Change Biol.20, 1738-1750.
Paaijmans, K. P., Blanford, S., Bell, A. S., Blanford, J. I., Read, A. F. and Thomas, M. B.(2010). Influence of climate on malaria transmission depends on daily temperature variation.Proc. Natl. Acad. Sci. USA107, 15135-15139.
Paaijmans, K. P., Heinig, R. L., Seliga, R. A., Blanford, J. I., Blanford, S., Murdock, C. C. and Thomas, M. B.(2013). Temperature variation makes ectotherms more sensitive to climate change.Glob. Change Biol.19, 2373-2380.
Parmesan, C. and Yohe, G.(2003). A globally coherent fingerprint of climate change impacts across natural systems.Nature421, 37-42.
Radchuk, V., Turlure, C. and Schtickzelle, N.(2013). Each life stage matters: the importance of assessing the response to climate change over the complete life cycle in butterflies.J. Anim. Ecol.82, 275-285.
Ragland, G. J. and Kingsolver, J. G.(2008). The effect of fluctuating temperatures on ectotherm life-history traits: comparisons among geographic populations of
Wyeomyia smithii.Evol. Ecol. Res.10, 29-44.
Rall, B. C., Vucic-Pestic, O., Ehnes, R. B., Emmerson, M. and Brose, U.(2010). Temperature, predator-prey interaction strength and population stability.Glob. Change Biol.16, 2145-2157.
Reyer, C. P. O., Leuzinger, S., Rammig, A., Wolf, A., Bartholomeus, R. P., Bonfante, A., de Lorenzi, F., Dury, M., Gloning, P., Abou Jaoudé, R. et al.
(2013). A plant’s perspective of extremes: terrestrial plant responses to changing climatic variability.Glob. Change Biol.19, 75-89.
Rossberg, D., Holz, F., Freier, B. and Wenzel, V.(1986). PESTSIM-MAC–A model for simulation ofMacrosiphum avenaeFabr. Populations. In“ Computer-Aided Modelling and Simulation of the Winter Wheat Agroecosystjem (AGROSIM-W) for Integrated Pest Management”. Tagungsbericht der Akademie der Landwirtschafts-wissenschaften der DDR242, 87-100.
Semenov, M. A.(2009). Impacts of climate change on wheat in England and Wales.
J. R. Soc. Interface6, 343-350.
Sengonca, C., Hoffmann, A. and Kleinhenz, B.(1994). Laboruntersuchungen zur Entwicklung, Lebensdauer und Fruchtbarkeit der GetreideblattlausartenSitobion avenae(F.) undRhopalosiphum padi(L.) (Horn., Aphididae) bei verschiedenen tieferen Temperaturen.J. Appl. Entomol.117, 224-233.
Sentis, A., Hemptinne, J.-L. and Brodeur, J.(2013). Effects of simulated heat waves on an experimental plant-herbivore-predator food chain.Glob. Change Biol.19, 833-842.
Silbermann, R. and Tatar, M.(2000). Reproductive costs of heat shock protein in transgenicDrosophila melanogaster.Evolution54, 2038-2045.
Smith, M. D.(2011). An ecological perspective on extreme climatic events: a synthetic definition and framework to guide future research.J. Ecol.99, 656-663.
Terblanche, J. S., Clusella-Trullas, S., Deere, J. A. and Chown, S. L.(2008). Thermal tolerance in a south-east African population of the tsetse flyGlossina pallidipes (Diptera, Glossinidae): implications for forecasting climate change impacts.J. Insect Physiol.54, 114-127.
Tobin, P. C., Nagarkatti, S., Loeb, G. and Saunders, M. C.(2008). Historical and projected interactions between climate change and insect voltinism in a multivoltine species.Glob. Change Biol.14, 951-957.
Tomanek, L.(2005). Two-dimensional gel analysis of the heat-shock response in marine snails (genus Tegula): interspecific variation in protein expression and acclimation ability.J. Exp. Biol.208, 3133-3143.
Triltsch, H., Freier, B. and Rossberg, D. (1998). Consequences of new findings on climate change with relatively warmer nights on the wheat-cereal aphid- predator interaction in computer simulations.Arch. Phytopathol. Plant Prot.31, 363-367.
van Asch, M., van Tienderen, P. H., Holleman, L. J. M. and Visser, M. E.(2007). Predicting adaptation of phenology in response to climate change, an insect herbivore example.Glob. Change Biol.13, 1596-1604.
van Emden, H. and Harrington, R.(2007).Aphids as Crop Pests. Wallingford, UK: CABI.
Vasseur, D. A., DeLong, J. P., Gilbert, B., Greig, H. S., Harley, C. D. G., McCann, K. S., Savage, V., Tunney, T. D. and O’Connor, M. I. (2014). Increased
The
Journal
of
Experimental
temperature variation poses a greater risk to species than climate warming.
Proc. R. Soc. B. Biol. Sci.281, 20132612.
Vucic-Pestic, O., Ehnes, R. B., Rall, B. C. and Brose, U.(2011). Warming up the system: higher predator feeding rates but lower energetic efficiencies. Glob. Change Biol.17, 1301-1310.
Warren, J. A. and Anderson, G.(2013). Effect of fluctuating temperatures on the development of a forensically important blow fly. Protophormia terraenovae
(Diptera: Calliphoridae)42, 167-172.
Welbergen, J. A., Klose, S. M., Markus, N. and Eby, P.(2008). Climate change and the effects of temperature extremes on Australian flying-foxes.Proc. R. Soc. B Biol. Sci.275, 419-425.
Whitney-Johnson, A., Thompson, M. and Hon, E.(2005). Responses to predicted global warming inPieris rapaeL. (Lepidoptera): consequences of nocturnal versus diurnal temperature change on fitness components.Environ. Entomol.34, 535-540.
Xing, K., Hoffmann, A. A. and Ma, C.-S. (2014). Does thermal variability experienced at the egg stage influence life history traits across life cycle stages in a small invertebrate?PLoS ONE9, e99500.
Yin, Q. Y., Zheng, W. Y., Xie, X. S., Li, F., Li, R., Zheng, X. L. and Fan, S. Q.(2003). The effect of temperature on development and fertility ofMacrosiphum avenae.
Acta Agric. Boreali-Sinica18, 71-73.
Zhang, H. S.(1994). Influence of temperatures on the characterictic parameters of survival rate model of populations of the wheat aphidMacrosiphum avenae
(Fabricius).Entomol. J. East China3, 66-68.
Zhang, W., Zhao, F., Hoffmann, A. A. and Ma, C.-S.(2013). A single hot event that does not affect survival but decreases reproduction in the diamondback moth,
Plutella xylostella.PLoS ONE8, e75923.
Zhao, F., Zhang, W., Hoffmann, A. A. and Ma, C.-S.(2014). Night warming on hot days produces novel impacts on development, survival and reproduction in a small arthropod.J. Anim. Ecol.83, 769-778.
Zhou, X., Carter, N. and Mumford, J.(1989). A simulation model describing the population dynamics and damage potential of the rose grain aphid,
Metopolophium dirhodum (Walker) (Hemiptera: Aphididae), in the UK. Bull. Entomol. Res.79, 373-380.
Zizzari, Z. V. and Ellers, J.(2011). Effects of exposure to short-term heat stress on male reproductive fitness in a soil arthropod.J. Insect Physiol.57, 421-426.