COMMENTARY
A radical shift in perspective: mitochondria as regulators of
reactive oxygen species
Daniel Munro1,2and Jason R. Treberg1,2,3,*
ABSTRACT
Mitochondria are widely recognized as a source of reactive oxygen species (ROS) in animal cells, where it is assumed that over-production of ROS leads to an overwhelmed antioxidant system and oxidative stress. In this Commentary, we describe a more nuanced model of mitochondrial ROS metabolism, where integration of ROS production with consumption by the mitochondrial antioxidant pathways may lead to the regulation of ROS levels. Superoxide and hydrogen peroxide (H2O2) are the main ROS formed by mitochondria. However, superoxide, a free radical, is converted to the non-radical, membrane-permeant H2O2; consequently, ROS may readily cross cellular compartments. By combining measurements of production and consumption of H2O2, it can be shown that isolated mitochondria can intrinsically approach a steady-state concentration of H2O2in the medium. The central hypothesis here is that mitochondria regulate the concentration of H2O2 to a value set by the balance between production and consumption. In this context, the consumers of ROS are not simply a passive safeguard against oxidative stress; instead, they control the established steady-state concentration of H2O2. By considering the response of rat skeletal muscle mitochondria to high levels of ADP, we demonstrate that H2O2production by mitochondria is far more sensitive to changes in mitochondrial energetics than is H2O2 consumption; this concept is further extended to evaluate how the muscle mitochondrial H2O2 balance should respond to changes in aerobic work load. We conclude by considering how differences in the ROS consumption pathways may lead to important distinctions amongst tissues, along with briefly examining implications for differing levels of activity, temperature change and metabolic depression.
KEY WORDS: Hydrogen peroxide, Energetics, Antioxidant, Skeletal muscle, Oxidative stress, Glutathione peroxidase, Thioredoxin, Peroxiredoxin
Introduction
Over 40 years ago (Jensen, 1966; Loschen et al., 1971; Boveris et al., 1972; Boveris and Chance, 1973) it was discovered that mitochondria can produce reactive oxygen species (ROS; see Glossary). Since then, the realization that mitochondria may be a source of potentially harmful ROS has profoundly influenced the perceived role(s) of mitochondria in cellular function. The proposed physiological effects of ROS include life-history and energetic trade-offs, cellular dysfunction and damage in response to intense or
prolonged activity, and even senescence and ageing (Trushina and McMurray, 2007; Costantini, 2008; Monaghan et al., 2009; Dai et al., 2014; Day, 2014; Mason and Wadley, 2014). For example, during migration, a trade-off may occur between individual performance and survival or reproductive fitness, owing to oxidative damage accrued during intense exercise. Publications in these areas, and many others, often describe mitochondria as the ‘major source’of ROS in animal cells, despite the high antioxidant capacity of mitochondria (Zoccorato et al., 2004; Dreschel and Patel, 2010; Banh and Treberg, 2013). However, the rationale behind the notion of mitochondria as the major source of ROS in animal cells has been questioned (Brown and Borutaite, 2012), if not directly challenged, based on the capacity of isolated mitochondria to consume substantial amounts of ROS (Zoccorato et al., 2004). It is worth noting that it can be challenging to test hypotheses on mitochondrial function using cells, whole tissue or organism systems because of the additional control exerted by the plasma membrane. For this reason, isolated mitochondria are a valuable tool in understanding how mitochondria may respond to changing cellular conditions (which can be simulated by manipulation of the assay medium). Findings can then inform the generation of hypotheses applicable to higher levels of biological organization.
Recently, a different and more nuanced perspective on the role of mitochondria in ROS balance has been emerging: the contention that the ROS-producing and antioxidant-mediated ROS-consuming pathways of the mitochondrion can be integrated into a regulatory system. This perspective views ROS as specific regulatory molecules, consistent with their role in signalling, rather than simply as inevitable toxic by-products of aerobic metabolism, although excess ROS will cause oxidative stress. To our knowledge, the formalization of these ideas is rooted in work by Andreyev and colleagues (reviewed in Andreyev et al., 2005), initially laid out as a hypothesis by Starkov (2008). Recent experimental evidence in rodent brain and skeletal muscle mitochondria supports this hypothesis (Starkov et al., 2014; Treberg et al., 2015).
This Commentary will focus on the skeletal muscle system, and aims to illustrate how mitochondria can regulate ROS levels. After briefly addressing several concepts on the interplay between mitochondrial energetics (see Glossary) and the major pathways of mitochondrial ROS metabolism, we will illustrate how mitochondria can act as regulators of an important ROS, hydrogen peroxide (H2O2),in vitro.Using the proposed model of
mitochondria as regulators of H2O2, the impact of high ADP
availability on mitochondrial H2O2 metabolism will be explored,
followed by some consideration of how differing degrees of physical activity should affect the regulation of H2O2by skeletal
muscle mitochondria. Finally, we consider how temperature may influence mitochondrial H2O2metabolism, the impact our model
could have on metabolic depression during torpor and how the relevant processes may vary across tissues.
1Department of Biological Sciences, University of Manitoba, Winnipeg, MB,
Canada R3T 2N2.2Centre on Aging, University of Manitoba, Winnipeg, MB,
Canada R3T 2N2.3Department of Human Nutritional Sciences, University of
Manitoba, Winnipeg, MB, Canada R3T 2N2.
*Author for correspondence ( [email protected])
J.R.T., 0000-0001-5112-7325
Journal
of
Experimental
Reactive oxygen species are metabolites too
Mitochondria are well known for their role in the aerobic supply of ATP by oxidative phosphorylation (Box 1), a process often purported to inevitably result in at least some ROS production. There are many sites for mitochondrial ROS production (simplified in Fig. 1A), which predominantly proceeds by the escape of an electron from a redox centre on an enzyme (or a subunit of an enzyme complex) onto oxygen (Fig. 1B). Thus, electrons indeed ‘leak’ from their usual route through the mitochondrial electron transport system (ETS) and Krebs cycle to form ROS. The superoxide radical is the main ROS formed at most sites of production. This free radical (see Glossary) is rapidly dismutated to the non-radical ROS H2O2, which is membrane permeant and can
thus diffuse between cellular compartments. The concentration of H2O2 in the mitochondrion (Cochemé et al., 2011) and in the
cytosol (Arniaz et al., 1995; Palomero et al., 2008) appears to be maintained in the submicromolar range by antioxidants, which probably limits the formation of the membrane-permeant and highly reactive hydroxyl radical (Fig. 1B,C).
Recent studies have identified site-specific inhibitors of ROS production–at least for the outer ubiquinone-binding site in complex III–which have minimal effects on mitochondrial energetics (Orr et al., 2015). The potential for ROS production to cause damage to cells is nearly universal in aerobes–in light of the pharmacological effects discussed above, this raises the question of whether there might be evolutionary trade-offs between energy transformation in aerobic metabolism and ROS production. In other words, if ROS are universally damaging, then why has their production not been mitigated by natural selection to be effectively negligible?
The answer may lie in the now-recognized signalling role of ROS, which are often involved as second messengers in signalling cascades controlling, for example, apoptosis, cell differentiation, wound healing and cell-shape changes, and which also play a role in insulin signalling and redox signalling (see Glossary) in tumour cells (reviewed in Sies, 2014). Mitochondrial ROS in particular have been suggested to mediate feedback signalling to the nucleus and mitochondrial transcription machinery in order to adjust oxidative phosphorylation capacity through mitochondrial biogenesis and modulation of the activity of Krebs cycle enzymes (Moreno-Loshuertos et al., 2006). Mitochondrial ROS also act as regulators of mitophagy (Scherz-Shouval and Elazar, 2011). Recently, it has also been proposed that energy metabolism-linked mitochondrial redox signals may be indirectly mediated via the influence of H2O2on glutathione (GSH) status–the ratio of GSH to
its oxidized form, GSSG, is modulated in response to H2O2
concentration. This influence on the GSH pool alters the activity of proteins both inside and outside the mitochondrion through
S-glutathionylation – a reversible post-translational modification compatible with a signalling role (Mailloux and Treberg, 2016). Therefore, ROS (or H2O2at least) play roles in cell function that
may require further processing by specific enzymes. Thus, H2O2
may be better viewed as a bona fide metabolite rather than simply an inevitable or unavoidable‘by-product’of aerobic metabolism.
Energetics and mitochondrial H2O2metabolism
In this Commentary, our central thesis is that mitochondria can differentially regulate the concentration of H2O2(through observed
changes in its production and consumption) based on their current energetic state. Because electron flow through the mitochondrial ETS is coupled to proton translocation, the flux of electrons through to oxygen is impeded as the protonmotive force (PMF; see Glossary) increases. This impedance leads to a buildup of electrons in redox centres within the enzyme complexes that are List of symbols and abbreviations
GSH reduced form of glutathione
GSSG oxidized form of glutathione also known as glutathione disulphide
[H2O2]ss steady-state concentration of H2O2
k rate constant
PMF protonmotive force
%NAD(P)H percent of combined NAD and NADP pools that are in the reduced form
Vc rate of H2O2consumption
Vc,app apparent (measurable) rate of H2O2consumption
Vp rate of H2O2production
Vp,app apparent (measurable) rate of H2O2production
Glossary First-order kinetics
Description of a reaction rate that is dependent on the concentration of one reactant and can be summarized by the following rate equation: rate of reaction=k[A], where A is the reactant that on which the rate is dependent and kis the rate constant. First-order reactions follow an exponential decay curve for A over time, which can be described by At=A0·e−kt, where A0is the initial amount of A,kis the same reaction
constant already described andtis time.
Free radical
An atom or molecule that has an unpaired electron, designated by the raised dot as seen with the superoxide anion (O2•−), which is formed by
the univalent (single electron) reduction of dioxygen (O2).
Mitochondrial energetics
The interacting processes of electron and proton flux in the mitochondrion that link substrate oxidation to energy transformation. Major components include the membrane potential (ΔΨ) and the pH gradient (ΔpH), which make up the protonmotive force (PMF), as well as the rates of reactions and status of the involved metabolic intermediates.
Mitochondrial uncoupling
Process in which the protonmotive force established by the electron transport system is dissipated by proton leak across the mitochondrial inner membrane without being coupled to ATP synthesis.
%NAD(P)H
A measurement of the relative reduction status of the combined nicotinamide cofactor [NAD(H) and NADP(H)] pools. Generally measured by autofluorescence because the reduced form is strongly fluorescent while the oxidized form is not. For isolated mitochondria this is influenced by both cofactor pools, but is biased toward reflecting the NAD(H) pool.
Protonmotive force (PMF)
The potential energy established by the electrochemical disequilibrium created by proton translocation. It includes an electrical component, the membrane potential (ΔΨ) and a concentration gradient (ΔpH). The protonmotive force is used to couple oxidation of substrate to phosphorylation of ADP to ATP, which together are referred to as
‘oxidative phosphorylation’.
Reactive oxygen species (ROS)
Molecules that contain oxygen and are chemically reactive, meaning they readily react with other molecules without the need for a catalyst. Examples include free radicals [superoxide anion (O2•−) and hydroxyl
radicals (•OH)] and nonradicals [hydrogen peroxide (H2O2) and other
peroxides].
Redox signal
Cellular signalling mechanism based on redox chemistry. Generally, reactive oxygen or nitrogen species or other chemical compounds are major messengers and the relative reduced to oxidized ratio of one or more major cellular redox couple(s) can be a central component (e.g. the NADH/NAD+) of the signal.
Journal
of
Experimental
the source of superoxide or H2O2 (Fig. 1) and in the metabolic
intermediates linking these enzymes. In other words, the mitochondrial redox centres and electron carriers will be in a more reduced state (higher electron availability) as the PMF increases. This increases ROS production and is central to the ‘uncoupling to survive’ hypothesis (Brand, 2000), which postulates that one of the selective advantages to mitochondrial uncoupling (see Glossary) is to prevent excessive ROS production, thereby limiting the oxidative damage that may lead to cellular senescence.
Animal mitochondria contain three major H2O2-consuming
enzymes or enzymatic pathways. Catalase is an H2O2-consuming
enzyme that does not require an external supply of electrons to convert H2O2into H2O and O2, making it independent of the mitochondrial
energetic state (Fig. 1C). Two respiration-dependent pathways also neutralize H2O2: the glutathione-dependent and the
thioredoxin-dependent pathways (Fig. 1C). These pathways rely on a constant supply of electrons, which are supplied via NADPH. Oxidized NADP+is reduced by the oxidation of respiratory substrates, leading
to the maintained supply of reduced intermediates (GSH or thioredoxin), which are required for the activity of the peroxidases (e.g. peroxiredoxin-3 and glutathione peroxidase; Fig. 1C).
To summarize, oxidation of respiratory substrates contributes to the establishment of the PMF. The PMF will feed back on the flux of electrons through the ETS and the Krebs cycle that feeds into the ETS, leading to the accumulation of electrons in the enzymes and mitochondrial electron carriers, and thus influencing the reduction status of the NAD+ and NADP+ [i.e. NAD(P)+] pool in the
mitochondrial matrix. Thus, substrate oxidation will prime both the ROS-producing sites and the respiration-dependent pathways of H2O2consumption. Given that different respiratory substrates are
[image:3.612.53.301.61.214.2]not oxidized at equal rates, nor do they produce equal amounts of ROS, there can be a wide range of ROS production rates and NAD (P)H availability, depending on the substrate supply.
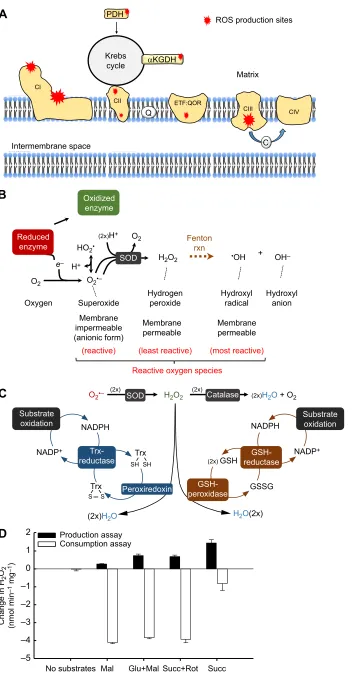
Fig. 1D shows the rate of H2O2 production and H2O2
consumption for a range of substrates. From these data, it is clear that H2O2consumption capacity largely surpasses H2O2production
across a range of substrate conditions in muscle mitochondria. The figure also suggests that high and constant H2O2 consumption
capacities are maintained across various respiratory substrates, and that any apparent decrease in H2O2consumption is thus the result of
an increase in production.
Regulation of metabolite concentration
In the simplest terms, the concentration of a metabolite is set by the interaction between the pathways for its formation and removal. Within a given system, the ability for regulation of a metabolite requires that the consumption or clearance capacity must be greater than the rate of production. This is, in fact, the case for H2O2
production for many respiratory substrates in rodent skeletal muscle (Fig. 1D; Treberg et al., 2015; Munro et al., 2016) and brain mitochondria (Starkov et al., 2014). An additional condition promoting metabolic regulation is that consumption of the metabolite should be able to respond to changes in production. Starkov et al. (2014) proposed that the consumption of H2O2 by
mitochondria follows first-order kinetics (see Glossary), where the rate of disappearance is proportional to the [H2O2] and is described
by a single rate constant (k), a simple means of satisfying this second requirement. Eqn 1 describes the relationship proposed by Starkov and colleagues, wherein for any rate of H2O2production (Vp), the
steady-state concentration of the metabolite ([H2O2]ss) that will be
achieved can be related to the first-order rate constant for consumption (k) as follows:
½H2O2ss¼Vp=k: ð1Þ
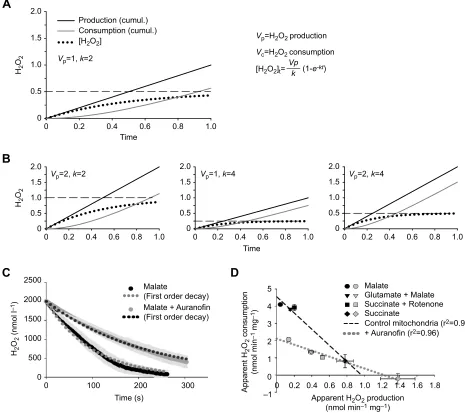
This model predicts that when the concentration of the metabolite of interest starts at zero, then initially the rate of appearance or production (solid black line in Fig. 2A) will approximate the increase in metabolite concentration over time (dotted line in Fig. 2A). However, as the concentration of the metabolite increases, the rate of consumption (solid grey line in Fig. 2A) will also increase. As the system proceeds, the rate of consumption approaches the rate of production, and the metabolite concentration will approach a stable value ([H2O2]ss). The system
will tend towards this set-point regardless of whether the concentration of the metabolite starts at zero.
Using this simple model, we can explore what happens when parts of the system change. For example, if production (Vp) increases, but
the first-order constant (k) for consumption is maintained, the resulting [H2O2]sswill increase (Fig. 2B, left). Conversely, ifVpis maintained
constant, butkis increased, then the [H2O2]sswill decrease (Fig. 2B,
centre). An important aspect of this model is that the speed at which the system approaches equilibrium increases with increasing values ofk. Box 1. The electron transport system of the
mitochondrion
Mobile electron carriers H+
H+
H+ ATP ADP + P H+
NAD+ NADH
Krebs cycle
2H+ + ½ O2
Matrix side
H+
H+ H+
CV
CIV CIII CII CI
Q
C
e e
e
H+ H+
Intermembrane space
H2O
The electron transport system (ETS) of the mitochondrion plays a central role in oxidative phosphorylation by building the protonmotive force required for regenerating ADP into ATP. The ETS consists of four multisubunit enzyme complexes (CI to CIV) that span or are embedded in the surface of the inner mitochondrial membrane. In coordination with smaller mobile electron carrier proteins (ubiquinone, Q; and cytochrome
c, C), these complexes channel the passage of substrate-derived electrons towards oxygen, the final acceptor. Electrons enter the ETS via complex I when originating from the oxidation of NADH-generating substrates, such as in the Krebs cycle. Electrons can also enter the ETS at the level of complex II, and other flavin adenine dinucleotide-containing enzymes (omitted for clarity). Inside the ETS, a net flux towards oxygen reduction is established by favourable electron transfers between redox couples of increasing electron affinity. This cascading of electrons towards a lower level of binding energy is harnessed at the level of complexes I, III and IV, and used to drive charges against their gradient and create the protonmotive force. More precisely, these three complexes couple the passage of electrons with the translocation of protons (H+) from the matrix side to the intermembrane space. A fifth
complex (complex V, also known as F1F0ATPase) is not involved directly
with electron flux; instead, it harnesses the protonmotive force created by the ETS to drive the regeneration of ADP into ATP. Specifically, and under normal conditions, the channelling of H+through complex V, with
the direction of the electrochemical gradient (favourable direction), provides the energy for phosphorylation of ADP.
Journal
of
Experimental
No substrates Mal Glu+Mal Succ+Rot Succ
Change in H
2
O2
(nmol min
–1
mg
–1
)
–5 –4 –3 –2 –1 0 1 2
A
B
C
D
PDH
ROS production sites
Krebs
cycle αKGDH
ETF:QOR
Q
C Intermembrane space
CIII CII
CI
Oxidized enzyme
Reduced enzyme
Fenton rxn
(2x)H+
(2x)
NADPH
Peroxiredoxin
GSH-peroxidase Substrate
oxidation
Trx-reductase
Substrate oxidation
GSH-reductase
NADPH
NADP+ Trx NADP+
SH SH
Trx
S S
H+
Matrix
CIV
O2
HO2•
SOD •OH OH–
e–
+ H2O2
H2O2
(2x)
SOD Catalase (2x)H2O + O2
H2O(2x)
(2x)H2O
(2x) GSH
GSSG O2•–
O2•–
O2
Oxygen Superoxide
Membrane impermeable (anionic form)
(reactive) (least reactive)
Reactive oxygen species
(most reactive)
Membrane permeable Membrane
permeable Hydrogen
peroxide
Hydroxyl radical
Hydroxyl anion
[image:4.612.51.406.51.725.2]Production assay Consumption assay
Fig. 1. Mitochondrial metabolism of H2O2. (A) Major sites of superoxide and H2O2
generation in enzyme complexes of the electron transport system (ETS) and the Krebs cycle (reviewed in Brand, 2010, 2016). CI–CIV, complexes I–IV; PDH, pyruvate dehydrogenase;
αKGDH, alpha-ketoglutarate dehydrogenase; ETF:QOR, electron-transferring flavoprotein: ubiquinone-oxidoreductase; Q, ubiquinone; C, cytochromec. Note: several additional sites and metabolic intermediates have been omitted for clarity. (B) Generalized process of electron leaks leading to reactive oxygen species (ROS) production. Superoxide is produced by a single electron reduction of dioxygen, and is detoxified into H2O2by superoxide dismutase (SOD); H2O2
can form the hydroxyl radical (•OH) and the hydroxyl anion (OH−) via the non-enzymatic Fenton reaction (rxn) in the presence of certain transition metals. (C) Mitochondrial H2O2
consumption. Unlike catalase, the thioredoxin (Trx)- and glutathione (GSH)-dependent pathways for H2O2consumption require
reducing equivalents from NADPH. These respiration-dependent pathways rely on regeneration of Trx and GSH via conversion of an oxidized (S–S) to reduced (–SH) form thiol intermediate between the NADPH-dependent reductase and the H2O2-consuming peroxidase.
(D) Rates of H2O2metabolism by isolated rat
skeletal muscle mitochondria (data are expressed per mg of mitochondrial protein; from Munro et al., 2016). Note that the pathways for the consumption of H2O2have been
pharmacologically compromised in the production assay to minimize underestimation of the production rate. For the consumption assay, mitochondria are incubated with 2.5 µmol l−1
H2O2and allowed to simultaneously consume
and produce H2O2for 10 min. Very low
consumption of H2O2is observed in the absence
of respiratory substrate, which suggests limited involvement of catalase. Mal, malate; Glu, glutamate; Succ, succinate; Rot, rotenone. Results are means± s.e.m. (n=6).
Journal
of
Experimental
This is illustrated in Fig. 2B (right panel) where both production and consumption have been doubled as compared with panel A. It can be seen that the [H2O2]ssis set byVp/k, which is the same as in panel A,
but is reached much faster with the higher value ofk.
First-order kinetics of respiration-dependent H2O2 consumption pathways?
Our general model (Fig. 2A,B) uses an assumption of first-order kinetics to describe the relationship between [H2O2] and the
capacity of mitochondria to consume this ROS, because the rate of consumption (Vc) is a function of [H2O2]. We have previously
shown that the decay of extramitochondrial H2O2 fits reasonably
with first-order kinetics when considering energized rat skeletal muscle mitochondria (Fig. 2C). However, the assumption of a simple first-order reaction describing the combined consumers of ROS allows for consumption to be infinitely high at infinite H2O2
concentration. An infinite value of Vc is, of course, unrealistic;
the ROS consumers do appear to approach saturation (Banh
Apparent H2O2 production
(nmol min–1 mg–1)
Apparent H
2
O2
consumption
(nmol min
–1
mg
–1
)
0 0.2 0.4 0.6 0.8 1.0 1.2 1.4 1.6 1.8
–1 0 1 2 3 4 5
Control mitochondria (r2=0.97)
Malate
Glutamate + Malate Succinate + Rotenone Succinate
+ Auranofin (r2=0.96)
Time
H2 O2
H2 O2
(nmol l
–1
)
H2 O2
0 0.5 1.0 1.5 2.0
A
B
C
D
Production (cumul.) Consumption (cumul.) [H2O2]
Time 0
0.5 1.0 1.5 2.0
0 0.5 1.0 1.5 2.0
0 0.2 0.4 0.6 0.8 1.0
0 0.2 0.4 0.6 0.8 1.0
0 0.2 0.4 0.6 0.8 1.0
0 0.2 0.4 0.6 0.8 1.0
0 0.5 1.0 1.5 2.0
Time (s) 0
0 100 200 300
500 1000 1500 2000 2500
Malate
(First order decay) Malate + Auranofin (First order decay)
Vp=H2O2 production Vc=H2O2 consumption
[H2O2]t= (1-e-kt) Vp
k Vp=1, k=2
[image:5.612.69.534.61.474.2]Vp=2, k=2 Vp=1, k=4 Vp=2, k=4
Fig. 2. Illustration of the model for mitochondrial H2O2regulation based on first-order kinetics of H2O2consumption.(A) A simulation of increasing H2O2consumption leading to stabilization of [H2O2] as time proceeds at a given production rate (Vp). The equation for calculating [H2O2] (dotted line) is given to the
right, and cumulative (cumul.) H2O2production and consumption are plotted as solid black and grey lines, respectively. The slope of the cumulative production
and consumption lines indicates the rate of these processes. As the [H2O2] increases, the consumption increases and the [H2O2] approaches a steady-state
([H2O2]ss, indicated by the dashed line). (B) Simulation of the effects of varyingVpand the consumption rate constant (k). See‘Regulation of metabolite
concentration’for further details. (C) The fit of a first-order equation to the removal of H2O2from the medium by respiring mitochondria. Data were obtained using a
non-destructive probe for monitoring [H2O2]. The figure is from Treberg et al. (2015) (Redox Biol.5, 216-224; copyright © 2015 the authors; published by Elsevier
B.V.). Dark continuous lines indicate the measured [H2O2], with the s.e.m. shown by the surrounding light grey lines. The dotted lines indicate the average fit for the
removal of H2O2, assuming a first-order reaction. Note that reducingkby addition of auranofin markedly alters the rate of H2O2removal but that there is still a
reasonable agreement between the modelled and measured data. (D) The apparent rate of H2O2consumption is linearly related to the apparent rate of production
across values obtained with multiple respiratory substrates (data are expressed per mg of mitochondrial protein). The actual rate of consumption can be approximated by extending the linear regression to they-intercept where the influence of production will be negligible. See‘Differentiating between apparent and actual rates of H2O2production and consumption’ for the difference between apparent and true rates of production and consumption. Data are from Munro et al.
(2016). Each symbol represents a different condition of respiratory substrate oxidation. Black symbols and dashed line, control mitochondria; grey symbols and dotted line, addition of auranofin. Results are means± s.e.m. (n=4–6), and the linear regression is shown by the dashed and dotted lines.
Journal
of
Experimental
and Treberg, 2013; Munro et al., 2016). To clarify, all of the measurements of H2O2 consumption rate (Vc) used here so far
(Figs 1D, 2D) have an initial, approximately linear phase at high [H2O2] from which we could calculate the rate of H2O2
consumption in terms of nmol min−1. Calculating linear rates
provides a convenient means of comparing rates of H2O2
consumption (Vc) with rates of production (Vp), but the first-order
kinetic approximation remains a useful means of describing the response of the consumers under conditions when [H2O2] is low and
more likely to be similar to physiological levels.
At the crossroads: producers and consumers interact with a common matrix pool of H2O2
Much of the experimental evidence for mitochondria as regulators of [H2O2] comes from assays monitoring extramitochondrial H2O2; this
is because components of the assay system that is used to quantify H2O2cannot cross biological membranes and are confined to the
medium. It is conventionally assumed that only minor amounts of H2O2produced in the mitochondrial matrix are consumed before
reaching the extramitochondrial detection system. However, using rodent skeletal muscle mitochondria, we recently demonstrated that this is not the case (Treberg et al., 2010, 2015; Munro et al., 2016). This means that mitochondrial ROS production rates are largely underestimated when based on extramitochondrial detection of H2O2. This is an important additional complexity to consider when
evaluating the model leading to Eqn 1.
Differentiating between apparent and actual rates of H2O2 production and consumption
The interaction between endogenous mitochondrial H2O2
metabolism and observed rates of change in extra-mitochondrial H2O2is a clear demonstration that H2O2is exchanged between the
mitochondrial matrix and extramitochondrial pools. This means that there is a distinction between ‘actual’ rates of production and consumption of H2O2(VpandVc, respectively), and their‘apparent’
rates (those which are measured),Vp,appandVc,app. Appreciating this
distinction led us to derive a means of estimating the actual values of VpandVc, by measuring their apparent values and extrapolating to
where the rate of the competing intramitochondrial process would be zero. For example, Fig. 2D shows howVc,apprelates toVp,app. As Vc,appdeclines, the rate of H2O2 production increases, which we
interpret as competition between exogenous and endogenous supply of H2O2 to the consumption pathways. However, by
extending the relationship to the y-intercept, an estimate of the actual rate of consumption of H2O2can be made where the influence
of H2O2 production will be zero (Fig. 2D). If the matrix H2O2
consumption capacity is inhibited with auranofin, which impairs the thioredoxin-dependent pathway (Munro et al., 2016), the slope of the relationship between Vp,app and Vc,app decreases, and the
predicted rate of H2O2consumption, in the absence of competition
from endogenous production, also decreases.
Importantly, the strong correlation betweenVp,appandVc,appleads to
the interpretation that the consumption rate (Vc) is maintained across
different substrate conditions. In other words, the supply of NADPH to the reductases for consumption of H2O2is not sufficiently low to
limit the rate of H2O2consumption by the peroxidases, at least for the
set of substrate conditions that we tested. This satisfies the requirement of the model leading to Eqn 1 for greater overall capacity for H2O2
consumption than production across a large range of energetic conditions, with the added benefit that it is reasonable to assert that the capacity of the H2O2-consuming pathways is consistent across these
substrate conditions.
Direct evidence of mitochondrial H2O2regulation
As we have shown above, skeletal muscle mitochondria have the requisite traits described in our general model of metabolite regulation that led to Eqn 1. For the interested reader, more detailed explanations can be found elsewhere (see Starkov et al., 2014; Treberg et al., 2015), but the requirements include [H2O2
]-dependent consumption that can act on both intramitochondrial and extramitochondrial H2O2and outpace production. Combining these
concepts, we will now discuss how isolated mitochondria can act as regulators of [H2O2].
Our model predicts how the system can regulate towards a [H2O2]ss. This [H2O2]ss should be a function of Vp, set by the
substrates added, andVcdescribed byk, which does not change
across substrate conditions (Fig. 2D). In order to determine whether H2O2 is accumulating in the medium or being consumed by the
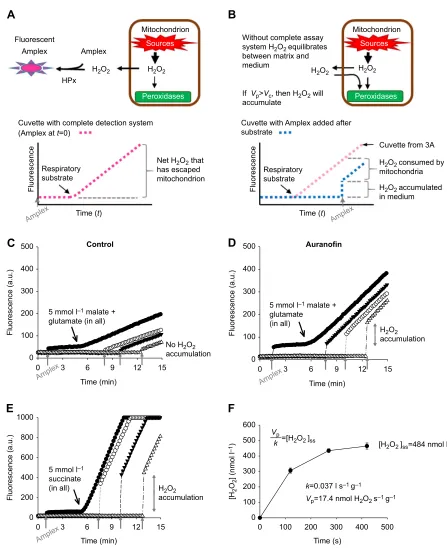
mitochondria, we used a modified version of the horseradish peroxidase-linked fluorometric Amplex UltraRed assay. Normally, using this assay to measure H2O2 that has escaped from the
mitochondrion consumes all extramitochondrial H2O2, thus
maintaining an outward diffusion gradient (Fig. 3A). We modified the assay by adding respiratory substrate as normal but withholding the Amplex UltraRed for a period of time. This allows assessment of whether H2O2has accumulated or been consumed–
an accumulation of H2O2 is measured as a ‘jump’ in the
fluorescence following addition of Amplex UltraRed (Fig. 3B). For example, while using glutamate and malate as the respiratory substrates, we see negligible accumulation of H2O2in the presence
of energized mitochondria, in accordance with lowVpbut high and
maintainedVc(Fig. 3C). In this example, it is clear that some H2O2
escapes the mitochondrion and can be detected when the detection system is completed by the addition of Amplex UltraRed at different time points for the four parallel reactions (Fig. 3). But there is no detectable accumulation of H2O2in absence of a complete detection
system, suggesting the consumers are maintaining H2O2at very low
concentrations. However, compromising Vc with the inhibitor
auranofin, which decreasesk(Treberg et al., 2015), and adding the same substrates leads to the appearance of H2O2 in the medium
before the addition of Amplex UltraRed (Fig. 3D). IfVp is high
enough for a given substrate, we would expect that some H2O2
should accumulate in the medium in absence of auranofin. Succinate leads to very high H2O2 production rates in
well-coupled muscle mitochondria (Fig. 1D). When using succinate as a respiratory substrate, H2O2 accumulates (Fig. 3E) and even
approaches a steady-state concentration over time (Fig. 3F), as predicted. These results are consistent with the general model in Fig. 2, and we conclude that for any condition where the consumption capacity does not change, any increase or decrease in the rate of H2O2production should lead to a concomitant increase
or decrease in the established [H2O2]ss.
How should [H2O2]ssrespond to changes in mitochondrial energetics? ADP as a test case
ADP activates the mitochondrial ATP synthase, thus allowing protons to return to the matrix side of the inner mitochondrial membrane, and partially collapsing the PMF (Box 1). This reduction in the PMF allows for increased flux through PMF-generating complexes in the ETS of the inner membrane, thus decreasing the concentration of the reduced form of NAD+ and
NADP+[NAD(P)H] in the matrix. Here, we illustrate these effects
under two different substrate conditions: (1) malate (alone), which is a poorly oxidized respiratory substrate in muscle mitochondria, and (2) malate with glutamate, which allows for more rapid oxidation of
Journal
of
Experimental
Time (min) Time (min)
Time (min) Time (s)
0 3 6 9 12 15
Fluorescence (a.u.)
Fluorescence (a.u.)
Fluorescence (a.u.)
0 100 200 300 400 500
0 3 6 9 12 15
0 100 200 300 400 500
0 3 6 9 12 15
0 200 400 600 800 1000
0 100 200 300 400 500
[H
2
O2
] (nmol l
–1)
0 100 200 300 400 500 600
C
D
E
F
Control Auranofin
5 mmol l–1 malate +
glutamate (in all)
5 mmol l–1 malate +
glutamate (in all)
Amplex
Amplex Amplex
5 mmol l–1
succinate (in all)
No H2O2
accumulation
H2O2
accumulation
H2O2
accumulation
Amplex
Amplex
A
B
Vp
k [H2O2]ss=484 nmol l–1
=[H2O2]ss
k=0.037 l s–1 g–1
Vp=17.4 nmol H2O2s–1 g–1
Fluorescent
Fluorescence Fluorescence
Amplex
Cuvette with complete detection system Cuvette with Amplex added after substrate
Amplex
Mitochondrion Mitochondrion
Without complete assay system H2O2 equilibrates
between matrix and medium
If Vp>Vc, then H2O2 will
accumulate
Sources Sources
Peroxidases Peroxidases
HPx
H2O2 H2O2 H2O2 H2O2
(Amplex at t=0)
Respiratory substrate
Time (t) Time (t)
Respiratory substrate
Cuvette from 3A
H2O2 consumed by
mitochondria
H2O2 accumulated
in medium Net H2O2 that
[image:7.612.76.523.50.601.2]has escaped mitochondrion
Fig. 3. Demonstrating the accumulation of H2O2over time with isolated muscle mitochondria.(A) (Upper) Cartoon demonstrating the principle of the fluorometric detection of extramitochondrial H2O2via the H2O2-consuming horseradish peroxidase (HPx)-linked enzymatic reaction. By eliminating all
extramitochondrial H2O2, the assay maintains a strong outward diffusion gradient for H2O2that can be followed over time as a measure of net H2O2escape from
the mitochondrion (lower). (B) (Upper) Illustration of conditions when the H2O2detection system is incomplete because of absence of the fluorometric substrate.
(Lower) Schematic showing how to use the jump in fluorescence, relative to a cuvette containing complete detection system att=0, to determine
extramitochondrial H2O2accumulation in the medium. (C–E) All assay components, except the molecular fluorescent probe Amplex UltraRed (Amplex), were
added before beginning the assay. Additions of Amplex UltraRed are indicated by vertical grey arrows. (C) There is negligible accumulation of H2O2in the
medium of mitochondria respiring on 5 mmol l−1glutamate and malate. (D) Addition of 2 µmol l−1auranofin to mitochondria respiring on 5 mmol l−1glutamate
and malate results in H2O2accumulation. (E) Mitochondria respiring on 5 mmol l−1succinate accumulate H2O2in the medium in a time-dependent manner.
Note that where the traces reach 1000 arbitrary units, the detector has reached its maximum for the sensitivity settings used. (F) Accumulation of H2O2in the
medium from mitochondria respiring on 5 mmol l−1succinate approaches a stable steady-state concentration as determined by Eqn 1 and based on
experiments as illustrated in E. Data are means±s.e.m. (n=3).kandVpvalues are expressed per g of mitochondrial protein. C–E and legend are modified from
Treberg et al. (2015) (Redox Biol.5, 216-224; copyright © 2015 the authors; published by Elsevier B.V.). For the interested reader, values for kinetic parameters
and explanation of units can be found elsewhere (Treberg et al., 2015).
Journal
of
Experimental
respiratory substrates and a shift towards a more reduced state in the nicotinamide cofactor pools–that is, an increase in NADH/NAD+
and NADPH/NADP+ – as indicated by higher %NAD(P)H (see
Glossary).
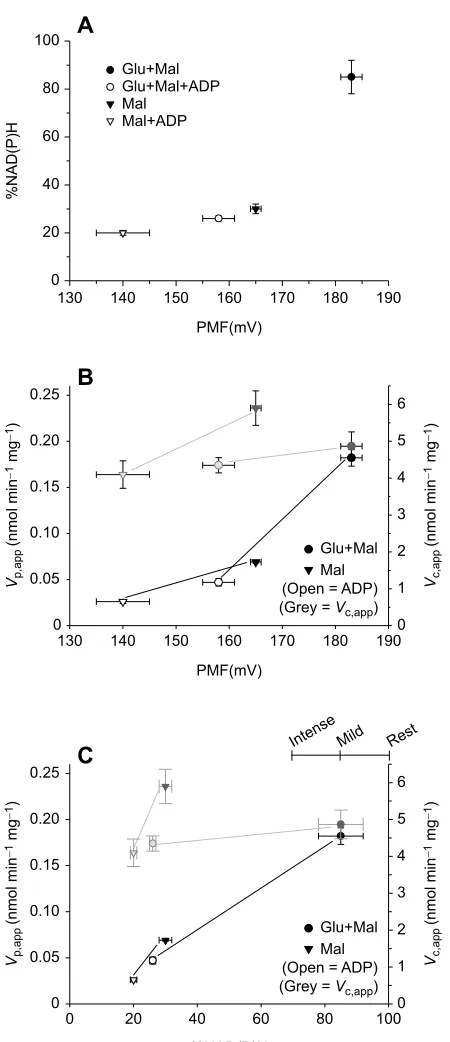
As expected, respiration with glutamate and malate leads to a higher PMF than with malate alone, and under both substrate conditions the presence of ADP markedly decreases the PMF (Fig. 4A) (data from Quinlan et al., 2012). Similarly, glutamate and malate in combination allow for a higher %NAD(P)H as compared with malate alone, and ADP markedly decreases %NAD(P)H for both substrate conditions. Note that measurement of PMF under the same experimental conditions demonstrates a strong relationship between PMF and the %NAD(P)H (Fig. 4A). The strength of the relationship allows us to exploit the effects of ADP on the mitochondrial energetic state in order to investigate the relationship between PMF and the production and consumption of H2O2.
As the PMF decreases, in response to ADP, the capacity to consume H2O2shows relatively little response compared with the
rate of ROS production, which drops by a factor of three to four (Fig. 4B). Similarly, large decreases in %NAD(P)H in response to ADP addition largely affect H2O2 production rates while having
relatively little impact on the capacity for consumption (Fig. 4C). This is typical, in our experience, of skeletal muscle mitochondria respiring under conditions that can readily reduce NAD+to NADH
either by matrix dehydrogenase reactions and buildup of Krebs cycle intermediates or by the reversal of complex I of the ETS (J.R.T., S. Banh, P. Zacharias, L. Wiens, D.M., unpublished observations).
Preferential activation of the consumption pathways over the production pathways at low %NAD(P)H
The respiration-dependent H2O2 consumption pathways
characteristic of muscle mitochondria require a constant supply of NADPH to maintain flux and should theoretically fail under low % NAD(P)H (Fig. 1C). Above, we show that, under two different substrate conditions, and with or without ADP, the decrease in H2O2
production is much more pronounced than the decrease in H2O2
consumption when %NAD(P)H declines, indicating a more oxidized state of the matrix nicotinamide cofactor pool. In other words, the consumers appear to be primed and ready to quench H2O2well in
advance of reaching energetic states that are associated with high rates of ROS production. This has implications for the signalling role of H2O2 in transmitting information about the energetic status of the
mitochondrion to its transcriptional machinery and to the nucleus (Moreno-Loshuertos et al., 2006). The resilience of the consumers in the face of declining %NAD(P)H, relative to the producers, leads to a system where–under most conditions–the [H2O2]sswill reflect the
changes in H2O2production (Eqn 1), which is largely a function of the
mitochondrial energetic state.
How the mitochondrion interacts with other cellular elements in ROS handling is currently unknown. Some cytoplasmic components (homologs of mitochondrial H2O2 consumption and
production pathways) also have the potential to regulate [H2O2]ssin
a manner similar to what we propose for mitochondria. However, these cytosolic consumers and extramitochondrial sources of H2O2
could have different [H2O2]ssset-points compared with that of the
mitochondrial matrix. Mitochondria may therefore represent a net sink or source of H2O2, if the current set-point for matrix [H2O2]ssis
lower or higher, respectively, than that of the cytosol.
Implications and future work
Here, we briefly elaborate on potential physiological consequences of our hypothesized role for mitochondria in H2O2 regulation on Rest
A
PMF(mV)
130 140 150 160 170 180 190
%NAD(P)H
0 20 40 60 80 100
Glu+Mal Glu+Mal+ADP Mal
Mal+ADP
%NAD(P)H
0 20 40 60 80 100
0 0.05 0.10 0.15 0.20 0.25
0 1 2 3 4 5 6 Inten
se Mild
B
C
PMF(mV)
130 140 150 160 170 180 190 0
0.05 0.10 0.15 0.20 0.25
0 1 2 3 4 5 6
Glu+Mal Mal (Open = ADP) (Grey = Vc,app)
Glu+Mal Mal (Open = ADP) (Grey = Vc,app)
Vp,
app
(nmol min
−
1 mg
−
1)
Vc,
app
(nmol min
−
1 mg
−
1) Vc,
app
(nmol min
−
1 mg
−
1)
Vp,app
(nmol min
−
1 mg
−
[image:8.612.63.288.52.573.2]1)
Fig. 4. The effects of mitochondrial energetics on apparent rates of H2O2 production (Vp,app) and consumption (Vc,app).(A) In isolated rat skeletal muscle mitochondria, the protonmotive force (PMF) and the matrix nicotinamide cofactor reduction state [%NAD(P)H] are correlated across different conditions of respiratory substrates. (B) Addition of ADP (500μmol l−1) decreases the PMF
andVp,app, but the effects onVc,appare limited (Vp,appandVc,appvalues are
expressed per mg of mitochondrial protein). (C) Addition of ADP decreases the % NAD(P)H andVp,app, but the effects onVc,appare limited (Vp,appandVc,appvalues
are expressed per mg of mitochondrial protein). The upper right partialx-axis indicates the %NAD(P)H values associated with three levels of physical activity (rest, mild aerobic and intense aerobic exercise) in rat skeletal muscle mitochondria, according to Goncalves et al. (2015). Data for A–C are from Quinlan et al. (2012) for PMF and %NAD(P)H or from unpublished observations (D.M. and J.R.T.;n=4; based on protocols described in Munro et al., 2016) forVp,appandVc,app. All values are means± s.e.m. Mal,
malate; Glu, glutamate.
Journal
of
Experimental
working skeletal muscle. We also consider the influence of body temperature, inter-tissue variation and the possible role of post-translational protein modification.
Skeletal muscle mitochondria, oxidative stress and intense activity
Sustained intense physical activity, such as long-distance migration, increases levels of oxidative stress markers. This has been ascribed to a putative increase in mitochondrial ROS production during periods of intense oxygen consumption. However, physical activity increases the turnover rate of ATP, thus increasing ADP availability to the mitochondria. Here, we have shown that while H2O2
consumption is not significantly affected, H2O2 production
decreases profoundly in the presence of high levels of ADP. Interestingly, a recent study provides some benchmarks for the physiological levels of %NAD(P)H in rat muscle mitochondria by comparing mixes of respiratory substrates and effectors mimicking thein vivoenvironment for three levels of physical activity:‘rest’, ‘mild aerobic exercise’and ‘intense aerobic exercise’(Goncalves et al., 2015). The %NAD(P)H corresponding to these conditions are indicated in Fig. 4C. Comparing rest (the highest rate of H2O2
production) with intense exercise (the lowest rate of production) indicates an 85% decline in Vp,app across this range of activity
(Goncalves et al., 2015). In contrast, our results (Fig. 4C), would predict minimal effects onVc,appfor the same decrease in
%NAD(P)H. If this prediction and our model are correct, then– according to Eqn 1– ‘intense’aerobic physical activity should lead to a decrease in the [H2O2]ss as compared with‘rest’conditions.
Additionally, we have previously argued that the acidification that occurs with intense muscle activity may shift mitochondria towards a more antioxidant state (Banh and Treberg, 2013).
In view of the combined effects of the expected decline in H2O2
production and maintained H2O2 consumption, which should
reduce the [H2O2]ss set by muscle mitochondria during physical
activity, it seems unlikely that mitochondrial function promotes oxidative stress during periods of high demand for ATP in the cell. Reconciling this with the observed increase in markers of oxidative stress after intense exercise (reviewed in Powers and Jackson, 2008) will require further investigation, but these arguments support a role for extramitochondrial sources of ROS, including NADPH oxidases, phospholipase A2 and lipoxygenases, as the cause of the observed oxidative stress.
Rapid changes in temperature
We recently demonstrated that H2O2production by fish red muscle
mitochondria is more sensitive to changes in assay temperature than are the reductases that supply NADPH to the respiration-dependent H2O2 consumers (Banh et al., 2016). We hypothesized that this ‘thermal mismatch’could implicate mitochondria as a bona fide source of oxidative stress during acute heat stress in ectotherms. A mismatch in the temperature sensitivity of H2O2 production and
H2O2 consumers may be particularly significant for animals that
experience large and regular temperature fluctuations, such as intertidal species (Somero, 2002).
Mammalian torpor and hibernation
Many small endothermic hibernators go through repeated bouts of metabolic depression and torpor at low body temperature which are interrupted by acute and rapid rewarming by 20°C or more during the interbout euthermia phase (Geiser, 2004). Applying our thermal-mismatch observation (see above) to hibernating mammals predicts that decreasing body temperature could
passively contribute to decreasing [H2O2]ss during torpor. A
previous study using isolated liver and skeletal muscle mitochondria of hibernating 13-lined ground squirrels found that mitochondrial H2O2 efflux often decreases as assay temperature
declines from 37°C to 10°C (Brown et al., 2012). Although the interaction of physiological state (interbout euthermic, torpid or summer-active animals), tissue, assay and respiratory substrates added leads to a complex pattern to interpret (Brown et al., 2012), one consistency arises: efflux of H2O2 is lower for mitochondria
isolated from torpid individuals when measured at a physiologically relevant temperature corresponding to torpor (10°C) compared with mitochondria isolated from individuals during interbout euthermia and measured at 37°C (Brown et al., 2012).
Factors that affect mitochondrial [H2O2]ss during torpor may,
however, be much more diverse than simple temperature effects. Mitochondrial substrate oxidation capacity is markedly decreased, especially for succinate but also with NADH-linked substrates, during the torpor phase of hibernation (Staples, 2014, 2016). As discussed above, a decrease in mitochondrial capacity for substrate oxidation may affect the production of H2O2 more than the
pathways for its consumption, thereby decreasing [H2O2]ss.
However, there are indications that proteomic and allosteric regulation of mitochondrial substrate oxidation may form part of the adaptation to torpor (reviewed in Staples, 2014, 2016). Post-translational modifications such as glutathionylation may decrease enzymatic flux and, at the same time, either decrease or increase ROS production as seen with complex I and II, respectively (reviewed in Mailloux and Treberg, 2016). Therefore, the declining substrate oxidation capacity may not necessarily lead to declining H2O2production.
Very little research has been conducted on regulation ( proteomic and/or allosteric) of the pathways for the consumption of H2O2
during hibernation and torpor. Levels of peroxiredoxins, including the mitochondrion-specific peroxiredoxin-3, increase in brown adipose tissue and heart of 13-lined ground squirrels during hibernation (Morin and Storey, 2007), which presumably should elevate the mitochondrial capacity for H2O2 consumption, thereby leading to
lower [H2O2]ss; however, this remains to be empirically tested.
In contrast with baseline torpor, the short period of rewarming from a torpor episode may lead to increased cell-level oxidative stress. Support for this stress includes increased antioxidant (ascorbate) uptake from plasma during rewarming (Tøien, 2001), and the recruitment of hypoxia-inducible factor 1α(Ma et al., 2005) and elevated protein carbonyls and TBARS in late arousal phase (Orr et al., 2009). Oxidative stress during arousal from torpor has traditionally been attributed by some to the increased oxygen consumption by mitochondria. For instance, a previous attempt to estimate the elevated ROS formation was based on an assumed direct relationship between oxygen consumption and the fraction of oxygen diverted to ROS production by mitochondria (% free radical leak) during rewarming (Orr et al., 2009). However, as discussed above, our model shows that elevated oxygen consumption (either by demand for ATP or increased proton leak) and the associated decrease in PMF is expected to temporarily lower mitochondrial [H2O2]ss. Clearly, the interaction between oxidative stress and
rewarming is potentially more complex than the simple effect of oxygen consumption by mitochondria.
It will be important to reconcile how during hibernation, especially during the acute phase of rewarming leading into interbout euthermia, there is shifting metabolic capacity for mitochondrial substrate oxidation combined with alterations in mitochondrial H2O2 metabolism (both production and
Journal
of
Experimental
consumption). This may be an important test of our hypothesized role for mitochondria as regulators of H2O2.
Other organs and tissues
The nature and capacity of mitochondrial H2O2 consumers have
only been explored for a limited number of tissues, so it is difficult to generalize the nature of H2O2regulation across multiple tissues.
Brain mitochondria are likely to regulate H2O2similarly to muscle
mitochondria, as they also rely on respiration-dependent pathways for the consumption of H2O2, with minimal involvement of
catalase. Brain and muscle mitochondria also have similar H2O2
consumption rates: ∼11 and 6 nmol min−1 mg−1 protein,
respectively (Dreschel and Patel, 2010; Munro et al., 2016). It is difficult to estimate how qualitative and quantitative inter-tissue differences in mitochondrial H2O2consumption translate into
functional differences in regulation of matrix [H2O2]ss. Although
the effectiveness of catalase in maintaining very low levels of [H2O2] is questionable owing to its low affinity [theKmfor H2O2is
typically found in the range of 80 to 100 mmol l−1 in mammals
(Switala and Loewen, 2002)], catalase has an exceptionally high catalytic turnover (kcat) and we have observed that liver
mitochondria (which have a high catalase content) can readily consume a bolus of 2.5 µmol l−1H
2O2to below detection capacity
(i.e. below 0.1–0.2 µmol l−1) in the absence of additional respiratory
substrates (D.M. and J.R.T., unpublished observations). Hence, we cannot exclude the idea that catalase may well achieve respiration-independent regulation of H2O2 in tissues where it is highly
expressed. In fact, liver mitochondria have rates of H2O2
consumption that are∼10 to 20 times higher than those of muscle and brain; their high catalase content may help to explain this (Dreschel et al., 2010; Lopert and Patel, 2014; D.M., unpublished observations). Thus, there may be some tissues where mitochondria would regulate H2O2 predominately in response to the current
mitochondrial energetic state (skeletal muscle and brain), whereas in other tissues, such as liver, respiration-independent H2O2
consumption could be the dominant mitochondrial contribution. This will be important to consider when extending the arguments provided here to new tissues or other species.
Post-translational regulation
Except for brief mention in regards to hibernation and torpor, we have not considered the regulation of H2O2at the level of specific
enzymes; however, it is probable that allosteric or post-translational regulation may add additional levels of complexity. For example, macromolecular supercomplexes have been implicated in altering the production of superoxide (Genova and Lenaz, 2014), which– alongside modifications such as glutathionylation–could influence mitochondrial H2O2 production (Mailloux and Treberg, 2016).
Likewise, post-translational modification could affect H2O2
consumption pathways, which would alter k in our model and thereby alter the [H2O2]ss. Thus, our model fits a scenario where
there should be a wide range of physiologically adjustable [H2O2]ss
set-points possible in order to reflect and communicate mitochondrial status via redox signalling.
Conclusions
In this Commentary, we have shown that mitochondria have the attributes necessary to act as regulators of H2O2concentration. The
model described herein relies on the existence of a balance between H2O2production and consumption by mitochondria. The existence
of such a balance would indicate that mitochondrial antioxidant systems are not simply minimizing oxidative damage but, instead,
are an integral component of the ROS regulatory system. Moreover, the model discussed here would allow for mitochondria to alter the [H2O2]ss based on changes in the dynamics of ROS metabolism.
Mitochondrial H2O2production appears to be far more sensitive to
changes in mitochondrial energetics than are the consumption pathways. Thus, mitochondrial H2O2 production could be an
important link in redox signalling within the mitochondrion and between the mitochondria and the nucleus. If mitochondria are regulators of cellular H2O2 concentration, this will change our
understanding of the role of mitochondrial ROS metabolism in environmental adaptation, oxidative stress in response to life-history or metabolic trade-offs, metabolic dysfunction and signalling. However, future work should expand these lines of investigation to other types of mitochondria (from different tissues and species) in order to further test this model. It will also be important to extend these experiments from isolated mitochondria to cell- and tissue-level work in order to test whether mitochondria also may act as significant regulators of H2O2in situ.
Acknowledgements
The authors thank Joy Stacey for editorial comments and the feedback provided by three reviewers.
Competing interests
The authors declare no competing or financial interests.
Funding
This work was supported by a Natural Sciences and Engineering Research Council of Canada Discovery Grant (418503-2012) and the Canada Research Chairs program (223744), as well as a postdoctoral fellowship to D.M. from the Fonds de Recherche du Québec–Nature et Technologies (FRQ-NT; grant 183703).
References
Andreyev, A. Y., Kushnareva, Y. E. and Starkov, A. A.(2005). Mitochondrial metabolism of reactive oxygen species.Biochemistry70, 200-214.
Arnaiz, S. L., Travacio, M., Llesuy, S. and Boveris, A.(1995). Hydrogen peroxide metabolism during peroxisome proliferation by fenofibrate.Biochim. Biophys. Acta1272, 175-180.
Banh, S. and Treberg, J. R.(2013). The pH sensitivity of H2O2metabolism in skeletal muscle mitochondria.FEBS Lett.587, 1799-1804.
Banh, S., Wiens, L., Sotiri, E. and Treberg, J. R.(2016). Mitochondrial reactive oxygen species production by fish muscle mitochondria: potential role in acute heat-induced oxidative stress.Comp. Biochem. Physiol.191, 99-107. Boveris, A. and Chance, B.(1973). The mitochondrial generation of hydrogen
peroxide. General properties and effect of hyperbaric oxygen.Biochem. J.134, 707-716.
Boveris, A., Oshino, N. and Chance, B. (1972). The cellular production of hydrogen peroxide.Biochem. J.128, 617-630.
Brand, M. D.(2000). Uncoupling to survive? The role of mitochondrial inefficiency in ageing.Exp. Geron.35, 811-820.
Brand, M. D.(2010). The sites and topology of mitochondrial superoxide production.
Exp. Gerontol.45, 466-472.
Brand, M. D.(2016). Mitochondrial generation of superoxide and hydrogen peroxide as the source of mitochondrial redox signaling.Free Radic. Biol. Med.100, 14-31. Brown, G. C. and Borutaite, V.(2012). There is no evidence that mitochondria are the main source of reactive oxygen species in mammalian cells.Mitochondrion
12, 1-4.
Brown, J. C. L., Chung, D. J., Belgrave, K. R. and Staples, J. F. (2012). Mitochondrial metabolic suppression and reactive oxygen species production in liver and skeletal muscle of hibernating thirteen-lined ground squirrels.
Am. J. Physiol.: Reg. Integr. Comp. Physiol.302, R15-R28.
Cochemé, H. M., Quin, C., McQuaker, S. J., Cabreiro, F., Logan, A., Prime, T. A., Abakumova, I., Patel, J. V., Fearnley, I. M., James, A. M. et al.(2011). Measurement of H2O2within livingDrosophiladuring aging using a ratiometric mass spectrometry probe targeted to the mitochondrial matrix.Cell Metab..13, 340-350.
Costantini, D.(2008). Oxidative stress in ecology and evolution: lessons from avian studies.Ecol. Lett.11, 1238-1251.
Dai, D.-F., Chiao, Y. A., Marcinek, D. J., Szeto, H. H. and Rabinovitch, P. S. (2014). Mitochondrial oxidative stress in aging and healthspan. Longev
Healthspan3, 6.
Day, B. J.(2014). Antioxidant therapeutics: Pandora’s box.Free Rad. Biol. Med.66,
58-64.
Journal
of
Experimental
Drechsel, D. A. and Patel, M.(2010). Respiration-dependent H2O2removal in brain mitochondria via the thioredoxin/peroxiredoxin system. J. Biol. Chem. 285, 27850-27858.
Geiser, F.(2004). Metabolic rate and body temperature reduction during hibernation and daily torpor.Annu. Rev. Physiol.66, 239-274.
Genova, M. L. and Lenaz, G.(2014). Functional role of mitochondrial respiratory supercomplexes.Biochim. Biophysic. Acta - Bioenergetics1837, 427-443. Goncalves, R. L. S., Quinlan, C. L., Perevoshchikova, I. V., Hey-Mogensen, M.
and Brand, M. D.(2015). Sites of superoxide and hydrogen peroxide production by muscle mitochondria assessedex vivounder conditions mimicking rest and exercise.J. Biol. Chem.290, 209-227.
Jensen, P. K.(1966). Antimycin-insensitive oxidation of succinate and reduced nicotinamide-adenine dinucleotide in electron-transport particles I. pH dependency and hydrogen peroxide formation. Biochim. Biophys. Acta122, 157-166.
Lopert, P. and Patel, M.(2014). Nicotinamide nucleotide transhydrogenase (Nnt) links the substrate requirement in brain mitochondria for hydrogen peroxide removal to the thioredoxin/peroxiredoxin (Trx/Prx) system.J. Biol. Chem.289, 15611-15620.
Loschen, G., Flohé, L. and Chance, B.(1971). Respiratory chain linked H2O2 production in pigeon heart mitochondria.FEBS Lett.18, 261-264.
Mailloux, R. J. and Treberg, J. R.(2016). Protein S-glutathionlyation links energy metabolism to redox signaling in mitochondria.Redox Biol.8, 110-118. Ma, Y. L., Zhu, X., Rivera, P. M., Tøien, O., Barnes, B. M., LaManna, J. C., Smith,
M. A. and Drew, K. L.(2005). Absence of cellular stress in brain after hypoxia induced by arousal from hibernation in Arctic ground squirrels.Am. J. Physiol.
Regul. Integr. Comp. Physiol..289, R1297-R1306.
Mason, S. and Wadley, G. D.(2014). Skeletal muscle reactive oxygen species: a target of good cop/bad cop for exercise and disease.Redox Rep.19, 97-106. Monaghan, P., Metcalfe, N. B. and Torres, R.(2009). Oxidative stress as a
mediator of life history trade-offs: mechanisms, measurements and interpretation.
Ecol. Lett.12, 75-92.
Moreno-Loshuertos, R., Acın-Pé ́rez, R., Fernández-Silva, P., Movilla, N., Pé rez-Martos, A., Rodriguez de Cordoba, S., Gallardo, M. E., Enrıquez, J. A., Acin-́
Perez, R., Fernandez-Silva, P. et al. (2006). Differences in reactive oxygen species production explain the phenotypes associated with common mouse mitochondrial DNA variants.Nat. Genet.38, 1261-1268.
Morin, P. Jr and Storey, K. B.(2007). Antioxidant defense in hibernation: cloning and expression of peroxiredoxins from hibernating ground squirrels,
Spermophilus tridecemlineatus.Arch. Biochem. Biophys.461, 59-65.
Munro, D., Banh, S., Sotiri, E., Tamanna, N. and Treberg, J. R.(2016). The thioredoxin and glutathione-dependent H2O2consumption pathways in muscle mitochondria: Involvement in H2O2metabolism and consequence to H2O2efflux assays.Free Rad. Biol. Med.96, 334-346.
Orr, A. L., Lohse, L. A., Drew, K. L. and Hermes-Lima, M.(2009). Physiological oxidative stress after arousal from hibernation in Arctic ground squirrel.Comp.
Biochem. Physiol.153, 213-221.
Orr, A. L., Vargas, L., Turk, C. N., Baaten, J. E., Matzen, J. T., Dardov, Attle, S. J, Quackenbush, D. C., Goncalves, R. L. S., Perevoshchikova, I. V. et al.(2015). Suppressors of superoxide production from mitochondrial complex III.Nat. Chem.
Biol.11, 834-836.
Palomero, J., Pye, D., Kabayo, T., Spiller, D. G. and Jackson, M. J.(2008). In situ detection and measurement of intracellular reactive oxygen species in single isolated mature skeletal muscle fibers by real time fluorescence microscopy.
Antioxid. Redox Signal.10, 1463-1474.
Powers, S. K. and Jackson, M. J.(2008). Exercise-induced oxidative stress: cellular mechanisms. and impact on muscle force production.Physiol. Rev.88, 1243-1276.
Quinlan, C. L., Treberg, J. R., Perevoshchikova, I. V., Orr, A. L. and Brand, M. D. (2012). Native rates of superoxide production from multiple sites in isolated mitochondria measured using endogenous reporters.Free Rad. Biol. Med.53, 1807-1817.
Scherz-Shouval, R. and Elazar, Z.(2011). Regulation of autophagy by ROS: physiology and pathology.Trends in Biochem. Sci.36, 30-38.
Sies, H.(2014). Role of metabolic H2O2generation: redox signaling and oxidative stress.J. Biol. Chem.289, 8735-8741.
Somero, G. N. (2002). Thermal physiology and vertical zonation of intertidal animals: optima, limits, and costs of living.Integr. Comp. Biol.42, 780-789. Staples, J. F.(2014). Metabolic suppression in mammalian hibernation: the role of
mitochondria.J. Exp. Biol.217, 2032-2036.
Staples, J. F.(2016). Metabolic flexibility: hibernation, torpor, and estivation.Compr.
Physiol.6, 737-771.
Starkov, A. A. (2008). The role of mitochondria in reactive oxygen species metabolism and signaling.Annal. New York Acad. Sci.1147, 37-52.
Starkov, A. A., Andreyev, A., Zhang, S. F., Starkova, N., Korneeva, M., Syromyatnikov, M. and Popov, V. N.(2014). Scavenging of H2O2by mouse brain mitochondria.J. Bioenerg. Biomembr.46, 471-477.
Switala, J. and Loewen, P. C.(2002). Diversity of properties among catalases.
Arch. Biochem. Biophys.401, 145-154.
Tøien, Ø., Drew, K. L., Chao, M. L. and Rice, M. E.(2001). Ascorbate dynamics and oxygen consumption during arousal from hibernation in Arctic ground squirrels.Am. J. Physiol. Regul. Integr. Comp. Physiol.281, R572-R583. Treberg, J. R., Quinlan, C. L. and Brand, M. D.(2010). Hydrogen peroxide efflux
from muscle mitochondria underestimates matrix superoxide production - a correction using glutathione depletion.FEBS J.277, 2766-2778.
Treberg, J. R., Munro, D., Banh, S., Zacharias, P. and Sotiri, E. (2015). Differentiating between apparent and actual rates of H2O2metabolism by isolated rat muscle mitochondria to test a simple model of mitochondria as regulators of H2O2concentration.Redox Biol.5, 216-224.
Trushina, E. and McMurray, C. T.(2007). Oxidative stress and mitochondrial dysfunction in neurodegenerative diseases.Neuroscience145, 1233-1248. Zoccarato, F., Cavallini, L. and Alexandre, A.(2004). Respiration-dependent
removal of exogenous H2O2in brain mitochondria: inhibition by Ca2+.J. Biol.
Chem.279, 4166-4174.
Journal
of
Experimental