RESEARCH ARTICLE
The rebound of the body during uphill and downhill running at
different speeds
A. H. Dewolf1, L. E. Pen
̃
ailillo2and P. A. Willems1,*
ABSTRACT
When running on the level, muscles perform as much positive as negative external work. On a slope, the external positive and negative work performed are not equal. The present study analysed how the ratio between positive and negative work modifies the bouncing mechanism of running. Our goals are to: (1) identify the changes in motion of the centre of mass of the body associated with the slope of the terrain and the speed of progression, (2) study the effect of these changes on the storage and release of elastic energy during contact and (3) propose a model that predicts the change in the bouncing mechanism with slope and speed. Therefore, the ground reaction forces were measured on 10 subjects running on an instrumented treadmill at different slopes (from−9 to +9 deg) and different speeds (between 2.2 and 5.6 m s−1). The movements of the centre of mass of the body and its external mechanical energy were then evaluated. Our results suggest that the increase in the muscular power is contained (1) on a positive slope, by decreasing the step period and the downward movements of the body, and by increasing the duration of the push, and (2) on a negative slope, by increasing the step period and the duration of the brake, and by decreasing the upward movement of the body. Finally, the spring-mass model of running was adapted to take into account the energy added or dissipated each step on a slope.
KEY WORDS: Locomotion, Running, Bouncing mechanism, Slope, External work
INTRODUCTION
When running on the level at a constant average speed, the mechanical energy of the centre of mass of the body (COM) oscillates throughout the step like a spring-mass system bouncing on the ground (Cavagna et al., 1976). During the rebound of the body, the muscle–tendon units (MTU) of the supporting lower limb undergo a stretch–shortening cycle during which part of the mechanical energy of the COM is absorbed during the negative work phase to be restored during the next positive work phase (Cavagna et al., 1988).
When running on the level, the upward and downward movements of the COM are equal, and the positive and negative work done each step to sustain its movements relative to the surroundings are equal (i.e.Wextþ ¼Wext). When running on a slope,
muscles are compelled to produce or dissipate energy to increase or decrease the potential energy of the COM (DeVita et al., 2008). In this case, the spring-mass model is not suitable anymore because the ratio between positive and negative work increases or decreases with the slope of the terrain (Minetti et al., 1994). Several aspects of the mechanics of human running uphill and downhill have been studied these last decades: e.g. the muscular work done, the energy consumed and the muscular efficiency at different slopes (Minetti et al., 1994), the net muscular moment and power at the hip, knee and ankle during uphill running (Roberts and Belliveau, 2005), and the possible elastic energy storage and recovery in the arch and Achilles’tendon while running uphill and downhill (Snyder et al., 2012).
To our knowledge, the change in the bouncing mechanism while running on a slope at different speeds has never been analysed. Indeed, this mechanism will be affected by the ratio between positive and negative work. Between 2.2 and 3.3 m s−1, this ratio changes with the slope of the terrain, but not with the speed of progression (Minetti et al., 1994). However, to the best of our knowledge, this ratio has never been measured while running on a slope at higher speeds.
To analyse the bouncing mechanism, we have measured the three components of the ground reaction force (GRF) of 10 subjects running on an inclined treadmill (from −9 to +9 deg, in 3 deg increments) at 10 different speeds (from 2.2 to 5.6 m s−1). From these curves, we have analysed (1) the different periods of the running steps, (2) the vertical movements of the COM and (3) the energy fluctuations of the COM in order to understand how the bouncing mechanism of running deviates from the spring-mass model with slope and speed. We believe that three aspects of this mechanism will be affected.
First, from a mechanical point of view, a spring-mass system bouncing vertically on the ground oscillates around an equilibrium point at which the vertical component of the GRF (Fv) is equal to body weight (BW) (Cavagna et al., 1988). This is true whatever the slope; indeed, when running in steady state, the average vertical velocity of the COM (Vv) does not change from one step to the next. Consequently, the average vertical acceleration of the COMav¼0 and the average forceFv¼BW. The step period (T) can thus be divided into two parts: the first during whichFv>BW (tce), taking place during the contact of the foot on the ground, and the second during whichFv≤BW (tae), taking place during both ground contact and the aerial phase. The periodtcecorresponds to the half period of the oscillation of the bouncing system. During tae, the bouncing model is not valid when the body leaves the ground.
When running on a flat terrain at speeds up to∼3.1 m s−1,t ce≈tae (symmetric step). As speed increases above 3.1 m s−1,t
aebecomes progressively greater thantce (asymmetric step). This asymmetry arises from the fact that, when speed increases, the average vertical acceleration during tce (i.e. av;ce) becomes greater than the acceleration of gravity (g) whereas duringtae,av;ae cannot exceed
Received 11 May 2016; Accepted 14 May 2016
1
Laboratory of Biomechanics and Physiology of Locomotion, Institute of NeuroScience, Universitécatholique de Louvain, 1348 Louvain-la-Neuve, Belgium.
2
Exercise Science Laboratory, School of Kinesiology, Faculty of Medicine, Universidad Finis Terrae, Providencia, Santiago 7500000, Chile.
*Author for correspondence ( patrick.willems@uclouvain.be)
P.A.W., 0000-0002-5283-4959
Journal
of
Experimental
1g. Consequently, a longertaeis necessary to dissipate and restore the momentum lost and gained duringtce. At a given speed for a giventce, the asymmetric step requires a greaterav;ce; however, the increase in the step period due to a longertaeresults in a smaller internal power necessary to reset the limbs at each step (Cavagna et al., 1988).
When running on a positive slope, muscles are performing more positive than negative work. We expect that in order to contain the increase in muscular forces duringtce, the step remains symmetric
above 3.1 m s−1andTbecomes shorter than during running on the level. In contrast, when running on a negative slope, muscles are performing more negative work. Because muscles are able to develop higher forces during eccentric contractions, we expect that T is tuned to contain the internal power, rather than the force during tce. Consequently, T should become longer than during running on the level and the step should become asymmetric below 3.1 m s−1.
Second, when running on a flat terrain, the momentums lost and gained over a step are equal, andVv=0. Consequently, the upwards and downwards vertical displacements of the COM (S+andS−) are equal. On the contrary, when running on a slope, Vv=0 and S+≠S−. We expect that the dissimilarity betweenS+andS−will be the main factor affecting the bouncing mechanism. We also expect that S− in uphill and S+ in downhill running will progressively disappear and with it the amount of energy that can potentially be stored in the MTU.
Third, on a flat terrain, the energy that is due to the vertical movements of the COM (Ev) and the energy that is due to its horizontal movements (Ef) are fluctuating in phase (Cavagna et al., 1976), and the negative and positive work done are approximately equal:Δ+E
f≈Δ−EfandΔ+Ev≈Δ−Ev. However, when running on a slope,Δ+E
f≈Δ−EfbutΔ+Ev≠Δ−Ev. We expect that (1) because of this imbalance, the fluctuations ofEfandEvare no longer in phase and, consequently, (2) an energy exchange occurs between these two curves. Therefore, we have evaluated the duration of the positive and negative work phases and the energy transduction betweenEfandEvduring the period of contacttc(Cavagna et al., 2008a).
We hypothesize that the three aspects described here above will jeopardize the bouncing mechanism of running and in turn, the possibility to store and release elastic energy into the elastic structures of the lower limb. However, we also hypothesize that the disappearance of this mechanism is intended to restrain the increase inWextþ orWext that is due to slope.
Finally, we propose a model that describes the vertical oscillations of the COM duringtcewhile running on a slope. The aim of this model is to understand how all of the lower-limb muscles are tuned to generate the basic oscillation of the bouncing system. The spring-mass system bouncing on the ground that models running on the level (Blickhan, 1989; Cavagna et al., 1988) cannot describe running on a slope because energy must be added or dissipated. Therefore, we have incorporated an actuator in the spring-mass model that will generate a force proportional toVvand produce or absorb energy during contact.
MATERIALS AND METHODS
Subject and experimental procedure
Ten recreational runners (three females and seven males) participated in the study (age: 31.8±8.3 years, mass: 68.8±10.2 kg, height: 1.78±0.07 m, mean±s.d.). Informed written consent was obtained from each subject. The studies followed the guidelines of the Declaration of Helsinki, and the procedures were approved by the Ethics Committee of the Université catholique de Louvain.
Subjects ran on an instrumented treadmill at seven different inclinations: 0, ±3, ±6 and ±9 deg. To neutralize the effect of learning and muscle fatigue, half of the subjects started with an inclination of 0 deg that was increased and the other half with an inclination of 9 deg that was decreased. At each slope, subjects ran at 10 speeds presented in a different order (8, 10, 11, 12, 13, 14, 15, 16, 18 and 20 km h−1, corresponding to 2.22, 2.78, 3.06, 3.33, 3.61, 3.89, 4.17, 4.44, 5.00 and 5.56 m s−1, respectively). Note that List of symbols and abbreviations
av vertical acceleration of the COM
av average vertical acceleration of the COM over a complete
number of steps
av;ce,av;ae average vertical acceleration of the COM duringtceandtae b constant depending of the initial conditions in the
spring-actuator-mass model BW body weight
c actuator coefficient in the spring-actuator-mass model COM centre of mass of the whole body
Eext mechanical energy of the COM
Ef,El,Ev energy due to the fore-aft, lateral and vertical movement
of the COM
Ef,min,Ev,min minimum of theEf–andEv–time curves
Ff,Fl,Fv fore-aft, lateral and vertical components of the GRF Fp,Fn component of the GRF parallel and normal to the treadmill
surface
Fv average vertical GRF over a complete number of steps GRF ground reaction force
k overall vertical stiffness of the leg-spring in the spring-actuator-mass model
L step length
MTU muscle–tendon unit RMSE root mean square error
S vertical displacement of the COM
S+,S− upward and downward displacement of the COM over a step
Sþa,Sa upward and downward displacement of the COM taking
place duringta
Sþc,Sc upward and downward displacement of the COM taking place duringtc
Smin minimum vertical displacement necessary to overcome
the slope each step
T step period
tc,ta contact time and aerial time
tce,tae effective contact time and effective aerial time tpush,tbrake duration of the positive and of the negative work phase Vbelt,Vbelt instantaneous and average velocity of the belt Vf,Vf instantaneous and average fore-aft velocity of the COM
relative to the belt
Vl instantaneous lateral velocity of the COM
Vv,Vv instantaneous and average vertical velocity of the COM
relative to the belt
Wextþ,Wext positive and negative external work done to sustain the
mechanical energy changes of the COM relative to the surroundings
Wext sum ofWextþ and the absolute value ofWext
Wfþ,Wf positive and negative work done to sustain the fore-aft
movement of the COM
Wlþ,Wl positive and negative work done to sustain the lateral movement of the COM
Wvþ,Wv positive and negative work done to sustain the vertical
movement of the COM
_
Wf,Wl_ ,Wv_ power spent to move the COM in the fore-aft, lateral and vertical directions
%R percentage of energy recovered through the transduction betweenEvandEf
θ slope of the treadmill
Journal
of
Experimental
for downhill running, the speed of the belt was limited by the manufacturer to 5.0 m s−1. At each slope, half the subjects started with the belt turning forwards to simulate uphill running and the other half with the belt turning backwards to simulate downhill running.
Data were recorded during a period of 3–10 s, depending of the speed and the inclination of the treadmill. Between 6 and 36 steps per trial were recorded; a total of 15,760 steps were analysed. On a +6 deg slope, one subject could not run at 5.6 m s−1, and on a +9 deg slope, one subject could not run at 5.0 m s−1and three could not run at 5.6 m s−1.
Experimental setup and data analysis
The instrumented treadmill (Fig. 1) consisted of a modified commercial treadmill (h/p/Comos-Stellar, Germany, belt surface: 1.6×0.65 m, mass:∼240 kg) combined with four force transducers (Arsalis, Belgium), designed on the principle described by Heglund (1981). Because the whole body of the treadmill (including the motor) was mounted on the transducers, these were measuring the
three components of the GRF exerted by the treadmill under the foot (Willems and Gosseye, 2013): Fp, the component parallel to the long axis of the tread surface;Fn, the component normal to the tread surface; andFl, the component in the lateral direction. The lowest frequency mode of vibration was >41 Hz forFp, 47 Hz forFnand 27 Hz for Fl. The non-linearity was <1% of full scale, and the crosstalk <1%. The fore-aft (Ff) and vertical (Fv) components of GRF were then computed as:
ðFf FvÞ ¼
cosu sinu sinu cosu
Fp
Fn
; ð1Þ
whereθis the angle between horizontal and the tread surface. The electrical motor was instrumented with an optical angle encoder to measure the speed of the belt (Vbelt). The average speed of the belt over a stride (Vbelt) differed by 2.8±1.4% (mean±s.d.) from the chosen speed and the instantaneousVbeltdid not change by more than 5% ofVbelt.
0 1000 2000
-1 0 1 2
–1 0 1
Downhill 6 deg Level 0 deg Uphill 6 deg
3.3 3.5 3.7
Time (400 ms)
–0.5 0 0.5
af
(
g
)
Ff
(N)
S
(m)
Vf
(m s
–1
)
Fv
(N)
BW a (v
g
)
0.1 Vv
(m s
–1
)
[image:3.612.50.405.275.713.2]–400 0 400
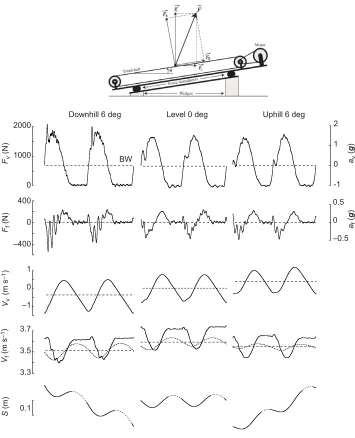
Fig. 1. Schema of the instrumented treadmill (top) and typical time traces of a subject running at∼3.6 m s−1on a−6 deg slope (left column), on the level (middle column) and on a +6 deg slope (right column).The schema at the top of the figure represents the instrumented treadmill. The whole body of the treadmill (including the motor) is mounted on four strain-gauge transducers attached to wedges.Fpis the
component parallel to the long axis of the treadmill surface,Fnthe component normal
to the tread surface andFlthe component in
the lateral direction (not represented here).θ is the angle between horizontal and the tread surface. The fore-aft (Ff) and vertical (Fv)
components of GRF are computed using Eqn 1. Traces from top to bottom. First and second row, left scale: verticalFvand
horizontalFfcomponents of the ground
reaction force exerted by the treadmill under the foot; right scale: acceleration of the COM:
av=(Fv−BW)/mandaf=Ff/m, where BW is the
body weight andmthe body mass. Third row: vertical velocity of the COM,Vv, relative
to a referential attached to the treadmill belt. The horizontal dashed line represents the average vertical velocity of the COM over the stride (Vv¼Vbeltsinu). Fourth row:Vfis the
fore-aft velocity of the COM. The dashed curve represents the instantaneous velocity of the belt in the fore-aft direction (−Vbelt
cosθ). The horizontal dashed line represents the average fore-aft velocity of the COM over the stride (Vf¼Vbeltcosu). Fifth row: vertical
displacement of the centre of massSdivided into contact phase (continuous line) and aerial phase (dotted line). Tracings were recorded on a subject of height 1.83 m, body mass 68.4 kg and age 24 years.
Journal
of
Experimental
The treadmill contained its own signal conditioning system: the GRF signals were amplified, low-pass filtered (4-pole Bessel filter with a−3 dB cut-off frequency at 200 Hz) and digitized by a 16-bit analog-to-digital converter at 1000 Hz. This system was connected to a PC via ethernet using TCP/IP (Genin et al., 2010). Acquisition and data processing were performed using custom-built software (LABVIEW 2010, National Instruments, Austin, TX, USA, and MATLAB 2013, MathWorks, Natick, MA, USA).
Division of the step
Steps were divided according to theFv–time curves (Fig. 1): a step started and ended whenFvbecame greater than BW. The effective contact time (tce) was the period during which Fv≥BW, and the effective aerial time (tae) was the period during which Fv<BW (Cavagna et al., 1988). The time of contact (tc) was the period during whichFv>10 N, and the aerial phase (ta) was the period during whichFv≤10 N. The step duration was then calculated as
T=tce+tae.
Measurement of the acceleration, velocity and vertical displacement of the COM
The acceleration (a), velocity (V) and displacement (S) of the COM and the external work done (Wext) were computed from the GRF using a method similar to that of Gosseye et al. (2010). Therefore, this method is only explained in brief.
These computations were done over strides (i.e. two steps, starting on the right foot). The fore-aft, lateral and vertical accelerations of the COM relative to the reference frame of the laboratory were calculated by dividingFf,FlandFvFvby the body massm(whereFvis the average vertical force over a stride). In theory, Fv¼BW (as explained in the Introduction); therefore, strides were analysed only ifFvwas within 5% of BW.
The time curves of the three components of awere integrated numerically to determine the fore-aft (Vf) lateral (Vl) and vertical (Vv) velocity of the COM, plus an integration constant, which was set on the assumption that the average velocity of the COM over a
stride was equal toVbeltcosufor Vf, to zero forVland Vbeltsinu forVv.
The vertical displacement of the COM (S) was then computed by time integration ofVv. The upward and downward displacements of the COM were divided according totc(Scþand Sc) andta(Saþand
S
a). The minimum vertical displacement (Smin) necessary to overcome the slope of the terrain each step can be computed by Smin¼VfTsinu, whereVf is the average running speed over the step andVfT is the step length.
Measurement of the positive and negative external work The external work (Wext) is the work necessary to move the COM relative to the surroundings plus the work done on or by the environment (Willems et al., 1995). It was measured from the work done by the GRF (Gosseye et al., 2010).
The power spent to move the COM in the fore-aft (W_f), lateral (W_l) and vertical (W_v) directions was computed, respectively, by:
_
Wf ¼Ff Vf; W_l¼FlVl and W_v¼FvVv: ð2Þ
In the fore-aft and vertical directions, the power spent by the subject on the belt or by the belt on the subject can be computed, respectively, by:
Ffvcosu and Fvvsinu; ð3Þ wherev¼VbeltVbeltrepresents the variation ofVbeltaroundVbelt. Because these terms represented less than 3% ofWext, they were neglected in this study.
The energies (Ef,ElandEv) that are due, respectively, to the fore-aft, lateral and vertical movements of the COM were computed by:
Ef ¼
ð
_
Wfdt; E1¼
ð
_
W1dt and Ev¼
ð
_
Wvdt; ð4Þ
and the total energy of the COM (Eext) by:
Eext¼
ð
ðW_f þW_lþW_vÞdt: ð5Þ
Uphill 3 deg
400 ms
Downhill 3 deg Downhill 6 deg Downhill 9 deg Uphill 6 deg Uphill 9 deg
200 J
Ef
Ev
Eext
Ef
Ev
[image:4.612.49.408.482.732.2]Eext
Fig. 2. Energy changes of the COM during a running stride.Mechanical energy–time curves of the COM during a stride on different slopes, while running at∼4.2 m s−1. In each panel, the upper curve (Ef) refers to the kinetic
energy that is due to the forward motion of the COM, the middle curve (Ev) to the sum of
the gravitational potential energy (interrupted line) and the kinetic energy that are due to the vertical motion of the COM, and the bottom curve (Eext=Ef+Ev) to the total energy of the
COM. The arrows pointing downwards indicate the minimum ofEfand the arrows pointing
upwards the minimum ofEvduring the contact
phase of the second step. The horizontal segments of the energy curves correspond to the aerial phase. Tracings are from the same subject as in Fig. 1.
Journal
of
Experimental
The positive and negative work over one step (Wfþ, W1þ, Wvþ,
Wþ
ext and Wf,W1,Wv,Wext) were computed as the sum of the positive and negative increments of the Ef, El, Ev and Eext curves, respectively (Fig. 2). Because Wl represents less than 1.5% of Wext, it is not presented separately in the results. The work per step was computed as the work over the stride divided by two.
Energy transduction betweenEfandEv
When running on the level, the Ef and Ev curves are in phase (Cavagna et al., 1976). However, when running on a slope, these curves could shift one relative to the other, allowing energy transduction between Ef and Ev (Fig. 2). The amount of energy recovered (%R) over the contact phase was computed as (Cavagna
et al., 2008a):
%R¼100W
þ
f þjWfjþWvþþjWvjþW1þþjW1jðWextþþjWextjÞ
Wþ
f þjWfjþWvþþjWvjþW1þþjW1j
:
ð6Þ
Modelling the vertical movement of the body bouncing system of running
When running on the level, the vertical movement of the COM duringtce can be compared with the movement of a spring-mass system bouncing vertically (Blickhan, 1989; Cavagna et al., 1988).
0 1
2 3 4 5
0 1 2 0 1
0 1 2
2 3 4 5 2 3 4 5 2 3 4 5 6
2 3 4 5
0 1
0 1
2 3 4 5 6
Uphill 3 deg Uphill 6 deg Uphill 9 deg
Downhill 3 deg Downhill 6 deg Downhill 9 deg
2 3 4 5
0 0.4 0.8
2 3 4 5 2 3 4 5 6
B
A
Uphill Downhill
3 deg 6 deg 9 deg
Wext
/
Wext
Wf+
Mass-specific mechanical work per unit distance (J kg
–1
m
–1
)
Average running speed (m s–1)
Wv+
Wv–
Wext+
Wext–
Wv+ Wv–
Wext+ Wext– Wf+
[image:5.612.48.398.235.732.2]–
Fig. 3. Mass-specific external work per unit distance as a function of speed at each slope.(A) At each slope, the mass-specific positive (closed symbols, superscript +) and negative (open symbols, superscript−) mechanical work done each step is given as a function of running speed.Wfis the work done
to accelerate or decelerate the COM (in this case,Wfþ¼Wf),Wvis the work to raise or
lower the COM andWextis the muscular work
actually done to sustain the movements of the COM relative to the surroundings. Symbols and bars represent the grand mean of the subjects (n=10, except for +6 deg at 5.6 m s−1and +9 deg at 5.0 m s−1wheren=9, and +9 deg at 5.6 m s−1wheren=7) and the standard
deviations (when the length of the bar exceeds the size of the symbol). In the middle row, the horizontal continuous lines represent the minimum work done to overcome the slope and the dashed lines represent the work done during running on the level; these last lines were drawn through the experimental data (weighted mean, Kaleidagraph 4.5). (B)
Wext=Wextas a function of speed. The open
diamonds indicate negative slopes whereas the closed diamonds indicate positive slopes.
Journal
of
Experimental
In this case, the balance of force is given by:
FvBW¼kS; ð7Þ
wherekis the overall stiffness generated by the lower-limb muscles. To describe the vertical movement of the COM during running on a slope, Eqn 7 was implemented by incorporating an actuator parallel to the spring. This actuator generates a force proportional to the magnitude ofVv:
FvBW¼bþkSþcVv; ð8Þ
wherebis a constant depending on the vertical velocity of the COM at touch down andcis the actuator coefficient. The coefficientcis positive when running uphill and negative when running downhill. In this way, the power developed by the actuator force (cVv2) is positive in uphill running, showing that the actuator works like a motor giving energy to the body, and negative in downhill running, showing that the actuator works like a damper absorbing energy (see insets in Fig. 7A).
At each instantioftce(which represents the half-period of the oscillation of the system), the vertical acceleration (av) of the massm
was computed by:
avðiÞ ¼F
vðiÞ BW
m ¼ mbmkSðiÞ þmcVvðiÞ; ð9Þ
whereav(i),Vv(i) andS(i) were the experimental data at instanti. In this way,n equations were produced, wheren is the number of samples during contact. This set of equations resulted in an over-constrained system, from which the constant (b/m), the mass-specific stiffness (k/m) and the actuator coefficient (c/m) were computed by a regression analysis using singular value decomposition that minimizes the sum of squared errors.
For running on the level, we also compared the values obtained from Eqns 7 and 8. In Eqn 8,c/mis close to zero andk/mdiffers by 1.8±2.1% (mean±s.d.,n=2440) from Eqn 7.
The goodness of the spring-actuator-mass model was assessed by computing (1) the variance explained by the regression model (r2), and (2) the root mean square error (RMSE), which expresses the agreement between the measured and the computed values of the GRF.
2 3 4 5 6
2 3 4 5 6
0 0.2 0.4 0 0.2 0.4
2 3 4 5 2 3 4 5
T
tce tae Uphill 3 deg Uphill 6 deg Uphill 9 deg
T
ime (s) Downhill 3 deg Downhill 6 deg Downhill 9 deg
ta
T
0 1
2 3 4 5 2 3 4 5
0 1
av,ce Uphill 3 deg Uphill 6 deg Uphill 9 deg
Downhill 3 deg Downhill 6 deg Downhill 9 deg av,ce
A
B
A
v
erage vertical acceleration (
g
)
[image:6.612.51.385.312.730.2]Average running speed (m s–1)
Fig. 4. Step duration and average vertical acceleration of the COM as a function of speed at each slope.(A) At each slope, the filled squares indicate the step period (T), the open triangles the effective contact time (tce) and the closed triangles
the effective aerial time (tae). The red lines represent
the aerial time (ta). The dashed lines are the results
obtained on the level forT,tce,taeandta(weighted
mean, Kaleidagraph 4.5). (B) At each slope, the open triangles indicate the average vertical acceleration of the COM during the effective contact time (av;ce). Dashed lines are the results obtained
on the level and the horizontal dotted line represents 1g. Other indications as in Fig. 3.
Journal
of
Experimental
Statistics
Data were grouped into speed–slope classes. To obtain one value per subject in each class, the steps of the same subject in a same class were averaged. The mean and standard deviation of the runner population were then computed in each class (grand mean). A two-way ANOVA withpost hocBonferroni correction (PASW Statistics 19, SPSS, IBM, Armonk, NY, USA) was performed to assess the individual and interaction effects of speed and slope on the calculated variables (P-values were set at 0.05).
RESULTS
Effect of slope on the ratio between positive and negative work done
The mass-specific external work done per unit distance is plotted in Fig. 3A. In the fore-aft direction, the work done to move the COM horizontally (Wf) increases similarly with speed at any slope (P=0.995). Moreover, because subjects move at a constant speed,
Wþ
f ¼Wf.
Therefore, the imbalance betweenWextþ andWext on a slope is only due to a modification inWvþandWv. During uphill running,Wvþ increases, while Wv decreases and tends to disappear above
∼4.4 m s−1at +6 deg and above∼3.3 m s−1at +9 deg. On a negative slope,Wvþtends to disappear above∼5.0 m s−1at−6 deg and above
∼4.2 m s−1at−9 deg.
Note that the ratioWext= Wextchanges with slope (P<0.001), but is independent of speed (P=0.17):Wext= Wextequals 0.5 at 0 deg, but decreases monotonically below 0.5 on a negative slope and increases monotonically above 0.5 on a positive slope (Fig. 3B).
Effect of slope and speed on step period
The step period (T) is given as a function of running speed in Fig. 4A. The slope has a significant effect on the step period (P<0.001):Tdecreases when running uphill, whereas it increases when running downhill. The effect of slope onTis more marked on positive than on negative slopes, though this effect is significant at all slopes (Bonferronipost hoc,P<0.01). The slope does not affect the effective contact time tce, except at +9 deg (Bonferronipost hoc,P<0.01). Thus, the change inTis mainly due to a change intae(P<0.001), which in turn, is largely due to a change inta.
When running on the level, the step is symmetric (i.e.tae≈tce) at speeds up to ∼2.8 m s−1 (Bonferroni post hoc, P<0.01). These results are consistent with those reported in the literature (Cavagna et al., 1988; Schepens et al., 1998). When running uphill,tae≈tcein a larger range of speeds because the mean vertical acceleration duringtce(av;ce) is kept smaller than 1gat higher speeds than on the level (Fig. 4B): up to∼3.3 m s−1at +3 deg, to∼3.9 m s−1at +6 deg and to 5.6 m s−1at +9 deg. When running downhill, the difference
2 3 4 5 2 3 4 5 6
2 3 4 5
0 0.1 0.2 0 0.1 0.2
0 0.1 0 0.1
2 3 4 5 2 3 4 5 2 3 4 5 6
S+
Uphill 3 deg Uphill 6 deg Uphill 9 deg
Downhill 3 deg Downhill 6 deg Downhill 9 deg
S– S–
S+
Sa –
Sc Sa
+
Sc+
V
e
rtical displacement of the COM (m)
Average running speed (m s–1)
[image:7.612.50.386.341.732.2]–
Fig. 5. Vertical displacement of the COM as a function of speed at each slope.At each slope, the filled squares indicate the upward (S+, upper panel) and downward (S−, bottom panel) vertical displacement of the COM. The grey zone (Sa)
represents the fraction of the vertical displacement taking place during the aerial phase, whereasScis
the vertical displacement taking place during the contact phase. The dashed lines indicateSduring level running. The continuous line representsSmin, the minimum vertical displacement to overcome the slope during the step. Note thatSminincreases
with speed because the step length increases. Other indications as in Fig. 3.
Journal
of
Experimental
betweentae andtcetends increase becauseav;ce becomes >1gat speeds lower than those on the level. Consequently, the range of speeds at whichtae≈tcebecomes narrower, i.e. below∼2.2 m s−1at
−6 and−9 deg.
Effect of slope and speed on the upward and downward displacements of the COM
On the level, the upward (S+) and downward (S−) displacements of the COM over one step are equal (Fig. 5). On a slope, the difference betweenS+andS−increases with inclination (P<0.001).
When running uphill,S+increases with slope and speed. At slow speeds, the displacement upwards during the aerial phase (Saþ) is almost nil, whatever the slope. When speed increases,Saþrepresents a greater part ofS+. The displacement downwards (S−) decreases when slope and speed increase: S− disappears above 5.0 m s−1 at +6 deg and above 3.9 m s−1at +9 deg. Note that the reduction of S−is first due to a reduction ofS
a. At +6 deg and +9 deg,Sais almost nil at all speeds, suggesting thatVvat touchdown is close to zero.
When running downhill, the opposite phenomenon is observed: S−increases andS+decreases with slope and speed. The effect of slope and speed is more marked onS−when running downhill than onS+when running uphill. When running downhill,S
a represents a significant part ofS−, whereasSaþis almost nil whatever the slope and speed, indicating thatVvat take-off is close to zero.
Effect of slope and speed on the energy fluctuations of the COM
When running on a slope, muscles are compelled to modify the ratio between concentric and eccentric contraction. Consequently, the timing of negative and positive work production during tc is modified (Fig. 6A). The time during which muscles perform negative external work (tbrake) is extended during downhill running (P<0.001) while the duration of the positive work phase (tpush) is increased during uphill running (P<0.001). Because at a given speed, tc does not change significantly with slope (Fig. 6A), the modification of tbrake is compensated by an opposite change intpush.
–9 –6 –3 0 3 6 9 –9 –6 –3 0 3 6 9
0 0.1 0.2 0.3
–9 –6 –3 0 3 6 9
-9 -6 -3 0 3 6
9 Begin tc Ev,min Ef,min End tc
0 10 20
–9 –6 –3 0 3 6 9
–50 0 50 100 150
–9 –6 –3 0 3 6 9
5.0 m s–1 2.2 m s–1
3.6 m s–1
Recovery (%) Time (% of tc,e)
Slope (deg)
T
ime (s)
B
C
A
tc tpush
tbrake
Slope (deg)
2.2 m s–1 3.6 m s–1 5.0 m s–1 Fig. 6. Contact time and energy transduction
betweenEfandEvduring the contact phase as a
function of slope at low, intermediate and fast speeds.(A) In each panel, the contact time (tc, filled
squares) is plotted as a function of slope and is divided into the time during which muscles perform positive external work (tpush, filled circles) and the time
during which muscles perform negative external work (tbrake, open circles). The vertical dashed lines
correspond to running on the level. The dotted lines are drawn through the data (weighted mean, Kaleidagraph 4.5). (B) The abscissa represents the relative time expressed as a percentage oftceand the ordinate represents the different slopes studied. Filled and open squares correspond, respectively, to the touchdown and take-off. The vertical dashed lines represent the beginning and end oftce. Note that the period between touchdown and the beginning oftce
and the period between the end oftceand take-off
change little with slope. Both theEfand theEvcurves
decrease during the first part of contact, and increase during the second part (Fig. 2). The open and filled symbols represent, respectively, the time at which the
EvandEfcurves reach a minimum (Ev,minandEf,min).
The grey zone illustrates the period during which an energy transduction betweenEvandEfis possible
because one curve is still decreasing while the other has begun to increase. Note that the instant ofEf,min
changes little with slope. As compared with level running,Ev,minappears earlier in the stride on positive
slopes and later on negative slopes. (C) The amount of energy recovered during the phase encompassed between the two minima ofEfandEv, computed by
Eqn 6, is presented at each slope for the three speeds. The horizontal dashed lines correspond to running on the level. Other indications as in Fig. 3.
Journal
of
Experimental
[image:8.612.48.383.289.734.2]The relative time of occurrence of the minimum of Ef (Ef,min) changes little with slope [see Figs 2 (arrows) and 6B]. On the contrary, the minimum of Ev (Ev,min) appears relatively earlier during contact in uphill running and later in downhill running. The effect of the slope on the relative time of occurrence ofEv,minis more accentuated when speed increases. Between Ef,min and Ev,min, theEfandEvcurves (grey zone in Fig. 6B) are out of phase and an energy exchange can occur from Ef to Ev when Ev,min precedes Ef,min, and fromEv to Ef whenEf,min precedesEv,min. This exchange of energy allows recovery of a significant amount of energy (i.e. %R>10%) only on steep slopes and at speeds >3.6 m s−1(Fig. 6C).
Modelling running on a slope
When running on a slope, the lower-limb muscles can be modelled as a mass mounted on a spring in parallel with an actuator that generates a muscular driving force proportional to the vertical velocity of the COM and produces (uphill) or absorbs (downhill) energy duringtce. The overall mass-specific stiffnessk/mand the actuator coefficient c/m generated by the lower-limb muscles (Fig. 7B) are modified by both the slope of the terrain and the speed of progression (P<0.001). Compared with at 0 deg,k/mdecreases on a positive slope and increases on a negative slope. At a given slope, k/mincreases with velocity, though the effect of speed is greater on negative than positive slopes (P<0.001).
During level running, the complex musculoskeletal system of the lower limb behaves like a single linear spring and c/m is nil. Running uphill requires additional energy to overcome the slope. In this case, c/m is positive and increases with the mechanical demands, i.e. with increasing slope but also with increasing speed. On the contrary, running downhill requires dissipation of energy. Consequently,c/mis negative and its absolute value increases when slope becomes steeper and when speed increases. Note also that the effect of speed onc/mis greater on negative than on positive slopes (P<0.001).
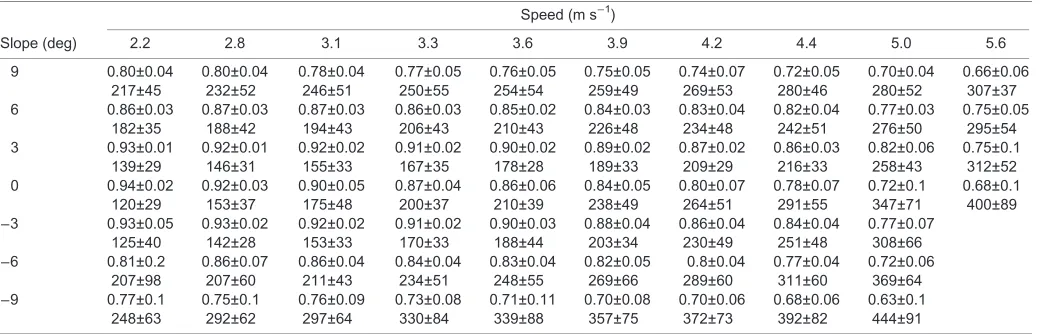
This model describes the basic vertical oscillation of the COM during running on a slope (Fig. 7A) without taking into account the first peak in theFvcurve as a result of foot slap (Alexander et al., 1986; Schepens et al., 2000) and the vibrations of the treadmill motor (Fig. 1); ther2of the least square method is always >0.63 and RMSE ranges between 120 and 440 N (Table 1).
DISCUSSION
This study was intended to help understand how the bouncing mechanism is modified when the slope of the terrain becomes positive or negative. Our results show that the bouncing mechanism still exists on shallow slopes and progressively disappears when the slope increases. This mechanism disappears earlier on positive than on negative slopes and earlier at high speeds than at slow speeds. In this section, we will discuss how 100
400 700
2 3 4 5
–40 –20 0 20
2 3 4 5 2 3 4 5 6
Uphill
Downhill
3 deg 6 deg 9 deg
0 0.04 0.08
R2=0.87
RMSE=198
0 0.04 0.08
R2=0.88
RMSE=186 0
1000 2000
0 0.04 0.08
R2=0.83
RMSE=238
Downhill 6 deg Level 0 deg Uphill 6 deg
V
e
rtical force (N) BW
Uphill Downhill
A
B
Vertical displacement of the COM (m)
Average running speed (m s–1)
V
e
rtical stif
fness (s
–2
)
Damping coef
ficient (s
–1
[image:9.612.50.398.57.438.2])
Fig. 7. Mechanical model of running on a slope.(A) Typical trace of the vertical forceFv
during the contact period (tc) plotted as a function
of vertical displacementSduring running at ∼3.6 m s−1. The left panel corresponds to running at−6 deg, the middle panel to 0 deg and the right panel to +6 deg. The upwards arrow indicates the downward movement of the COM taking place during the first part oftc; the
downwards arrow indicates the upward movement of the COM taking place during the second part oftc. The black dashed line
corresponds toFv=BW. The red dashed line
corresponds to the predicted value ofFv
computed using Eqn 9 duringtceusing the values
ofb,kandcobtained by the regression analysis. Tracings are from a male subject (height: 1.83 m, body mass: 70.0 kg, age: 31 years). Ther2and
RMSE values are indicated on each trace. The insets illustrate the model used in downhill (a spring in parallel with a damper), level (a single spring) and uphill (a spring in parallel with a motor) running. (B) The upper row presents the mass-specific vertical stiffnessk/mas a function of speed, and the lower row the mass-specific coefficientc/mof the actuator. The left column corresponds to a slope of 3 deg (open circles for downhill running and filled circles for uphill running), the middle column to a slope of 6 deg and the left column to 9 deg. Dashed lines correspond to level running. The dotted lines are drawn through the data (weighted mean, Kaleidagraph 4.5). Other indications as in Fig. 3.
Journal
of
Experimental
the step period, the vertical movement of the COM and the energy fluctuation of the COM affect the bouncing mechanism of running. We will also show that these variables are tuned to contain the increase in the positive or negative muscular work and power that is due to slope. We finally discuss the quality and limits of the mechanical model describing the vertical movement of the COM during slope running.
Change in step period with slope
Minetti et al. (1994) show that on a positive slope the step periodT decreases significantly, whereas on a negative slope T tends to increase (though this increase is not significant). Our results confirm that, at a given speed,Tis shorter when running uphill than when running on the level. On the contrary, during downhill running, our results show a significant increase inT, even if this change is less marked than on a positive slope. This discrepancy with the results of Minetti and colleagues may be explained by the fact that the number of steps analysed here (n=15,760 steps) is higher than that in Minetti’s study (n=418 steps).
In our study, we observe thattc(Fig. 6A) andtce(Fig. 4A) at a given speed do not change significantly with slope, in both downhill and uphill running (except at +9 deg at the highest speeds). The change in the step periodTis thus mainly due to a change inta, which in turn changestae.
As shown by Cavagna et al. (1991), running on flat terrain with a long effective aerial phase is a convenient strategy to decrease the average power developed over the step, provided that muscles are able to develop enough power during the push. Our results suggest that the changes in tae are intended to contain the additional muscular power due to the slope.
When running uphill as compared with running on the level,T decreases because tae is reduced. Because tceis not modified by slope, the step remains symmetric (i.e.tce≈tae) at higher speeds than on flat terrain. These results are similar to those obtained when running on the level in hyper-gravity (Cavagna et al., 2005): at 1.3g, the rebound remains symmetric up to 4.4 m s−1.
At a given speed and for a giventce, a symmetric rebound results in a shorter step than does an asymmetric rebound. As a result, the minimal height (Smin) that the COM must gain each step is smaller, the impact against the ground is reduced and the force and power
during the push are decreased (Cavagna et al., 1991). However, decreasingTresults in a greater internal power to move the limb segments relative to the COM.
Snyder and Farley (2011) have observed that the optimal step period at which the oxygen consumption is minimal does not change for slopes between−3 and +3 deg. However, these authors show that the freely chosen Tdecreases slightly between 0 and 3 deg. This decrease in T might be a strategy to contain the mechanical power during the push.
The changes observed in uphill running are similar to those observed in old men running (Cavagna et al., 2008b). In older subjects, the average upward acceleration (av;ce) is lower than in younger ones, leading to a symmetric rebound. According to these authors, the lower force attained during contact by the old subjects may be explained in part by the loss of muscular strength (e.g. Doherty, 2003). Similarly, the strategy adopted while running uphill could be due to the limits set by the muscular strength and/or power. Furthermore, in uphill running, the GRF vector is farther from the leg joint centres (DeVita et al., 2007). Thus, the slope of the terrain alters the muscle mechanical advantage by creating longer lever arms, and leads to higher joint torques and power outputs (Roberts and Belliveau, 2005). Therefore, decreasingTmight be a beneficial strategy to limit the muscular moments and to reduce the mechanical load applied to the MTU.
At the opposite, when running downhill,Tincreases as compared with running on the level becausetaeincreases. Becausetceis not modified, steps are asymmetric (i.e.tce<tae) at lower speeds than on a flat terrain. These results are similar to those obtained when running in unweighted conditions (Sainton et al., 2015): when BW is reduced by 40%,tcremains unchanged whiletais increased.
[image:10.612.48.570.73.240.2]The step asymmetry has the physiological advantage to limit the internal power. However, this asymmetry requires a greater av;ce and, consequently, a greater power during tce. The choice of this strategy in downhill running may be due to the difference in force exerted during negative and positive work phases: during downhill running, muscles contract mainly eccentrically, allowing the development of higher forces. Moreover, in downhill running, runners land with the leg more extended (Leroux et al., 2002), resulting in reduction of the lever arms of the GRF about the lower-limb joints and thus of the net muscular moments.
Table 1. Coefficient of determination and root mean square error (RMSE) of the model
Speed (m s−1)
Slope (deg) 2.2 2.8 3.1 3.3 3.6 3.9 4.2 4.4 5.0 5.6
9 0.80±0.04 217±45 0.80±0.04 232±52 0.78±0.04 246±51 0.77±0.05 250±55 0.76±0.05 254±54 0.75±0.05 259±49 0.74±0.07 269±53 0.72±0.05 280±46 0.70±0.04 280±52 0.66±0.06 307±37 6 0.86±0.03 182±35 0.87±0.03 188±42 0.87±0.03 194±43 0.86±0.03 206±43 0.85±0.02 210±43 0.84±0.03 226±48 0.83±0.04 234±48 0.82±0.04 242±51 0.77±0.03 276±50 0.75±0.05 295±54 3 0.93±0.01 139±29 0.92±0.01 146±31 0.92±0.02 155±33 0.91±0.02 167±35 0.90±0.02 178±28 0.89±0.02 189±33 0.87±0.02 209±29 0.86±0.03 216±33 0.82±0.06 258±43 0.75±0.1 312±52 0 0.94±0.02 120±29 0.92±0.03 153±37 0.90±0.05 175±48 0.87±0.04 200±37 0.86±0.06 210±39 0.84±0.05 238±49 0.80±0.07 264±51 0.78±0.07 291±55 0.72±0.1 347±71 0.68±0.1 400±89
−3 0.93±0.05
125±40 0.93±0.02 142±28 0.92±0.02 153±33 0.91±0.02 170±33 0.90±0.03 188±44 0.88±0.04 203±34 0.86±0.04 230±49 0.84±0.04 251±48 0.77±0.07 308±66
−6 0.81±0.2
207±98 0.86±0.07 207±60 0.86±0.04 211±43 0.84±0.04 234±51 0.83±0.04 248±55 0.82±0.05 269±66 0.8±0.04 289±60 0.77±0.04 311±60 0.72±0.06 369±64
−9 0.77±0.1
248±63 0.75±0.1 292±62 0.76±0.09 297±64 0.73±0.08 330±84 0.71±0.11 339±88 0.70±0.08 357±75 0.70±0.06 372±73 0.68±0.06 392±82 0.63±0.1 444±91
The mass-specific stiffness (k/m) and damping/motor coefficient (c/m) duringtcewere evaluated using a least-squares method. In each class, the first line
corresponds to ther2and the second to the RMSE (expressed in N).
Data are grand means (see Materials and methods)±s.d. In each class,n=10 except for (+6 deg; 5.6 m s−1) and (+9°; 5.0 m s−1), wheren= 9, and for (+9 deg;
5.6 m s−1), wheren=7.
Journal
of
Experimental
Change in vertical motion of the COM
When running uphill at a given speed, to maintain the bouncing mechanism similar to level running, the runners should increaseWextþ to overcome the slope, without changingWext (Fig. 3A). However, the runner limitsWextþ by reducingWext. The opposite phenomenon is observed during downhill running, whereWextis limited by reducing
Wþ
ext. Because the work done to accelerate and decelerate the COM forwards (Wf) does not change with slope, the change inWextþ and
W
extis due to a change inWvþandWv, which in turn is mainly due to a modification ofS+andS−during the step (Fig. 5).
When running uphill, the upward displacement of the COM each step (S+) increases with slope and speed becauseS
minincreases. In contrast, the downward displacement (S−) decreases. At low speeds and on shallow slopes, S− is still present because the muscular power at disposal during the push is great enough to increaseS+ beyondSmin. In this way, the presence ofS−allows the storage of elastic energy into the MTU to be restored during the next positive work phase. On the contrary, at high speeds and on steep slopes, the power during the push approaches the maximal performance of the runner. Therefore,S+is maintained close toS
min; consequently,S− andWv(Fig. 3A) are almost nil and no rebound is possible.
When running downhill,S−increases faster with slope and speed thanS+in uphill running (Fig. 5); these changes inS−are mainly due to a change in the downward fall of the COM duringta(Sa). In contrast, the effect of slope and speed onS+on a negative slope is less marked than the changes in S− on a positive slope. Consequently, when running downhill, the possibility of elastic storage increases with speed and slope. Though, as mentioned by Snyder and Farley (2011) and Snyder et al. (2012), the recoil is limited becauseS+andWþ
v are small.
Furthermore, the largeSa observed in downhill running results in a high Vv at touchdown, which in turn causes greater GRF. According to Zelik and Kuo (2012), the vibrations of the soft tissues induced by the impact could reduce the muscular work done by dissipating energy.
Change in the energy fluctuations of the COM
Running is thought to employ a spring-mass mechanism by which interactions between the COM and the ground allow storage and release of elastic energy in the MTU. In vivo measurements of muscle–tendon interaction have highlighted the influence of the stretch–recoil of tendons on the power output of muscles during running (Ishikawa and Komi, 2008; Roberts et al., 2007).
On the level at low and intermediate speeds,tpush>tbrake(Fig. 6A), althoughWextþ ¼Wext. This difference in time is due to the greater muscular force exerted during the eccentric phase. The fact that tpush>tbrakethus suggests an important contribution of the contractile machinery to the MTU length change and to the work production (Cavagna, 2006). At higher speeds (i.e. above ∼3.9 m s−1), tpush=tbrake, which suggests that when muscle activation is progressively augmented with increasing speed, the MTU length change is mainly due to tendon length change. The work contribution by the contractile machinery is thus progressively substituted by elastic storage and recovery by tendons. Thetpush/tbrakeratio may therefore be an expression of the deviation of the MTU’s response from that of an elastic structure. On a slope, the change in the ratio betweenWextþ and
W
extmost likely affects the interaction between muscle and tendons during the stretch-shortening cycle (Roberts and Azizi, 2011).
When running uphill, the linear increase of Wextþ changes the partitioning oftcintotpushandtbrake(Fig. 6A). In order to contain the average muscular power required during the push,tpush increases with slope and tpush>tbrake. This suggests that the MTU length
change is mainly due to a shortening of the contractile machinery and that less elastic energy is stored–as in old men running on the level (Cavagna et al., 2008a). As proposed by Roberts and Azizi (2011), it could be that on a positive slope, MTUs work like power amplifiers: the energy produced during the muscular contraction is stored at a low pace in the tendons to be released at a higher pace. In downhill running when slope becomes steeper, in order to limit the power during the brake, tbrake increases and tpush becomes shorter. The higher GRF observed in downhill running could favour the role of the tendon relative to that of muscle: muscle would perform a quasi-isometric contraction and the energy would be stored in the tendon during rapid stretch, to be dissipated later by a slower lengthening of the muscle (Roberts and Azizi, 2011).
The partition between tpush and tbrake changes because the minimum ofEvappears increasingly earlier in uphill running and increasingly later in downhill running, whereas the minimum ofEf occurs always more or less in the middle of the contact period (Fig. 6B and arrows in Fig. 2). For this reason, when slope increases, a phase shift betweenEfandEvemerges and an energy transduction between these two forms of energy can occur.
When running uphill, the lower limb acts like a pole in athletics (Schade et al., 2006). During the first part of contact (i.e. period between the two arrows in the upper panels of Fig. 2), the COM loses horizontal velocity, while it gains height and vertical velocity. During this phase, there is an energy transduction betweenEfand Ev. The fact thatEextdecreases shows that the loss inEfis greater than the gain inEv; part of theEextlost is stored in the elastic element of the MTU to be released during the second part of contact to increase the kinetic and potential of the COM. Note that the same phenomenon during the running step preceding the jump over an obstacle was described by Mauroy et al. (2013).
When running downhill, the energy transduction occurs during the second part of the contact, when Ev is decreasing while Ef increases. In this case, the potential energy lost is used to accelerate the COM forward.
In level running, the energy recovered through an exchange betweenEvandEf(Eqn 6) is negligible (%R<5%), like in a spring-mass system (Cavagna et al., 1976). When running at high speed on steep slopes, the rebound of the body deviates from a spring-mass system. However, the energy transduction allows recovering only a small amount of energy: at best %R≈20% in uphill running and %R≈10% in downhill running.
Model of the vertical bounce of the body
In this study, we propose a model that reproduces in first approximation the basic oscillation of a spring-mass actuator (see inset in Fig. 7A). The aim of this model is to understand how all of the lower-limb muscles are tuned to generate an overall leg stiffness and leg actuation to sustain the vertical oscillation of the bouncing system.
Running on a slope is not a pure elastic phenomenon because energy must be added or released at each step. Therefore, our model includes an actuator placed parallel to the spring. This actuator generates a force proportional to Vv; a linear force–velocity relationship was chosen because functional tasks that involve all lower-limb joints show a quasi-linear relationship (Bobbert, 2012; Rahmani et al., 2001), rather than the classical hyperbolic relationship described in isolated muscles (Hill, 1938). The coefficientc/mis positive during uphill running, showing that the actuator adds energy to the system, and negative during downhill running, because energy is dissipated at each step. As speed and slope increase, the discrepancy between the upward and downward
Journal
of
Experimental
displacement of the COM increases, the rebound of the COM deviates from a spring-mass system and the coefficientc/mincreases. On a slope, k/m decreases when running uphill and increases when running downhill. On a positive slope, in order to maintain the symmetry of the step, av;ce remains ≤1g (Fig. 4B). This lower acceleration is most likely obtained by reducing the stiffness of the contractile elements of the MTU and the overall k/m becomes smaller than that on the level (Fig. 7B).
Note also that on positive slopes, the limbs at impact are more flexed to prevent pitching backward (Birn-Jeffery and Higham, 2014; Leroux et al., 2002). On the level, runners adopting a more crouched posture, similar to Groucho running (McMahon et al., 1987), present lower vertical GRF and consequently a smallerk/m. In uphill running, the more flexed posture during stance could explain, at least in part, the smallerk/m.
On a negative slope, the step is asymmetric at most speeds and slopes because av;ce>1g(Fig. 4B). When acceleration increases, muscles fibres oppose a progressively greater force to stretching and the contractile machinery becomes stiffer than the tendon. Subsequently, the overallk/m becomes greater than on the level. Furthermore, increasingk/m minimizes the lowering of the COM during contact (Fig. 5). This strategy might serve as an intrinsic safety mechanism to limit the risk of MTU damage after landing (DeVita et al., 2008).
Our simple spring-actuator-mass model predicts the Fv–time curve, though it does not take into account the first peak in theFv curve, which is due to foot slap (Alexander et al., 1986; Schepens et al., 2000). To estimate the contribution of the foot collision on the shape of theFv–time curve, we used a Fourier series analysis (Clark and Weyand, 2014). This analysis decomposes theFvsignal into low- and high-frequency components. According to Clark and Weyand (2014), the high-frequency components are mainly due to the acceleration of the lower limb during the impact phase. In our study, we observed that the variance accounted for by these high-frequency components increases at high speeds and on steep negative slopes (see Table S1). This observation supports the idea that the decrease in goodness-of-fit indexes (Table 1) is due to a higher contribution of the foot’s interaction with the ground.
These last results corroborate those of Clark and Weyand (2014) obtained in sprint running; they show that at swift speeds, the GRF waveform deviates from the simple spring-mass model pattern, most likely because of the greater importance of the foot–ground collision. Therefore, Clark and Weyand (2014) propose a model including two masses and springs to take into account the interaction of the lower-limb segments with the ground. Our spring-actuator-mass model could thus be refined by adding a second spring mass representing the foot and shank, although kinematic data of these segments are needed to feed this implemented model.
Conclusions
Cavagna et al. (1991) suggested that running with a long aerial phase limits the step-average power as long as muscles are able to develop enough power during the push and/or the brake. Our results support this hypothesis.
When running uphill at a given speed, the average external power developed during the positive work phase seems to be the limiting factor. Actually, when slope increases, in order to keep a long aerial timeta, the vertical velocity of the COM at take-off should increase because the minimal vertical displacement (Smin) increases. This would require a greater power during the push. As a matter of fact, this power is limited by: (1) reducingtaand thus the step periodT,
(2) increasing the duration of the push (tpush) at the expense of the duration of the brake (tbrake) and (3) reducing the downward displacement of the COM. As a result, uphill running deviates from a bouncing mechanism as speed and slope increases.
When running downhill, the average external power developed during the negative work phase seems to be the limiting factor. Indeed, despite a lower vertical velocity at take-off,ta–and thusT– increases with slope and speed because the ballistic fall of the COM increases. A longertaincreases the external power developed during the brake because the energy to be dissipated after touchdown is greater. In spite of better muscular performance during eccentric than concentric contraction, the power during the brake is limited by (1) increasing tbrake at the expense of tpush and (2) reducing the upward displacement of the COM. Consequently, the bouncing mechanism during downhill running gradually disappears as speed and slope increase.
Acknowledgements
The authors thank Profs D. De Jaeger and V. Legat for their advice.
Competing interests
The authors declare no competing or financial interests.
Author contributions
Conceived and designed the experiments: A.D., P.L., P.W. Performed the experiments: A.D., P.L., P.W. Analyzed the data: A.D., P.L., P.W. Wrote the paper: A.D., P.L., P.W.
Funding
This study was funded by the Universitécatholique de Louvain (Belgium), the Universidad Finis Terrae (Chile) and the Fonds de la Recherche Scientifique (Belgium).
Supplementary information
Supplementary information available online at
http://jeb.biologists.org/lookup/doi/10.1242/jeb.142976.supplemental
References
Alexander, R. M., Bennett, M. B. and Ker, R. F.(1986). Mechanical properties and function of the paw pads of some mammals.J. Zool.209, 405-419.
Birn-Jeffery, A. V. and Higham, T. E.(2014). The scaling of uphill and downhill locomotion in legged animals.Integr. Comp. Biol.54, 1159-1172.
Blickhan, R.(1989). The spring-mass model for running and hopping.J. Biomech.
22, 1217-1227.
Bobbert, M. F.(2012). Why is the force–velocity relationship in leg press tasks quasi-linear rather than hyperbolic?J. Appl. Physiol.112, 1975-1983.
Cavagna, G. A.(2006). The landing–take-off asymmetry in human running.J. Exp. Biol.209, 4051-4060.
Cavagna, G. A., Thys, H. and Zamboni, A.(1976). The sources of external work in level walking and running.J. Physiol.262, 639-657.
Cavagna, G. A., Franzetti, P., Heglund, N. C. and Willems, P.(1988). The determinants of the step frequency in running, trotting and hopping in man and other vertebrates.J. Physiol.399, 81-92.
Cavagna, G. A., Willems, P. A., Franzetti, P. and Detrembleur, C.(1991). The two power limits conditioning step frequency in human running.J. Physiol.437, 95-108.
Cavagna, G. A., Heglund, N. C. and Willems, P. A.(2005). Effect of an increase in gravity on the power output and the rebound of the body in human running.J. Exp. Biol.208, 2333-2346.
Cavagna, G. A., Legramandi, M. A. and Peyré-Tartaruga, L. A.(2008a). The landing–take-off asymmetry of human running is enhanced in old age.J. Exp. Biol.
211, 1571-1578.
Cavagna, G. A., Legramandi, M. A. and Peyré-Tartaruga, L. A.(2008b). Old men running: mechanical work and elastic bounce.Proc. R. Soc. B Biol. Sci.275, 411-418.
Clark, K. P. and Weyand, P. G.(2014). Are running speeds maximized with simple-spring stance mechanics?J. Appl. Physiol.117, 604-615.
DeVita, P., Helseth, J. and Hortobagyi, T.(2007). Muscles do more positive than negative work in human locomotion.J. Exp. Biol.210, 3361-3373.
DeVita, P., Janshen, L., Rider, P., Solnik, S. and Hortobágyi, T.(2008). Muscle work is biased toward energy generation over dissipation in non-level running.
J. Biomech.41, 3354-3359.
Journal
of
Experimental
Doherty, T. J.(2003). Invited review: aging and sarcopenia.J. Appl. Physiol.95, 1717-1727.
Genin, J. J., Willems, P. A., Cavagna, G. A., Lair, R. and Heglund, N. C.(2010). Biomechanics of locomotion in Asian elephants.J. Exp. Biol.213, 694-706.
Gosseye, T. P., Willems, P. A. and Heglund, N. C.(2010). Biomechanical analysis of running in weightlessness on a treadmill equipped with a subject loading system.Eur. J. Appl. Physiol.110, 709-728.
Heglund, N. C.(1981). A simple design for a force-plate to measure ground reaction forces.J. Exp. Biol.93, 333-338.
Hill, A. V.(1938). The heat of shortening and the dynamic constants of muscle.
Proc. R. Soc. Lond. B Biol. Sci.126, 136-195.
Ishikawa, M. and Komi, P. V.(2008). Muscle fascicle and tendon behavior during human locomotion revisited.Exerc. Sport Sci. Rev.36, 193-199.
Leroux, A., Fung, J. and Barbeau, H.(2002). Postural adaptation to walking on inclined surfaces: I. Normal strategies.Gait Posture15, 64-74.
Mauroy, G., Schepens, B. and Willems, P. A.(2013). The mechanics of running while approaching and jumping over an obstacle.Eur. J. Appl. Physiol.113, 1043-1057.
McMahon, T. A., Valiant, G. and Frederick, E. C.(1987). Groucho running.J. Appl. Physiol.62, 2326-2337.
Minetti, A. E., Ardigò, L. P. and Saibene, F.(1994). Mechanical determinants of the minimum energy cost of gradient running in humans. J. Exp. Biol.195, 211-225.
Rahmani, A., Viale, F., Dalleau, G. and Lacour, J.-R.(2001). Force/velocity and power/velocity relationships in squat exercise.Eur. J. Appl. Physiol.84, 227-232.
Roberts, T. J. and Azizi, E.(2011). Flexible mechanisms: the diverse roles of biological springs in vertebrate movement.J. Exp. Biol.214, 353-361.
Roberts, T. J. and Belliveau, R. A.(2005). Sources of mechanical power for uphill running in humans.J. Exp. Biol.208, 1963-1970.
Roberts, T. J., Higginson, B. K., Nelson, F. E. and Gabaldón, A. M.(2007). Muscle strain is modulated more with running slope than speed in wild turkey knee and hip extensors.J. Exp. Biol.210, 2510-2517.
Sainton, P., Nicol, C., Cabri, J., Barthelemy-Montfort, J., Berton, E. and Chavet, P.(2015). Influence of short-term unweighing and reloading on running kinetics and muscle activity.Eur. J. Appl. Physiol.115, 1135-1145.
Schade, F., Arampatzis, A. and Brüggemann, G.-P.(2006). Reproducibility of energy parameters in the pole vault.J. Biomech.39, 1464-1471.
Schepens, B., Willems, P. A. and Cavagna, G. A.(1998). The mechanics of running in children.J. Physiol.509, 927-940.
Schepens, B., Willems, P. A. and Heglund, N. C.(2000). Foot slap during running in children.Arch. Physiol. Biochem.108, 14.
Snyder, K. L. and Farley, C. T.(2011). Energetically optimal stride frequency in running: the effects of incline and decline.J. Exp. Biol.214, 2089-2095.
Snyder, K. L., Kram, R. and Gottschall, J. S. (2012). The role of elastic energy storage and recovery in downhill and uphill running.J. Exp. Biol.215, 2283-2287.
Willems, P. A. and Gosseye, T. P.(2013). Does an instrumented treadmill correctly measure the ground reaction forces?Biol. Open2, 1421-1424.
Willems, P. A., Cavagna, G. A. and Heglund, N. C.(1995). External, internal and total work in human locomotion.J. Exp. Biol.198, 379-393.
Zelik, K. E. and Kuo, A. D.(2012). Mechanical work as an indirect measure of subjective costs influencing human movement.PLoS ONE7, e31143.