T H E L O N D O N
A L C O H O
A L C O H O
A L C O H O
L
L
L
S T A T I S T I C S
P R O J E C T
A
REPORT
BY
THE
LONDON
DRUG
AND
ALCOHOL
NETWORK
ON
ALCOHOL
TREATMENT
Acknowledgements
Alcohol Advisory Service for Camden & Islington ARP (Alcohol Recovery Project)
ASCA (Addiction Support and Care Agency) Bromley Alcohol Service
CASA (Camden Advisory Service on Alcohol) City and Hackney Alcohol Service
CNWL (Central and North West London Mental Health NHS Trust)
DASL (Drug and Alcohol Service for London) EACH (Ethnic Alcohol Counselling in
Hounslow) Equinox
HAGA (Haringey Advisory Group on Alcohol) Rugby House
Turning Point Don Shenker Eric Holmes Sally Martin
National Treatment Agency
Executive Summary Page 3
The Project Page 6
1.Background Page 6
2.Aim and Objectives Page 6
3.Methodology Page 7
4. Results Page 9
4.1 Statistical findings Page 9
Gender/Age Page 10
Ethnicity Page 11
Referral Source Page 11
Waiting Times Page 13
4.2 Interview Findings Page 14
5. Discussion Page 16
6. Conclusion Page 17
7. Recommendations Page 18
References/Appendices Page 19
The
LONDON
ALCOHOL
STATISTICS
PROJECT
An LDAN report by
Ranzetta Consulting
Contents
London Alcohol Statistics Project
LDAN is grateful to the King’s Fund and the Association of London Government for their support, with thanks in particular
to Mark Brooker, ALG Senior Research Officer for his input.
Background
The London Alcohol Statistics Project was established by LDAN to collect alcohol treatment statistics across London. There is no overall body with responsibility for monitoring alcohol treatment and its outcomes. This means it is very difficult to compare alcohol treatment activity with drug treatment, and to compare activity in one area or borough with another. The Alcohol Statistics Project set out to explore the extent to which alcohol treatment statistics may be compared with drug treatment
statistics, and to highlight infrastructure and capacity issues for alcohol treatment providers in data collection and outcome monitoring. Quantitative information was requested in National Drug Treatment Monitoring System (NDTMS) format, and providers were interviewed. The project was funded by the King’s Fund.
Results
Data relating to 6873 clients from 27 London boroughs who were in contact with alcohol services during 2004 was collated and analysed. The ratio of male to female clients was 2:1, and clients were most likely to be in the 36 to 50 age range. Overall the largest ethnic group using the alcohol services was White British, then Irish, and then White other. Together these groups accounted for over four fifths of all clients whose ethnic group was recorded.
Of the records that included referral source, ‘GP’ and ‘self-referral’ were most common, although this varied according to provider. Referral source also varied by gender and ethnicity to some extent; men were more likely to have been referred by Probation, whilst women were more likely to have been referred by Psychiatry or via Community Care Assessment. Asian or Asian British clients were less likely than other ethnic groups to be referred from other drug and alcohol services, whilst Black or Black British and Mixed clients were least likely to be referred by a GP. Clients with Black or Black British ethnicity were slightly more likely to be referred by a Housing Department than other ethnic groups.
Not all providers were able to supply data on waiting times. The longest wait between referral and treatment was an average of 38.8 calendar days (5.5 weeks) at one provider, and the shortest 17.0 (2.4 weeks) at another. Overall the average wait was 37 days (5.3 weeks) for alcohol treatment. For drug treatment, the average waits in London during the same period ranged from 1.4 weeks to be treated by a GP, and 2.8 weeks for inpatient treatment.
The providers interviewed said that NDTMS type data has limited use as it does not reflect the complexity of cases or the amount or modality of treatment provided, nor does it consider outcomes. The providers routinely collect other data over and above the NDTMS type data; commissioners request additional data, and providers also keep detailed records for their own use. All the
interviewees listed over three paymasters each, all with different data requirements. Commissioners require providers to submit activity data in one form or another at monthly or quarterly intervals. The information appears to be used for performance monitoring against service level agreements, and in some cases to inform treatment planning and commissioning.
All the providers interviewed use custom built databases, but there was a degree of frustration that there was no central guidance on which system to use. Maintenance of the databases requires a fairly heavy commitment of resources, ranging from dedicated full time and part time posts in the largest provider to a day and a half a week by the Chief Executive and an administrator in the smallest. There is no doubt that the requirements for providers to supply activity data to commissioners and other bodies represent a significant burden. Not only must resources be allocated to inputting data, maintaining the database and retrieving information, but also frontline staff have to capture client information using large forms that add little to the therapeutic alliance or to job satisfaction.
Interviewees felt it would be useful to collect the following information: Demographic data e.g. gender, age, ethnicity, postcode
Profile of alcohol and other substance use including patterns of use History of engagement; progress through cycle of change
Treatment received
Conclusions
The London Alcohol Statistics Project found that NDTMS-type alcohol data enables some interesting comparison of treatment activity between providers, and also, in theory, between alcohol and drug treatment. There are, however, a number of important limitations to its usefulness. The data does not describe the complexity of cases, the level of input from the alcohol service, or any changes in the client that may take place. Also, great care needs to be taken in making direct comparisons between service providers - who may offer very different interventions, and/or target different population groups.
Comparisons between alcohol and drug service users found some interesting differences between the two groups. Alcohol service users are older and more likely to be white than drug service users. They are also more likely to have been referred by a GP. There are important differences between waiting times for drug and alcohol treatment; clients appear to be waiting over twice as long for alcohol treatment.
Data collection and analysis for commissioners and funders place significant demands on alcohol treatment providers; smaller organisations in particular do not have adequate capacity or
infrastructure. The findings suggest that standardisation of data sets across the main commissioners of alcohol treatment in London would greatly increase providers’ efficiency whilst improving data quality and comparability. There should be efficiency gains in terms of database software too, especially if the alcohol data sets are compatible with those required for drug treatment. Three data sets are proposed, each with a distinct purpose: performance management, commissioning, and client monitoring.
1
1
London Alcohol Statistics Project
Recommendations
1. It is recommended that commissioners and alcohol treatment providers agree and adopt a standardised minimum data set for London.
2. The wait for alcohol treatment appears to be much longer than that for drug treatment. It is recommended that LDAN works with commissioners and providers to understand this situation in more detail, and to begin to address any issues that arise.
3. Data collection and monitoring is an important but sometimes onerous task. It is recommended that LDAN continues to make the case for data collection to all its members and works with them to ensure that the appropriate tools, training and support are in place to assist them with this task.
Alcohol treatment in London covers a wide range of interventions, including counselling, detox, structured day care, low threshold open access/drop-in services, outreach, rehabilitation, supported housing and wet houses. Most services work both with drinkers and affected others. However, because of the fragmented nature of funding for alcohol treatment in recent years, no two alcohol services look alike. There are great variations in organisation size and infrastructure, interventions offered, target client group, and funding streams. It is important to note that many services which developed solely to address the needs of people with alcohol related problems have taken on clients whose primary care needs are drug related in order to access funding streams that would otherwise be closed to them.
1.
BackgroundThe London Alcohol Statistics Project was set up to collect alcohol treatment statistics across
London. To date alcohol treatment has not received specific funding from the Department of Health, as now happens in the drug treatment sector, and there is no overall body with the responsibility of monitoring alcohol treatment and its outcomes. This means that it is very difficult to compare alcohol treatment activity with that of drug treatment, and to compare activity in one area or
borough with another. There is also a distinct lack of knowledge about what is happening across the country in terms of alcohol treatment provision, and where the gaps are.
As the Government acknowledged in its Alcohol Harm Reduction Strategy for England (Strategy Unit, 2004), ‘no information is collected [centrally] on:
The numbers of people entering treatment each year The proportion of successful outcomes
The length of waiting times
The extent to which the treatments offered meet the individual’s need for treatment, aftercare and other support
How many times individuals pass through the system
How levels of provision meet need locally as well as nationally The involvement of families in treatment
Whether some groups find access to services particularly difficult’
The Strategy proposed carrying out a national audit of the demand for and provision of alcohol treatment services. This took place in 2004/05 but results were not yet published at time of writing.
2.
Aim and objectivesThe aim of the Alcohol Statistics Project was to collect and analyse alcohol treatment statistics on a pan-London basis. Its objectives were to:
Explore the extent to which alcohol treatment statistics may be compared with drug treatment statistics Highlight infrastructure and capacity issues for alcohol treatment providers in data collection and outcome monitoring
London Alcohol Statistics Project
Originally one of the objectives was to identify where possible any treatment gaps, and the areas where they may occur, but this was dropped in the absence of systematic needs assessment for alcohol treatment in London.
3.
MethodologyThe project entailed the following:
Collection of anonymised data from alcohol treatment providers
Analysis of the data
Interviews with treatment providers These are described in more detail below.
3.1 Data Collection
To enable comparison between alcohol and drug treatment statistics, it was decided to request data in the NDTMS format (see box opposite), as this is the most commonly used format for drug treatment data. The precise information requested is detailed in Appendix 1. The period covered by the data was the 12 months from 1st
January 2004. It was beyond the scope of this project to collect and analyse data from all alcohol treatment providers in London, therefore a sample of providers was selected.
The selection criteria were:
Providers catering primarily for alcohol users (rather than other substances)
Size of agency - representation from both large and small agencies
Geographical location – spread across inner and outer boroughs of London
Representation from both statutory and voluntary service providers
Anonymised data was requested from 13 providers.
3.2 Data analysis
The data was aggregated onto an Access database in order to facilitate analysis using Access queries. This was a process that required a fair amount of our own input and input from providers. Although data was requested in a standard format, using defined categories for data fields such as referral source, ethnicity, and discharge reason, most of the seven providers that returned data were not able to provide data exactly as required. There were a number of data errors and inconsistencies which needed to be addressed.
London Alcohol Statistics Project
The National Drug Treatment Monitoring System (NDTMS) relates to the process of collecting, collating and analysing
information from and for those involved in the drug treatment sector. The NDTMS is a
development of the regional drug misuse databases, which have been in place since the late 1980s. Originally commissioned by the Department of Health,
responsibility for the NDTMS was handed over to the National Treatment Agency (NTA) in April 2003. There is an NDTMS centre to cover each region, with the actual services existing within various institutions such as Public Health Observatories, academic institutions and primary care / mental health trusts. The centre for London region is based at the NTA. The purpose of the NDTMS centres is to obtain accurate, good quality, timely information for reporting drug treatment activity. All drug treatment agencies must provide a basic level of
information to the NDTMS on their activities each month –
known as the core data set. Source: http://www.nta.nhs.uk/programme/
The data we received included some obvious typing errors and clearly erroneous entries (e.g. date of birth: year 2025, or 00/01/1900). These problems often appeared to result from providers using data collection systems that allow input via free text when a drop down list to select from would have been more appropriate. There were also problems that resulted from providers using categories which fell outside the ones we had defined for certain fields (e.g. referral sources that did not match our list of possible referral sources). In these instances we consulted with providers to enable us to adjust the data to fit within our categories.
We requested NDTMS data on drug service users from the NTA, to enable a comparison between the demographic profiles of alcohol and drug service users in London. The NTA provided data
concerning some 22,003 drug service users in the 12 month period from April 2004. This data was unpublished at time of writing.
3.3 Interviews with treatment providers
Semi-structured telephone interviews were conducted with three of the 13 providers who were asked to provide data. These were selected as a cross section representing: both inner and outer London; both those who had been able to supply data as requested, and those who had not; and both statutory and voluntary sector providers. Interviewees were either the service manager or the person
responsible for data collection within the service.
Interview questions covered the ease of producing the data, capacity within the service to manage client data, data requirements of commissioners, resource and other constraints to collecting data. The full interview schedule is included as Appendix 2.
Barking and Dagenham 1
Barnet 34
Brent 588
Camden 588
City of London 3
Croydon 3
Ealing 557
Enfield 64
Hackney 12
Hammersmith and Fulham 637
Haringey 508
Harrow 353
Hillingdon 7
Hounslow 505
Islington 363
Kensington and Chelsea 355 Kingston upon Thames 39
Lambeth 25
Lewisham 15
Newham 15
Redbridge 71
Richmond-upon-Thames 544
Southwark 35
Sutton 1
Tower Hamlets 27
Wandsworth 27
Westminster 421
Essex 1
Hertfordshire 11
Luton 1
Torbay 1
Slough 2
Surrey 2
London Alcohol Statistics Project
Results
Table 1: borough of residence where known
2
2
4.
Results4.1 Statistical findings
The seven organisations that were able to provide data in a format we could use, produced data relating to some 6873 clients whose
primary care needs were alcohol related, who were in contact with their services between January 1st
and December 31st 2004. The
individual providers are denoted by a number from 1 to 7
throughout this report. Services offered by the seven providers range from residential detox to community based detox,
counselling, group work,
structured day care and criminal justice interventions, or a
combination of these.
5186 records included the client’s borough of residence; 27 London boroughs are represented in the data (see Table 1).
4.1a Gender
The ratio of male to female clients varies across the different providers, from a fifth of clients being female (20%) at provider 2, to nearly half (47%) at provider 6 (see Figure 1). Overall, the ratio was about 2:1 male to female (67.2% of clients were male, 32.8% were female). Comparison figures from the NTA show very similar proportions of male and female clients (70% male, 30% female).
4.1b Age
Figure 2 shows the age profile of male and female clients. Our data suggests that clients of alcohol services are most likely to be in the 36 to 50 age range. The age profiles for men and women are very similar, with women more likely to use alcohol services at a slightly younger age (Figure 3).
Comparison data from the NTA suggests that drug service clients are likely to be younger, and as
for alcohol clients, women are likely to use drug services at a younger age than men.
Client gender - percentage of males and female, all providers (n = 5730)
0% 20% 40% 60% 80% 100%
1 2 3 4 5 6 7
provider
female
male
Client age group, by gender (n = 5497)
0 2 4 6 8 10 12 14 16 18 20 0-15 16-20 21-25 26-30 31-35 36-40 41-45 46-50 51-55 55-60 61-65 66-70 71-75 76-80 81-85 86-age group % o f to ta l Male Female
Age distribution by gender (n = 5497)
0 5 10 15 20 0-15 16-20 21-25 26-30 31-35 36-40 41-45 46-50 51-55 55-60 61-65 66-70 71-75 76-80 81-85 86-age group % o f to ta l b y ge nde r Male Female
London Alcohol Statistics Project
Figure 1
Client age group, by gender (n=5497)
Figure 2
Age distribution by gender (n=5497)
Figure 3
4.1c Ethnicity
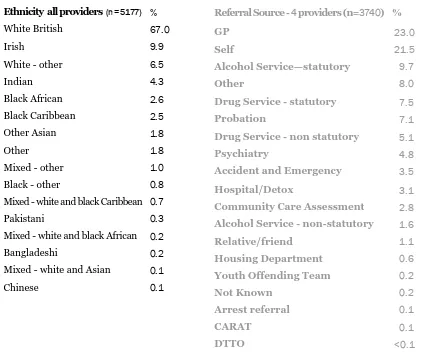
Overall the largest ethnic group using the alcohol services was White British, then Irish, then White other (see Table 2). Together these groups accounted for over four fifths (83.4%) of all clients whose ethnic group was recorded. There was considerable variation between providers however, with the White/Irish groups making up more than 90% of two providers’ clients, whilst for another provider, 21% of clients were Indian – a much higher proportion than all other providers. Figure 4 shows a simplified breakdown of client ethnicity for each provider. Comparison data from the NTA of drug service users (n=21419) shows a smaller proportion of White British, Irish and White other clients, and also of Indian clients. Drug service users are more likely that alcohol service users to be Black Caribbean, Black Other and Bangladeshi.
4.1d Referral source
Of the 3740 records that included referral source, ‘GP’ and ‘self-referral’ were most common (see Table 3). Again, there was variation between the providers, and this probably reflects the differing nature of the services offered, and the positioning of the services within treatment and/or criminal justice systems. Comparison with NTA data for drug service users (n=20772) suggests that drug service users are roughly twice as likely to self-refer and are less likely to be referred by a GP than alcohol service users.
Referral Source - 4 providers (n=3740) %
GP 23.0
Self 21.5
Alcohol Service—statutory 9.7
Other 8.0
Drug Service - statutory 7.5
Probation 7.1
Drug Service - non statutory 5.1
Psychiatry 4.8
Accident and Emergency 3.5
Hospital/Detox 3.1
Community Care Assessment 2.8
Alcohol Service - non-statutory 1.6
Relative/friend 1.1
Housing Department 0.6
Youth Offending Team 0.2
Not Known 0.2
Arrest referral 0.1
CARAT 0.1
DTTO <0.1
Ethnicity all providers (n = 5177) %
White British 67.0
Irish 9.9
White - other 6.5
Indian 4.3
Black African 2.6
Black Caribbean 2.5
Other Asian 1.8
Other 1.8
Mixed - other 1.0
Black - other 0.8
Mixed - white and black Caribbean 0.7
Pakistani 0.3
Mixed - white and black African 0.2
Bangladeshi 0.2
Mixed - white and Asian 0.1
Chinese 0.1
Table 2 Table 3
London Alcohol Statistics Project
[image:11.595.73.506.304.662.2]Referral Source White (n=2710)
Mixed
(n=84)
Asian or Asian British (n=305)
Black or Black British (n=253)
Chinese/ other ethnic group (n=69)
Drug Service - statutory 8.9 2.4 2.2 2.8 1.4
Drug Service - non statutory 5.7 3.6 4.6 3.2 5.8
Alcohol Service - statutory 9.9 14.3 5.9 17.0 7.2
Alcohol Service - non statutory 1.7 0.0 2.0 1.2 2.9
GP 22.8 13.1 26.2 11.1 27.5
Self 22.5 32.1 23 28.5 24.6
DTTO 0.0 0.0 0.0 0.0 0.0
Arrest Referral 0.0 0.0 0.3 0.4 1.4
Youth Offending Team 0.2 0.0 0.0 0.4 0.0
Probation 6.8 13.1 6.9 11.1 2.9
Accident and Emergency 3.6 2.4 3.6 3.6 5.8
Psychiatry 4.7 2.4 6.6 2.8 4.5
Community Care Assessment 2.8 0.0 2.0 1.6 0.0
CARAT 0.2 0.0 0.0 0.0 0.0
Hospital/Detox 2.5 0.0 3.3 2.0 4.3
Housing Department 0.2 1.2 0.0 5.5 0.0
Relative/Friend 0.4 0.0 4.3 0.8 1.4
Other 7.0 9.5 8.2 8.3 10.1
Table 4
Referral source varied by gender to some extent. Of the 3731 records where both gender and referral source were known the biggest differences were as follows:
Men were more likely to have been referred by Probation (8.4% of men versus 4.0% of women) Women were more likely to have been referred by Psychiatry (6.4% of women versus 4.1% of men) Women were more likely to have been referred via Community Care Assessment (5.1% of women versus 1.8% of men)
Referral source also varied according to client ethnicity. Table 4 gives the breakdown of referrals as a percentage for each ethnic group. There were 3421 records where ethnicity and referral source were known. Of these, some of the biggest differences were as follows:
Asian or Asian British clients were less likely than other ethnic groups to be referred from other drug and alcohol services (14.7% versus 26.2% of White, 24.2% of Black or Black British, 20.3% of Mixed, and 17.3% of Chinese and other ethnic groups)
Black or Black British and Mixed clients were least likely to be referred by a GP Clients with Chinese or Other ethnicity were least likely to be referred by Probation
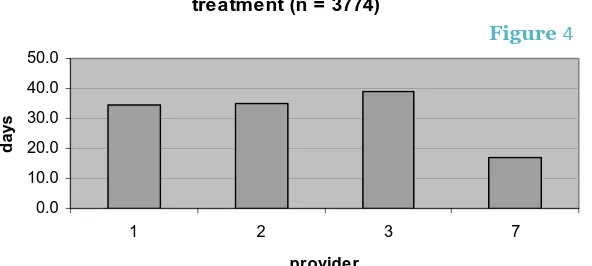
4.1e Waiting times
Not all providers were able to supply data on waiting times. The longest wait between referral and treatment was an average of 38.8 calendar days (5.5 weeks) at one provider, and the shortest 17.0 (2.4 weeks) at another (Figure 4). Overall the average wait was 37 days (5.3 weeks) for alcohol treatment.
Drug Treatment Average Wait (weeks)
Inpatient treatment 2.8
Residential rehab 2.5
Specialist prescribing 2.4
GP 1.4
Day care 1.6
Structured counselling 2.2
Average number of days between referral and treatment (n = 3774)
0.0 10.0 20.0 30.0 40.0 50.0
1 2 3 7
provider
d
ays
Source: www.nta.nhs.uk/programme/national/ perf_info_mar05/waitingtimemar05publish.pdf
London Alcohol Statistics Project
As a comparison, drug treatment waiting times published by the NTA for the quarter ending December 2004 are presented in Table 5, broken down by treatment type. The averages for London during that period ranged from 1.4 weeks to be treated by a GP, and 2.8 weeks for inpatient treatment.
Models of Care for alcohol had not been developed at the time of data collection, and so providers did not supply treatment tier information. It is difficult therefore to make direct comparisons between drug and alcohol treatment waiting times, but clearly 5.3 weeks for alcohol treatment is a far longer wait than for any drug treatment intervention.
Table 5
Waiting Times
[image:13.595.243.539.134.267.2]4.2 Interview findings
Information from the interviews with providers is summarised below and grouped into particular questions or issues.
4.2a How useful is the NDTMS core data set for alcohol treatment monitoring? Interviewees reported a number of issues with the NDTMS data:
It does not reflect the complexity of cases or the amount or modality of treatment provided The inclusion of information that makes individual clients identifiable (post code, date of birth) may be detrimental to building a therapeutic alliance with clients, who may be reluctant to disclose certain information as a result. Also, the number and nature of questions the client is asked in order to record the NDTMS data may seem disproportionate and irrelevant in the context of a therapeutic session.
It does not consider outcomes e.g. reduction in amount of alcohol used
4.2b What other information do providers collect?
All the interviewees said they collected more information than that required for NDTMS returns. Invariably commissioners request additional data, and providers also keep detailed records for their own use, over and above what is requested by others. In particular, providers record clients’
attendance at groups or one-to-one sessions, and baseline information on level of substance use and health and social functioning – which may be monitored over time.
At present the NTA does not require activity data on adult alcohol treatment as it does for drugs treatment, however all the interviewees listed over three paymasters each, all with different data requirements. Commissioners require providers to submit activity data in one form or another at monthly or quarterly intervals. The information appears to be used for performance monitoring against service level agreements, and in some cases to inform treatment planning and
commissioning. One interviewee felt that inner London DATs may have more capacity that those in outer London boroughs to undertake research and development with respect to needs assessment and treatment planning.
4.2c Databases and other resources
All interviewees use custom built databases; two interviewees said they were in the process of building new systems. All had explored buying ‘off the peg’ systems and decided against it. The interviews uncovered a degree of frustration with the NTA for not giving clear guidance on which system to use.
The largest provider interviewed has a dedicated full time Quality and Information Analyst Manager post and two part time posts. In addition, the NHS trust which the provider is part of supplies a programmer two days a week to maintain the database. A medium sized provider interviewed has a full time manager post dedicated to information management, whereas the work at another smaller provider is divided between the Chief Executive and administration staff.
London Alcohol Statistics Project
3
London Alcohol Statistics Project
All interviewees reported that administration staff are involved in inputting data from referral and assessment forms onto the database. It is difficult to quantify the amount of resource this uses, but one interviewee, from the smallest provider of the three mentioned above, estimated 10 hours a week for his service.
4.2d Alcohol treatment capacity and unmet need
Most interviewees said their services were running at capacity in terms of service level agreements, with some heavily oversubscribed. One interviewee described a small shortfall between what is commissioned and what is provided; the problem here appears to be lack of appropriate referrals rather than lack of need.
All interviewees said they regularly analyse their activity data to ensure any gaps in provision for particular groups are identified early so they can be remedied. This would entail, for example,
comparing the demographic profile of clients using the service to that of the target population group. Under-representation of women, say, or particular ethnic groups could then lead to changes in the way the service is marketed, or talks with potential referrers.
4.2e Other issues relating to data collection
There is no doubt that the requirements for providers to supply activity data to commissioners and other bodies represent a significant burden. Not only must resources be allocated to inputting data, maintaining the database and retrieving information, but also frontline staff have to capture client information using large forms that add little to the therapeutic alliance or to job satisfaction. One interviewee said that so long as skilled substance misuse workers are in demand, they can ‘vote with their feet’ if the data collection gets too onerous within a particular service. Another interviewee regretted the amount of time staff must spend form-filling, when they could be using some of that time for client contact (for example, chatting to clients in the lounge area before a group).
The interviewees said it requires patient, gentle persistence to persuade colleagues of the need to record good quality information, and that staff training is essential.
4.2f An ideal data set for monitoring alcohol treatment Interviewees felt the following information would be useful:
Demographic data e.g. gender, age, ethnicity, postcode
Profile of alcohol and other substance use including patterns of use History of engagement; progress through cycle of change
Treatment received
Interviewees agreed that some clients receive an intervention, are discharged and then return some time later in a worse condition, and this pattern repeats – the ‘revolving door’ syndrome. For example, at the first presentation a client has just lost his job, at the next his partner has left him, at the next he has lost his housing. It would be useful if the monitoring data could reflect this.
5.
DiscussionThe data collection from providers and subsequent collation proved problematic. Some providers, when approached, said that whilst they supported the objectives of the project, they were unable to participate because of resource constraints. Others agreed to participate but withdrew. Of those organisations that did provide data, most struggled to return the information within the project timeframe and in the exact format required. This experience suggests that a comprehensive audit of alcohol treatment activity in London would be difficult at current levels of capacity and resources.
The first objective of the project was to explore the extent to which the alcohol treatment statistics are comparable with the routinely collected NDTMS data for drug treatment in London. In this the project was partially successful. Thanks to drug treatment data for a comparable period provided by the NTA, it has been possible to make some broad comparisons in terms of demographic profiles, referral source and waiting times. Such comparisons would be more valuable if it were possible to link client information to the service being received (e.g. counselling), but this information was not available to us for the alcohol services that provided data.
The project objective concerning infrastructure and capacity issues for alcohol treatment providers in data collection and outcome monitoring has been met more successfully, as highlighted by the interview findings. Clearly, providers put a significant amount of resources into meeting the many and various demands for information from commissioners. Some of these demands seem
unnecessary. This is explored below through four key rhetorical questions.
London Alcohol Statistics Project
Discussion
Key questions:
1. What is the purpose of alcohol treatment data?
Performance management (for funders and providers)
Commissioning (to inform needs assessment and service planning)
Client monitoring (for providers to track the progress of clients through treatment)
2. Do these different purposes require different data sets?
There is some overlap, but the answer to that is almost certainly ‘yes’.
a. Performance management data needs to demonstrate:
Clinical effectiveness
Cost effectiveness
Contract fulfilment (e.g. activity data)
Service quality (e.g. client satisfaction, waiting times)
b. Commissioning data needs to describe/map: Demographic profile of clients
Care pathways and referral routes Unmet need
Treatment modalities used
c. Client monitoring data needs to include: Outcomes information
Input received by client from the provider (e.g. number and nature of sessions – counselling, day programme, groups, key working etc)
London Alcohol Statistics Project
Conclusion
6.
ConclusionThe London Alcohol Statistics Project found that NDTMS-type alcohol data enables some interesting comparison of treatment activity between providers, and also, in theory, between alcohol and drug treatment. There are, however, a number of important limitations to its usefulness. The data does not describe the complexity of cases, the level of input from the alcohol service, or any changes in the client that may take place. Also, great care needs to be taken in making direct comparisons between service providers who may offer very different interventions, and/or target different population groups.
Comparisons between alcohol and drug service users found some interesting differences between the two groups. Alcohol service users are older and more likely to be white than drug service users. They are also more likely to have been referred by a GP. Clients were waiting over five weeks on average for any alcohol treatment, whilst the average wait for drug treatment across
London was 1.6 weeks for day care, just over two weeks for counselling and nearly three for
residential rehab. This situation appears to be iniquitous, but it could be argued that the figures for alcohol are skewed by, say, particularly long waits for expensive inpatient detox or residential rehab. Equally, the aggregated average for all treatment may mask relatively short waits for, say,
counselling. It would be worth exploring this in more detail. Rapid access to treatment for
substance misuse problems is a worthy goal; clearly this should apply to people with alcohol problems as well as those with drug problems.
Data collection and analysis requirements from commissioners and funders place significant demands on alcohol treatment providers. Smaller organisations in particular do not have adequate
3. Do these data sets need to be comparable across different providers?
The variation in data sets that are requested by funders is perhaps understandable, but unnecessary. It must be possible to devise a data set that would satisfy the requirements of most funders and commissioners. From this could flow greater data collection consistency. There could also be a rationalisation of resources currently spent on data management, and perhaps some agreement on core costs associated with it, which could be built into
contracts. This argument applies to drug treatment data too. The potential scope for such rationalisation across both drug and alcohol treatment data would appear to be significant.
4. What does NDTMS data tell us about alcohol treatment?
The story told by the NDTMS data is essentially limited to demographic profile of clients (in terms of age, gender, ethnicity and area of residence), the wait between referral and
assessment, the referral source, the length of time between first treatment and discharge, and whether or not the discharge was planned. It says nothing about the modality of
treatment (although once Models of Care for alcohol misusers is established, providers will be able to record the tier of treatment), nor the intensity of input to clients. Perhaps most importantly, the NDTMS data does not say anything about a client’s improvement or
capacity or infrastructure. The project found that providers are required to make different statistical monitoring returns to each of their commissioners. The providers interviewed for the project all had three or more commissioners. The findings suggest that standardisation of data sets across the main commissioners of alcohol treatment in London would greatly increase providers’ efficiency whilst improving data comparability. There should be efficiency gains in terms of database software too, especially if the alcohol data sets are compatible with those required for drug treatment.
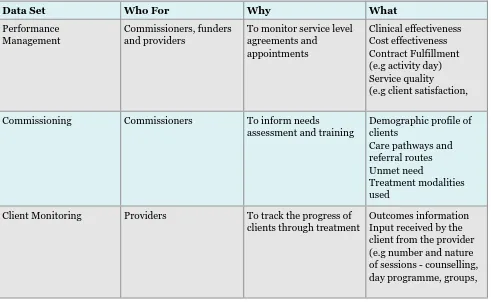
Three distinct but overlapping data sets are suggested below:
7.
Recommendations7.1 It is recommended that commissioners and alcohol treatment providers agree and adopt a standardised minimum data set for London.
7.2 The wait for alcohol treatment appears to be much longer than that for drug
treatment. It is recommended that LDAN works with commissioners and providers to understand this situation in more detail, and to begin to address any issues that arise.
7.3 Data collection and monitoring is an important but sometimes onerous task. It is recommended that LDAN continues to make the case for data collection to all its members and works with them to ensure that the appropriate tools, training and support are in place to assist them with this task.
Data Set Who For Why What
Performance Management
Commissioners, funders and providers
To monitor service level agreements and
appointments
Clinical effectiveness Cost effectiveness Contract Fulfillment (e.g activity day) Service quality (e.g client satisfaction,
Commissioning Commissioners To inform needs
assessment and training
Demographic profile of clients
Care pathways and referral routes Unmet need
Treatment modalities used
Client Monitoring Providers To track the progress of clients through treatment
Outcomes information Input received by the client from the provider (e.g number and nature of sessions - counselling, day programme, groups, London Alcohol Statistics Project
References: Strategy Unit (2004), Alcohol Harm Reduction Strategy for England, Cabinet Office, London
Item Column Heading Description and Comment
1 Age At assessment
2 Gender Male/Female
3 Ethnicity Ethnicity of client to be selected from:
White British /White Irish Other White /White and Black Caribbean
White and Black African /White and Asian/Other Mixed
Indian/Pakistani Bangladeshi/Other Asian Caribbean/ African
Other Black/ Chinese /Other
4 Postcode 1st part plus (where possible) first
character of second part eg. SE23 4
5 No Fixed Abode Format Yes/No
6 Borough (DAT) of
residence The borough (DAT) client currently resides in
7 PCT of residence The PCT client currently resides in
(where possible)
8 Referral Date Date of Referral of episode in format
(dd/mm/yy)
9 Primary Problem
Substance
Should be alcohol only
10 Secondary Problem
Substance
Any secondary substance that client presented with for episode
11 Referral Source Select from:
Drug service stat/Drug service non-stat GP/ Self
Arrest Referral/DTTO
Youth Offending Team/ Probation Accident and Emergency
Syringe Exchange
Psychiatry /Community Care Assessment
CARAT/Employment Services
12 First assessment date First assessment/triage/face to face
date - format dd/mm/yy
13 Previously treated Has client been treated before at an
alcohol agency
14 Discharge Date Client date of discharge from
completed episode - format dd/mm/yy
15 Discharge Reason Select from: Planned Disciplinary Self
16 Treatment Tier 1/2/3/4
17 Modality start Date client started the treatment
modality—format dd/mm/yy
a. If applicable: why were you unable to
supply data for this project?
b. Specific issues related to data supplied:
1. Does the NDTMS data set accurately
reflect what you do – why not ?
2. What data do your commissioners
require: type, frequency of reporting. 2b Do commissioners use the data for planning services, or performance management, or what?
3. Do you collect anything else e.g. outcomes data, other activity data, cost analysis info, unmet need
4. How do you maintain consistency
across different projects – what’s the process by which info gets onto database 5. What is your capacity in terms of clients – how near or otherwise are you to it (how would you tell: waiting lists)?
6. Where are the gaps in your provision
(e.g. women, bme) – how do you know? 7. Where are the gaps locally/what is needed – how do you know?
8. What software systems do you have ? 9. What human resources do you have ? How do you monitor effectiveness – outcomes monitoring?
11. Other issues e.g. burden of drugs data monitoring, burden of monitoring tiny contracts, other info requirements like personnel, health and safety?
12. Did you respond to the DoH audit? 13. What would be ideal core dataset for alcohol?
Appendix 2: interview schedule
London Alcohol Statistics Project
Appendix 1: data request form
Report written by Ranzetta Consulting
www.ranzettaconsulting.co.uk
Design and Layout: Roseanne Sweeney Pics: Delano Giovanni
Printed by Express Printing
©
Copyright London Drug and Alcohol Network 2005The London Drug and Alcohol Network is a membership network for substance misuse agencies in London. It provides advice,
information and support to frontline services - those working directly with people who have drug and alcohol problems in London.
LDAN IS FUNDED BY THE
Registered Office: Unit 14 Canonbury Yard, 190A New North Road, London N1 7BJ Telephone: 020 7704 0004 Fax: 020 7359 1317 Website: www.ldan.org.uk