1School of Traffic and Transportation Engineering, Central South University, Changsha, Hunan, 410075, China
2The Ningbo Branch of Ordnance Science Institute of China, Ningbo 315103, China
3Beijing Institute of Aeronautical Materials, Beijing 315103, China
The surface roughness and diffraction attenuation of a metal have an effect on the measurement accuracy of the ultrasonic scattering at-tenuation coefficient. In order to correct the scattering atat-tenuation coefficient, the rough surface of the sample and its neighbouring couplant are assumed to be an equivalent medium layer, namely the sample is a multi-layered medium composed of a layer of the substrate medium and two layers of equivalent mediums. Based on the Lommel diffraction correction coefficient and the parameters of the equivalent medium layer, the expressions are developed for a circular planar piston transducer s sound field in a multi-layered structure with equivalent medium layers. As a result, a correction model of the scattering attenuation coefficient is established by using the surface roughness and diffraction attenuation. AISI 304 stainless steel samples with different surface roughnesses are used to conduct the ultrasonic experiment. The results show that the attenua-tion coefficient without correcattenua-tion increases in proporattenua-tion to the roughness; and the average relative error is up to 182.8% compared to the the-oretical attenuation coefficient, while the average relative error is only 1.28% after correction. This indicates that the model can limit the negative effects of the roughness and the sound field diffraction on the extraction of the scattering attenuation coefficient. Consequently, the corrected attenuation coefficient can improve the accuracy and reliability in the nondestructive evaluation of the microstructure.
[doi:10.2320/matertrans.M2016199]
(Received May 31, 2016; Accepted July 22, 2016; Published September 2, 2016)
Keywords: ultrasonic nondestructive evaluation, surface roughness, equivalent multilayer medium, scattering attenuation coefficient, Lommel diffraction correction
1. Introduction
The scattering of ultrasonic waves from the grains or pores in metals can be measured by the attenuation of the waves. Therefore, the microstructures of the metals, such as grain size and porosity, can be evaluated by the scattering
attenua-tion coefficient1–3). However, the coupling and sound field
diffraction can affect the measurement accuracy of the scat-tering attenuation coefficient in practical applications. For example, a material s rough surface can lead to the diffuse reflection of ultrasonic waves, which can worsen the coupling
effect and reduce the reflection echo4), thus resulting in a
large error in measurement of the scattering attenuation. And the experiment showed that the scattering attenuation is
pro-portional to the material s roughness5). Therefore, it is
neces-sary to effectively eliminate the error caused by the surface roughness of the material for the ultrasonic attenuation evalu-ation of the microstructure.
Nagy et al. studied the effect of surface roughness on the ultrasonic attenuation evaluation of the porosity, but only took into account the scattering signal which
singly-transmit-ted from the back-wall6). Chen et al. presented an analytical
model of double transmission signal attenuation using Fres-nel approximation and the phase-screen approximation. The effects of the rough interface on the signal attenuation were also investigated, but this model did not give a corresponding
method for correcting the scattering attenuation7). Reed
cor-related the ultrasonic scattering attenuation of a sample with rough surfaces when evaluating the porosity, but did not take into consideration the scattering attenuation induced by the
sound field5). In addition, Rogers et al. used the Lommel
dif-fraction coefficient method to represent the ultrasonic sound
pressure produced by the circular piston planar transducer8);
Wydra deduced the scattering attenuation coefficient from the Lommel diffraction coefficient on this basis, but this model does not take the effect of the roughness into consideration and has low accuracy and insufficient sensitivity for practical
application9).
In this paper, a roughness correction model for the ultra-sonic scattering attenuation coefficient is deduced based on the equivalent multi-layered medium, which can correct the error caused by the coupling and diffraction attenuation.
2. The Correction Model Based on Equivalent Medium Layer
The sound pressure received by the circular planar piston transducer propagating in a single medium can be expressed with the Lommel diffraction coefficient as:
P(x,f0)=P0D(s) exp(−αsx) (1)
Where
D(s)=1−exp[−(2π/s)i]·[J0(2π/s)+iJ1(2π/s)] (2)
Where P denotes the average sound pressure that the
trans-ducer receives at the sound path x, P0 is the initial sound
pres-sure on the surface of the transducer and αs represents the
scattering attenuation coefficient when propagating in the
medium. D(s) is the Lommel diffraction coefficient, s = 2πx/
ka2 is the effective area of the transducer, the radius of the
transducer is a, k = 2πf0/cf is the wave number at the center
frequency f0 of the transducer, cf is the P-wave velocity of the
fluid, and J0 and J1 are Bessel functions of order zero and one
respectively.
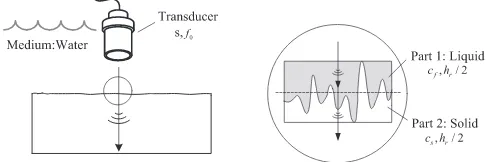
Compared to the root mean square roughness value used in
Ref. 8), the thickness hr of the equivalent medium layer is
*
assumed as Rz, where Rz denotes the maximum height of the profile, namely, the maximum peak-to-valley height within
the sampling length L10), as shown in Fig. 1. Suppose that h
r is much less than the sample thickness h, the equivalent
atten-uation coefficient αr and equivalent P-wave velocity cr of the
medium layer are constant when f0 is constant. At this point,
the substrate medium can be regarded as another layer of the
medium with a perfectly smooth surface. Tfr, Trs, Tsr and Trf
are, respectively, the transmission coefficients from the fluid to the equivalent medium layer, from the equivalent medium layer to the substrate, from the substrate to the equivalent
me-dium layer, from the equivalent meme-dium layer to the fluid. Tfs
and Tsf are the transmission coefficients from the fluid to the
substrate, and from the substrate to the fluid. Rfr, Rrs, Rsr, Rrf,
Rfs and Rsf are the corresponding reflection coefficients.
As-sume that the relationships of all the transmission coefficients
and the reflection coefficients are Tfr = Tfs, Trf = Tsf, Rfr = Rfs,
Rrf = Rsf, Trs = Tsr = 1 and Rrs = Rsr = 0.
The first back-wall echo and the second back-wall echo obtained by the immersion pulse reflection setup are shown in Fig. 2. The upper and lower surface of the sample are manu-factured with the same process and can be considered to have the same thickness of the equivalent medium layer. Then the sound pressure received from the first back-wall echo is
de-noted as:
P1(x1,f0)
=P0Tf rTrsTsrRr fTrsTsrTr fexp(−2αsh−2αfxf−4αrhr)D(s1)
=P0Tf sRs fTs fexp(−2αsh−2αfxf −4αrhr)D(s1)
(3) The sound pressure received from the second back-wall echo is:
P2(x2,f0)=P0Tf rTrsTsrRr fTrsTsrRr fTrsTsrRr fTrsTsrTr f
·exp(−4αsh−2αfxf −8αrhr)D(s2)
=P0Tf sR3s fTs fexp(−4αsh−2αfxf−8αrhr)D(s2)
(4) Where
x1=2xf +4(cr/cf)hr+2(cs/cf)h,
x2=2xf +8(cr/cf)hr+4(cs/cf)h,
s1,2=2πx1,2/ka2.
(5)
Where, P1 and P2 are sound pressures received from the first
and second back-wall echo with the rough layer. xf is the
wa-ter path. x1 and x2 are equivalent sound paths in the fluid with
the medium layer. αf is the attenuation coefficient in the fluid
and αs denotes the actual scattering attenuation coefficient in
the substrate. cs is the P-wave velocity of the solid.
From eqs. (3) and (4), the scattering attenuation coefficient with correction can be obtained as follows
αs=2h1 ln
PP12(x2(x1,,ff00))
R2
s fD(s2)
D(s1)
−2αrhhr (6)
Equation (6) indicates there are two parts in the effect of the surface roughness on the scattering attenuation coeffi-cient. The first part is contained in the Lommel diffraction coefficient, resulting in an increase in the equivalent sound path of ultrasonic waves. It can be found from eq. (5) that this attenuation is not caused by scattering, and therefore it shall be eliminated from the measurement of the scattering attenu-ation coefficient. The second part is directly related to the
equivalent attenuation coefficient αr and equivalent medium
layer thickness, the higher the surface roughness value, the larger the attenuation in the equivalent medium layer. This attenuation is not induced by the scattering attenuation. Equa-tion (6) shows that the ultrasonic scattering attenuaEqua-tion coef-ficient can be corrected by determining the surface roughness when parameters of the equivalent medium layer are known.
The calibration method for the equivalent sound velocity cr
and equivalent attenuation coefficient αr will be introduced
below. As shown in Fig. 3, the propagation process of the ul-Fig. 1 Schematic diagram of equivalent medium layer.
Fig. 2 Schematic diagram of ultrasonic pulse reflection process with the equivalent medium layer.
[image:2.595.60.277.68.241.2] [image:2.595.305.548.74.155.2] [image:2.595.58.282.275.449.2]Equation (7) is simplified as
cr= 1 2
/cf+1/cs (8)
It can be seen from eq. (8) that cr is between the sound
veloc-ity of fluid and that of a solid.
The attenuation coefficient of the equivalent medium layer
of the reference sample is denoted by αRe fr , on the basis of the
constant condition of the equivalent attenuation coefficient we could write:
1 2hln PP12
R2
s fD(s2)
D(s1) −2αr
hr h
= 1 2hRe f ln
PRe f1 PRe f2
R2
s fDRe f(s2)
DRe f(s1)
−2αRe fr h Re f r
hRe f αr=αRe fr
(9)
The following equation can be obtained from eq. (9)
αr=
hln
PRe f1 PRe f2
R2
s fDRe f(s2)
DRe f(s1)
−hRe fln PP12
R2
s fD(s2)
D(s1)
4(hRe fr h−hrhRe f)
(10)
Therefore, the equivalent attenuation coefficient αr can be
calibrated by eq. (10).
In addition, in order to emphasize the relationship between
the attenuation coefficient α without correction and the
medi-um layer hr, the attenuation coefficient is defined from eq. (6)
α= 1 2hln
P1(x1,f0)
P2(x2,f0) =αs+2αr
hr h − 1 2hln R2
s fD(s2)
D(s1)
(11) In order to analyze the difference between the attenuation coefficients with and without correction under different sur-face roughnesses more intuitively, the scattering attenuation
coefficient αs = 14.9864 m/s, equivalent attenuation
coeffi-cient αr = 1542.6 m/s, equivalent sound velocity cr =
2366.396 m/s, h = 1.9971 cm, cs = 5950 m/s, cf = 1480 m/s,
Rsf = 0.9381 and f0 = 10 MHz are substituted into eq. (11).
The theoretical result is shown in Fig. 4.
It can be seen from Fig. 4 that the scattering attenuation
coefficient αr increases in proportion to the roughness hr, but
the corrected scattering attenuation coefficient of the theoret-ical smooth sample is not affected by changes in the rough-ness and the water path (i.e. the diffraction attenuation).
3. Experiment and Analysis
3.1 Experimental result
AISI 304 stainless steel with the face-centered cubic (FCC) structure was chosen as the experimental material, whose chemical composition is shown in Table 1. First, 5 blanks
were acquired via wire cutting with the overall dimension of
ϕ25 × 20 mm, they can be considered to be of the same
inter-nal microstructure without any other treatment. Then, the up-per and lower surface of each sample was processed by pro-cess of the electrical discharge machining to obtain a group of samples with surface roughness distribution gradients. The sample with the smallest roughness is used as a reference sample, it was sanded with 2000 grit sandpaper, and polished
to approximate smoothness with nylon cloth and 1 μm
alumi-na solution. The surface roughness of each sample was mea-sured using TR210 TIME roughness tester, the profile arith-metical mean deviation Ra, profile maximum height Rz, and the thickness D of each sample are measured, as Table 2 shows.
The ultrasonic signal acquisition system adopted in the ex-periment is displayed in Fig. 5. An Olympus 5072PR
ultra-sonic pulse generator/receiver was employed; it was
connect-ed to a V317-SU-F2.3 planar transducer whose center
fre-quency f0 is 10 MHz. A high-speed data acquisition card
ADLINK PCIe-9852 whose sampling frequency is 200 MHz was adopted to obtain the waveforms. DMC2610 PCI bus 6-axis motion control card and 6-DOF motion platform were used to guarantee that the transducer is positioned perpendic-ular to the sample surface. The ultrasonic data were acquired on the sample #0 #4 with the above system respectively, and Table 1 The chemical composition of the AISI 304 stainless steel (mass%).
C Mn P S Cr Si Ni N
[image:3.595.314.542.70.243.2]0.055 1.67 0.028 0.008 18.64 0.38 9.45 0.087
Table 2 Surface roughness and thickness of all samples.
Sample No. Ra/μm Rz/μm D/cm
#0 0.0613 0.415 1.9897
#1 4.5630 25.305 1.9980
#2 9.2185 51.489 2.0049
#3 10.0190 57.194 2.0122
#4 12.5910 63.248 1.9971
Fig. 4 Diagram of relationship between the roughness hr and attenuation
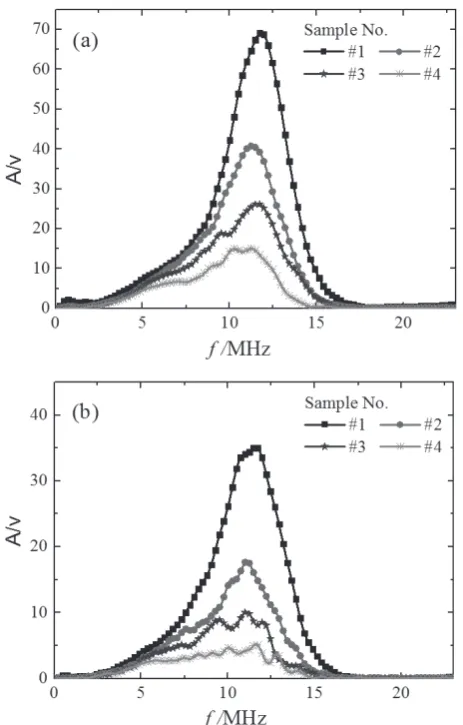
[image:3.595.51.298.280.424.2] [image:3.595.305.549.384.463.2]20 sets of ultrasonic signals were acquired for each sample. The first and second back-wall echo of the ultrasonic signal of the sample are extracted, then waveforms were processed
by Fast Fourier Transform (FFT) to obtain P1(x1, f0) and
P2(x2, f0) respectively. Ultrasonic signals extracted from
dif-ferent samples are shown in Fig. 6. It can be seen in Fig. 6 that the amplitude spectrums of the signals are inversely pro-portional to the surface roughness of the samples.
Assuming the sound velocity of water and stainless steel as
1480 m/s and 5950 m/s respectively, the equivalent sound
velocity cr is obtained as 2366.396 m/s according to eq. (8).
Samples #0 and #2 were used as the reference and test sample of the experiment respectively, the equivalent attenuation
co-efficient αr = 1542.65 NP·m−1 was obtained with eq. (10) by
using amplitudes of two waveforms, sample thickness and thickness of the equivalent medium layer at the center fre-quency of 10 MHz.
The scattering attenuation coefficient of different samples can be corrected by using eq. (6) and two equivalent parame-ters. Figure 7 shows the total attenuation coefficient and scat-tering attenuation coefficient with correction of each sample. As seen in Fig. 7, the total attenuation coefficient without cor-rection increases in proportion to the surface roughness of the sample, which means that the attenuation caused by the sur-face roughness accounts for an increasing proportion in the total attenuation, but the scattering attenuation coefficient with correction eliminated the attenuation caused by the roughness and remains roughly the same.
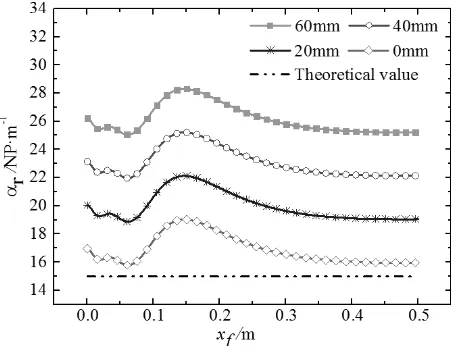
In addition, sample #6 was used to conduct the experiment, and the changing relationship between the scattering attenua-tion coefficient with and without correcattenua-tion and the water path was obtained with a constant roughness, as shown in Fig. 8. As anticipated, the figure shows that the scattering at-Fig. 5 Schematic diagram of the ultrasonic signal acquisition system.
Fig. 6 Ultrasonic signal amplitude spectrum of samples with different roughness (a) the first back-wall echo (b) the second back-wall echo.
Fig. 7 Scattering attenuation coefficient with and without correction.
[image:4.595.313.538.68.236.2] [image:4.595.48.292.69.203.2] [image:4.595.53.285.246.609.2] [image:4.595.313.541.282.461.2]tenuation coefficient without correction changes with the wa-ter path while the attenuation coefficient with correction is relatively stable.
3.2 Result analysis
First, the metallographic images of the five samples were obtained using the Leica DM4000M microscope system, as shown in Fig. 9. Grain sizes of stainless steel were measured with the linear intercept method according to the American
standard11). The results are 17.52 ± 1.2 μm, 18.23 ± 1.0 μm,
17.05 ± 0.8 μm, 18.04 ± 1.1 μm and 17.60 ± 1.1 μm
respec-tively. This validates the consistency in the internal micro-structure of samples #0 #4. The theoretical scattering
atten-uation coefficient is 13.6584 NP·m−1 according to the
densi-ty, elastic constants and grain size of the stainless steel
sam-ple12). But the attenuation coefficient of all samples measured
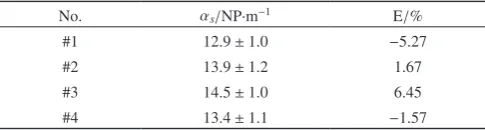
in the experiment increase due to the effect of the surface roughness as shown in Fig. 7. Table 3 shows the scattering attenuation coefficient of all samples with correction based on eq. (6).
In this paper, the scattering attenuation coefficients with
correction stabilize at 13 NP·m−1 and the relative error
be-tween the observed values and theoretical values do not
ex-ceed ±7%. This shows that the scattering attenuation
coeffi-cient can effectively be corrected.
Further, in order to verify the rationality of the assumption that the equivalent parameters are constant with different
thicknesses of equivalent medium layers within hr ≪ h,
sam-ple combinations with different roughnesses were selected as the reference and test sample to calibrate the equivalent atten-uation coefficient. For example, the equivalent attenatten-uation
coefficient of #0 and #3 is 1638.62 NP·m−1, #0 and #4 is
1561.47 NP·m−1, which means that the calibrated equivalent
attenuation coefficients are basically the same. As the equiva-lent sound velocity is related to the sound velocities of water and stainless steel, this assumption is reasonable. So accord-ing to the constant equivalent parameters within the range of a certain roughness, the method in this paper can be used to correct scattering attenuation coefficients for samples with different roughnesses.
4. Conclusions
An idea of the equivalent multilayer medium is presented in this paper, with which a method for correcting the scatter-ing attenuation coefficient is developed by considerscatter-ing the effect of surface roughness and sound field diffraction. It cal-ibrates the parameters in the equivalent medium layer by us-ing the experimental data of the reference sample, and cor-rects scattering attenuation coefficients of metals with differ-ent surface roughnesses.
The assumption that the equivalent parameter is constant at different thicknesses of equivalent medium layers is verified through the experiment. The experimental results show that corrected scattering attenuation coefficients of the metals with different surface roughnesses and same mean grain size agree well with each other.
Surface roughnesses used in this paper need be determined with a surface roughometer, and future work will be done to develop a method for ultrasonic evaluation of the surface roughness which will be integrated with the correction model in this paper so as to improve its practicability.
Acknowledgements
This work was supported by the National Natural Science Foundation of China (Grant Nos. 61271356 and 51575541), and Zhejiang Key Discipiline of Instrument Science and tech-nology (Grant No. JL150509), and Natual Science Founda-tion of Zhejiang Province (LY15E050012). The authors would like to express their gratitude to T. D. Ashworth for English writing.
Fig. 9 Metallographical images of the samples. (a) #0, (b) #1, (c) #2, (d) #3, (e) #4.
Table 3 The scattering attenuation coefficient of each sample with correc-tion.
No. αs/NP·m−1 E/%
#1 12.9 ± 1.0 −5.27
#2 13.9 ± 1.2 1.67
#3 14.5 ± 1.0 6.45
[image:5.595.129.469.69.247.2] [image:5.595.47.290.309.374.2]REFERENCES
1) M. Aghaie-Khafri, F. Honarvar and S. Zanganeh: J Nondestruct Eval 31 (2012) 191–196.
2) A.A. Karabutov and N.B. Podymova: Compos., Part B Eng. 56 (2014) 238–244.
3) V. Özkan and I.H. Sarpiin: Acta Phys. Pol. A 121 (2012) 184–186. 4) G.V. Blessing, P.P. Bagley and J.E. James: 1983 Ultrasonics
Sympo-sium (1983) 923–927.
5) F.A. Reed, T.J. Batainger and R.W. Reed: Review of Progress in Quan-titative Nondestructive Evaluation, (Springer US, 1993) pp.1265–1272.
6) P.B. Nagy and L. Adler: J. Acoust. Soc. Am. 82 (1987) 193–197. 7) Z. Chen and L. Yang: Ultrasonics 51 (2011) 49–56.
8) P.H. Rogers and A.L. Van Buren: J. Acoust. Soc. Am. 55 (1974) 724– 728.
9) A. Wydra, A.M. Chertov, R.Gr. Maev, C.M. Kube, H. Du and J.A. Turn-er: Res. Nondestruct. Eval. 26 (2015) 225–243.
10) W.A. Tasong, C.J. Lynsdale and J.C. Cripps: Cement Concrete Res. 28 (1998) 1453–1465.
11) R. Bianco and R.W. Buckman Jr.: Oxide strengthened molybde-num-rhenium alloy. U.S. Patent 6,102,979[P]. 2000-8-15.