Predicting Automatic Speech Recognition Performance Using
Prosodic Cues
D i a n e J . L i t m a n a n d J u l i a B . H i r s c h b e r g M a r c S w e r t s
A T & T L a b s - - R e s e a r c h I P O , C e n t e r for U s e r - S y s t e m I n t e r a c t i o n F l o r h a m P a r k , N J 07932-0971 U S A E i n d h o v e n , T h e N e t h e r l a n d s
{ diane,julia} @research. att.com
[email protected]
A b s t r a c t
In spoken dialogue systems, it is important for a system to know how likely a speech recognition hy- pothesis is to be correct, so it can reprompt for fresh input, or, in cases where many errors have occurred, change its interaction strategy or switch the caller to a human attendant. We have discov- ered prosodic features which more accurately predict when a recognition hypothesis contains a word error than the acoustic confidence score thresholds tradi- tionally used in automatic speech recognition. We present analytic results indicating that there are sig- nificant prosodic differences between correctly and incorrectly recognized turns in the T O O T train in-
formation corpus. We then present machine learn- ing results showing how the use of prosodic features to automatically predict correct versus incorrectly recognized turns improves over the use of acoustic confidence scores alone.
1 I n t r o d u c t i o n
One of the central tasks of the dialogue manager in most current spoken dialogue systems (SDSs) is error handling. The automatic speech recognition (ASR) component of such systems is prone to error, especially when the system has to operate in noisy conditions or when the domain of the system is large. Given that it is impossible to fully prevent ASR er- rors, it is important for a system to know how likely a speech recognition hypothesis is to be correct, so it can take appropriate action, since users have con- siderable difficulty correcting incorrect information that is presented by the system as true (Krahmer et al., 1999). Such action may include verifying the user's input, reprompting for fresh input, or, in cases where many errors have occurred, changing the in- teraction strategy or switching the caller to a human attendant (Smith, 1998; Litman et al., 1999; Langk- ilde et al., 1999). Traditionally, the decision to re- j e c t a recognition hypothesis is based on acoustic confidence score thresholds, which provide a relia- bility measure on the hypothesis and are set in the application (Zeljkovic, 1996). However, this process often fails, as there is no simple one-to-one mapping
between low confidence scores and incorrect recog- nitions, and the setting of a rejection threshold is a matter of trial and error (Bouwman et al., 1999). Also, some incorrect recognitions do not necessarily lead to misunderstandings at a conceptual level (e.g.
"a.m." recognized as "in the morning").
The current paper looks at prosody as one possible predictor of ASR performance. ASR performance is known to vary based upon speaking style (Wein- traub et al., 1996), speaker gender and age, na- tive versus non-native speaker status, and, in gen- eral, the deviation of new speech from the training data. Some of this variation is linked to prosody, as prosodic differences have been found to character- ize differences in speaking style (Blaauw, 1992) and idiosyncratic differences (Kraayeveld, 1997). Sev- eral other studies (Wade et al., 1992; Oviatt et al., 1996; Swerts and Ostendorf, 1997; Levow, 1998; Bell and Gustafson, 1999) report that hyperarticulated speech, characterized by careful enunciation, slowed speaking rate, and increase in pitch and loudness, often occurs when users in human-machine interac- tions try to correct system errors. Still others have shown that such speech also decreases recognition performance (Soltau and Waibel, 1998). Prosodic features have also been shown to be effective in ranking recognition hypotheses, as a post-processing filter to score ASR hypotheses (Hirschberg, 1991; Veilleux, 1994; Hirose, 1997).
dict whether an utterance has been misrecognized, with a high degree of accuracy.
2 T h e T O O T C o r p u s
Our corpus consists of a set of dialogues between humans and TOOT, an SDS for accessing train schedules from the web via telephone, which was collected to study both variations in SDS strat- egy and user-adapted interaction (Litman and Pan, 1999). TOOT is implemented on a platform com- bining ASR, text-to-speech, a phone interface, a finite-state dialogue manager, and application func- tions ( K a m m et al., 1997). T h e speech recognizer is a speaker-independent hidden Markov model system with context-dependent phone models for telephone speech and constrained g r a m m a r s for each dialogue state. Confidence scores for recognition were avail- able only at the turn, not the word, level (Zeljkovic, 1996). An example T O O T dialogue is shown in Fig-
ure 1.
Subjects performed four tasks with one of sev- eral versions of TOOT, t h a t differed in terms of locus of initiative (system, user, or mixed), confirmation strategy (explicit, implicit, or none), and whether these conditions could be changed by the user during the task. Subjects were 39 students, 20 native speak- ers of standard American English and 19 non-native speakers; 16 subjects were female and 23 male. Dia- logues were recorded and system and user behavior logged automatically. T h e concept accuracy (CA) of each turn was manually labeled by one of the exper- imenters. If the ASR o u t p u t correctly captured all the task-related information in the turn (e.g. time, departure and arrival cities), the turn was given a CA score of 1 (a semantically correct recognition).
Otherwise, the CA score reflected the percentage of correctly recognized task information in the turn. T h e dialogues were also transcribed by hand and these transcriptions automatically compared to the ASR recognized string to produce a word error rate
(WEPt) for each turn. Note t h a t a concept can be correctly recognized even though all words are not, so the CA metric does not penalize for errors that are u n i m p o r t a n t to overall utterance interpretation. For the study described below, we examined 1994 user turns from 152 dialogues in this corpus. T h e speech recognizer was able to generate a recognized string and an associated acoustic confidence score per turn for 1975 of these turns. 1 1410 of these 1975 turns had a CA score of 1 (for an overall conceptual accuracy score of 71%) and 961 had a W E R of 0 (for an overall transcription accuracy score of 49%, with a mean W E R per turn of 47%).
1For the remaining turns, ASR output "no speech" (and TOOT played a timeout message) or "garbage"
(TOOT
played a rejection message).3 D i s t i n g u i s h i n g C o r r e c t f r o m I n c o r r e c t R e c o g n i t i o n s
We first looked for distinguishing prosodic charac- teristics of misrecognitions, defining misrecognitions in two ways: a) as turns with W E R > 0 ; and b) as turns with C A < I . As noted in Section 1, previous studies have speculated that hyperarticulated speech (slower and louder speech which contains wider pitch excursions) may be associated with recognition fail- ure. So, we examined the following features for each
user turn: 2
• m a x i m u m and mean fundamental frequency values (F0 Max, F0 Mean)
• m a x i m u m and mean energy values (RMS Max, RMS Mean)
• total duration
• length of pause preceding the turn (Prior Pause) * speaking rate (Tempo)
• a m o u n t of silence within the turn (% Silence) F0 and I:LMS values, representing measures of pitch excursion and loudness, were calculated from the o u t p u t of Entropic Research Laboratory's pitch tracker, get_fO, with no post-correction. T i m i n g vari- ation was represented by four features. Duration within and length of pause between turns was com- puted from the temporal labels associated with each turn's beginning and end. Speaking rate was ap- proximated in terms of syllables in the recognized string per second, while % Silence was defined as the percentage of zero frames in the turn, i.e., roughly the percentage of time within the turn that the speaker was silent. These features were chosen based upon previous findings (see Section 1) and observa- tions from our data.
To ensure t h a t our results were speaker indepen- dent, we calculated mean values for each speaker's recognized turns and their misrecognized turns for every feature. Then, for each feature, we created vectors of speaker means for recognized and misrec- ognized turns and performed paired t-tests on the vectors. For example, for the feature "F0 m a x " , we calculated mean m a x i m a for misrecognized turns and for correctly recognized turns for each of our thirty-nine speakers. We then performed a paired t-test on these thirty-nine pairs of means to de- rive speaker-independent results for differences in F0 m a x i m a between correct and incorrect recognitions. Tables 1 and 2 show results of these compar- isons when we calculate misrecognition in terms of
Toot: User: Toot: User: Toot:
Hi, this is A T & T A m t r a k schedule system. This is T O O T . How may I help you?
I want the trains from New York City to Washington DC on Monday at 9:30 in the evening. Do you want me to find the trains from New York City to Washington DC on Monday approximately at 9:30 in the evening now?
Yes.
I am going to get the train schedule for you . . .
Figure 1: Example Dialogue Excerpt with TOOT.
Table 1: Comparison of Misrecognized ( W E R > 0 ) vs. Recognized Turns by Prosodic Feature Across Speakers.
Fe tur0 I st tlMeanMisrecdRocd PII
*F0 M a x 7.83 30.31 Hz 0*F0 Mean 3.66 ~I.12 Hz 0
*RMS Max 5.70 235.93 0
RMS Mean -.57 -8.50 .57
*Duration 10.30 2.20 sec 0
*Prior Pause 5.55 .35 sec 0 T e m p o -.05 .15 sps .13
*% Silence -5.15 -.06% 0
*significant at a 95% confidence level
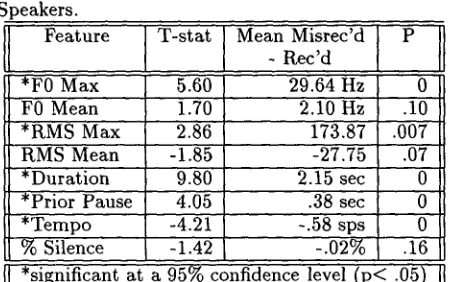
Table 2: Comparison of Misrecognized ( C A < I ) vs. Recognized Turns by Prosodic Feature Across Speakers.
Fe turo I st t ° nMisrecdl
rlq ecd
*F0 Max 5.60 29.64 Hz 0
F0 Mean 1.70 2.10 Hz .10
*RMS Max 2.86 173.87 .007
RMS Mean -1.85 -27.75 .07
*Duration 9.80 2.15 sec 0
*Prior Pause 4.05 .38 sec 0
*Tempo -4.21 -.58 sps 0
% Silence -1.42 -.02% .16
*significant at a 95% confidence level ( p < .05)
W E R > 0 and C A < l , respectively. These results in- dicate that misrecognized turns do differ from cor- rectly recognized ones in terms of prosodic features, although the features on which they differ vary slightly, depending upon the way "misrecognition" is defined. W h e t h e r defined by W E R or CA, mis- recognized turns exhibit significantly higher F0 and RMS maxima, longer durations, and longer preced- ing pauses than correctly recognized speaker turns. For a traditional W E R definition of misrecognition, misrecognitions are slightly higher in mean F0 and contain a lower percentage of internal silence. For a CA definition, on the other hand, t e m p o is a signif- icant factor, with misrecognitions spoken at a faster rate than correct recognitions - - contrary to our hy- pothesis about the role of hyperarticulation in recog- nition error.
While the comparisons in Tables 1 and 2 were made on the means of raw values for all prosodic fea- tures, little difference is found when values are nor- malized by value of first or preceding turn, or by con- verting to z scores. 3 From this similarity between the performance of raw and normalized values, it would seem to be relative differences in speakers' prosodic values, not deviation from some 'acceptable' range, t h a t distinguishes recognition failures from success- ful recognitions. A given speaker's turns t h a t are
The only differences occur for CA defined misrecognition, where normalizing by first u t t e r a n c e results in significant dif- ferences in m e a n RMS, and normalizing by preceding t u r n results in n o significant differences in tempo.
higher in pitch or loudness, or that are longer, or that follow longer pauses, are less likely to be recog- nized correctly t h a n that same speaker's turns t h a t are lower in pitch or loudness, shorter, and follow shorter pauses - - however correct recognition is de- fined.
It is interesting to note that the features we found to be significant indicators of failed recognitions (F0 excursion, loudness, long prior pause, and longer du- ration) are all features previously associated with hyperarticulated speech. Since prior research has suggested t h a t speakers may respond to failed recog- nition a t t e m p t s by hyperarticulating, which itself m a y lead to more recognition failures, had we in fact simply identified a means of characterizing and iden- tifying hyperarticulated speech prosodically?
[image:3.612.356.581.217.358.2] [image:3.612.111.336.224.360.2]for the prosodic characteristics of recognized and of misrecognized turns hold even when perceptibly hy- perarticulated turns are excluded from the corpus. 4 P r e d i c t i n g M i s r e c o g n i t i o n s U s i n g
M a c h i n e L e a r n i n g
Given the prosodic differences between misrecog- nized and correctly recognized utterances in our corpus, is it possible to predict accurately when a particular utterance will be misrecognized or not? This section describes experiments using the ma- chine learning program RIPPER (Cohen, 1996) to au- tomatically induce prediction models, using prosodic as well as additional features. Like m a n y learning programs, RIPPER takes as input the classes to be learned, a set of feature names and possible values, and training d a t a specifying the class and feature values for each training example. RIPPER outputs a classification model for predicting the class of fu- ture examples. The model is learned using greedy search guided by an information gain metric, and is expressed as an ordered set of if-then rules.
Our predicted classes correspond to correct recog- nition (T) or not (F). As in Section 3, we examine both WER-defined and CA-defined notions of cor- rect recognition, and represent each user turn as a set of features. T h e features used in our learning experiments include the raw prosodic features in Ta- bles 1 and 2 (which we will refer to as the feature set "Prosody"), the hyperarticulation score discussed in Section 3, and the following additional potential pre- dictors of misrecognition (described in Section 2):
• ASR g r a m m a r • ASR confidence • ASR string
• system adaptability • dialogue strategy • task number • subject • gender
• native speaker
T h e first three features are derived from the ASR process (the context-dependent g r a m m a r used to recognize the turn, the turn-level acoustic confidence score o u t p u t by the recognizer, and the recognized string). We included these features as a baseline against which to test new methods of predicting misrecognitions, although, currently, we know of no ASR system that includes recognized string in its rejection calculations. 4 TOOT itself used only the 4Note that, while the entire recognized string is provided to the learning algorithm, RIPPER rules test for the presence of particular words in the string.
first two features to calculate rejections and ask the user to repeat the utterance, whenever the confi- dence score fell below a pre-defined grammar-specific threshold. T h e other features represent the exper- imental conditions under which the d a t a was col- lected (whether users could adapt TOOT's dialogue strategies, TOOT's initial initiative and confirmation strategies, experimental task, speaker's name and characteristics). We included these features to de- termine the extent to which particulars of task, sub- ject, or interaction influenced ASR success rates or our ability to predict them; previous work showed that these factors impact TOOT's performance (Lit- m a n and Pan, 1999; Hirschberg et al., 1999). Except for the task, subject, gender, native language, and hyperarticulation scores, all of our features are au- tomatically available.
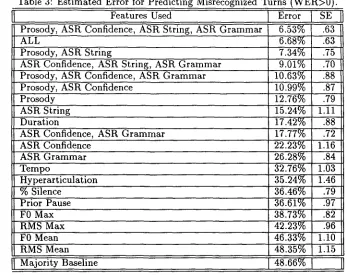
Table 3 shows the relative performance of a num- ber of the feature sets we examined; results here are for misrecognition defined in terms of WER. 5 A baseline classifier for misrecognition, predicting that ASR is always wrong (the majority class of F), has an error of 48.66%. The best performing feature set includes only the raw prosodic and ASR features and reduces this error to an impressive 6.53% + / - .63%. Note t h a t this performance is not improved by adding manually labeled features or experimen- tal conditions: the feature set corresponding to ALL features yielded the statistically equivalent 6.68% + / - 0.63%.
With respect to the performance of prosodic fea- tures, Table 3 shows that using them in conjunction with ASR features (error of 6.53%) significantly out- performs prosodic features alone (error of 12.76%), which, in turn, significantly outperforms any single prosodic feature; duration, with an error of 17.42%, is the best such feature. Although not shown in the table, the u n n o r m a l i z e d prosodic features sig- nificantly o u t p e r f o r m the normalized versions by 7- 13%. Recall t h a t prosodic features normalized by first task utterance, by previous utterance, or by z scores showed little performance difference in the analyses performed in Section 3. This difference m a y indicate that there are indeed limits on the ranges in features such as F0 and RMS maxima, duration and preceding pause within which recognition per- formance is optimal. It seems reasonable that ex- treme deviation from characteristics of the acoustic training material should in fact impact ASR perfor- mance, and our experiments m a y have uncovered, if not the critical variants, at least i m p o r t a n t acoustic correlates of them. However, it is difficult to com-
Table 3: Estimated Error for Predicting Misrecognized Turns (WER>0).
Features Used Error ] SE
Prosody, ASR Confidence, ASR String, ASR Grammar 6.53% .63
ALL 6.68% .63
Prosody, ASR String 7.34% .75
ASR Confidence, ASR String, ASR Grammar 9.01% .70 Prosody, ASR Confidence, ASR Grammar 10.63% .88
Prosody, ASR Confidence 10.99% .87
Prosody 12.76% .79
ASR String 15.24% 1.11
Duration 17.42% .88
ASR Confidence, ASR Grammar 17.77% .72
ASR Confidence 22.23% 1.16
ASR Grammar 26.28% .84
Tempo 32.76% 1.03
Hyperarticulation 35.24% 1.46
% Silence 36.46% .79
Prior Pause 36.61% .97
F0 Max 38.73% .82
RMS Max 42.23% .96
F0 Mean 46.33% 1.10
RMS Mean 48.35% 1.15
II Majority Baseline J. 48.66%_%_[___~
pare our machine learning results with the statisti- cal analyses, since a) the statistical analyses looked at only a single prosodic variable at a time, and b) data points for that analysis were means calculated per speaker, while the learning algorithm operated on all utterances, allowing for unequal contributions by speaker.
We now address the issue of what prosodic fea- tures are contributing to misrecognition identifica- tion, relative to the more traditional ASR tech- niques. Do our prosodic features simply correlate with information already in use by ASR systems (e.g., confidence score, grammar), or at least avail- able to them (e.g., recognized string)? First, the error using ASR confidence score alone (22.23%) is significantly worse than the error when prosodic features are combined with ASR confidence scores (10.99%) - - and is also significantly worse than the use of prosodic features alone (12.76%). Simi- larly, the error using ASR confidence scores and the ASR grammar (17.77%) is significantly worse than prosodic features alone (12.76%). Thus, prosodic features, either alone or in conjunction with tradi- tional ASR features, significantly outperform these traditional features alone for predicting WER-based misrecognitions.
Another interesting finding from our experiments is the predictive power of information available to current ASR systems but not made use of in calcu- lating rejection likelihoods, the identity of the recog-
nized string. This feature is in fact the best perform- ing single feature in predicting our data (15.24%). And, at a 95% confidence level, the error using ASR confidence scores, the recognized string, and grammar (9.01%) matches the performance of our best performing feature set (6.53%). It seems that, at least in our task and for our ASR system, the appearance of particular words in the recognized strings is an extremely useful cue to recognition ac- curacy. So, even by making use of information cur- rently available from the traditional ASR process, ASR systems could improve their performance on identifying rejections by a considerable margin. A caveat here is that this feature, like grammar state, is unlikely to generalize from task to task or recog- nizer to recognizer, but these findings suggest that both should be considered as a means of improving rejection performance in stable systems.
The classification model learned from the best per- forming feature set in Table 3 is shown in Figure 2. 6 The first rule R I P P E R finds with this feature set is that if the user turn is less than .9 seconds and the recognized string contains the word "yes" (and possi- bly other words as well), with an acoustic confidence score > -2.6, then predict that the turn will be cor- rectly recognized.7 Note that all of the prosodic fea-
6Rules are p r e s e n t e d in o r d e r of i m p o r t a n c e in classifying d a t a . W h e n m u l t i p l e rules are applicable, RIPPER uses t h e first rule.
[image:5.612.169.516.95.370.2]if (duration if (duration if (duration if (duration if (duration if (duration if (duration if (duration if (duration if (duration if (duration if (duration else F
< 0.897073) A (confidence > -2.62744 ) A (string contains 'yes') t h e n T < 1.03872 ) A (confidence > -2.69775) A (string contains 'no') t h e n T < 0.982051) A (confidence > -1.99705) A (tempo > 3.1147) t h e n T
< 0.813633) A (duration > 0.642652) A (confidence > -3.33945) A (F0 Mean > 176.794) t h e n T < 1.30312) A (confidence > -3.37301) A (% silences ~_ 0.647059) t h e n T
0.610734) A (confidence > -3.37301) A (% silences > 0.521739) t h e n T < 1.09537) A (string contains 'Baltimore') t h e n T
< 0.982051) A (string contains 'no') t h e n T
< 1.1803) A (confidence > -2.93085) A (grammar ---- date) t h e n T
< 1.09537) A (confidence > -2.30717) A (% silences > 0.356436) A (F0 Max > 249.225) t h e n T < 0.868743) A (confidence > -4.14926 ) A (% silences > 0.51923) A (F0 Max > 205.296) t h e n T < 1.18036) A (string contains 'Philadelphia') t h e n T
Figure 2: Ruleset for Predicting Correctly Recognized Turns ( W E R = 0) from Prosodic and ASR Features.
tures except for RMS mean, max, and prior pause appear in at least one rule, and that the features shown to be significant in our statistical analyses (Section 3) are not the same features as in the rules. But, as noted above, our d a t a points in these two experiments differ. It is useful to note though, that while this ruleset contains all three ASR features, none of the experimental parameters was found to be a useful predictor, suggesting that our results are not specific to the particular conditions of and par- ticipants in the corpus collection, although they are specific to the lexicon and grammars.
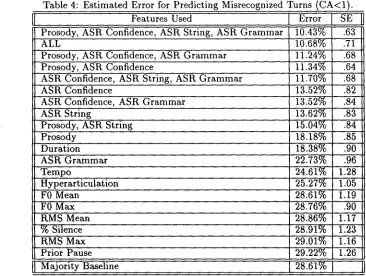
Results of our learning experiments with mis- recognition defined in terms of CA rather than W E R show the overall role of the features which predict WER-defined misrecognition to be less successful in predicting CA-defined error. Table 4 shows the relative performance of the same feature sets dis- cussed above, with misrecognition now defined in terms of C A < I . As with the W E R experiments, the best performing feature set makes use of prosodic and ASR-derived features. However, the predictive power of prosodic over ASR features decreases when misrecognition is defined in terms of CA - - which is particularly interesting since ASR confidence scores are intended to predict W E R rather than CA; the er- ror rate using ASR confidence scores alone (13.52%) is now significantly lower than the error obtained using prosody (18.18%). However, prosodic features still improve the predictive power of ASR confidence scores, to 11.34%, although this difference is not sig- nificant at a 95% confidence level. And the error rate of the three ASR features combined (11.70%) is reduced to the lowest error rate in our table when prosodic features are added (10.43%); this error rate is (just) significantly different from the use of ASR confidence scores alone. Thus, for CA-defined mis- recognitions, our experiments have uncovered only minor improvements over traditional ASR rejection calculation procedures.
5
D i s c u s s i o n
A statistical comparison of recognized versus mis- recognized utterances indicates that F0 excursion, loudness, longer prior pause, and longer duration are significant prosodic characteristics of both W E R and CA-defined failed recognition attempts. Results from a set of machine learning experiments show that prosodic differences can in fact be used to im- prove the prediction of misrecognitions with a high degree of accuracy (12.76% error) for WER-based m i s r e c o g n i t i o n s - and an even higher degree (6.53% error) when combined with information currently available from ASR systems. The use of ASR confi- dence scores alone had a predicted W E R of 22.23%, so the improvement over traditional methods is quite considerable. For CA-defined misrecognitions, the improvement provided by prosodic features is con- siderably less. One of our future research directions will be to understand this difference.
Another future direction will be to address the is- sue of just w h y prosodic features provide such use- ful indicators of recognition failure. Do the features themselves make recognition difficult, or are they instead indirect correlates of other phenomena not captured in our study? While the negative influence of speaking rate variation on ASR has been reported before (e.g. (Ostendorf et al., 1996), it is tradition- ally assumed that ASR is impervious to differences in F0 and RMS; yet, it is known that F0 and RMS variations co-vary to some extent with spectral char- acteristics (e.g. (Swerts and Veldhuis, 1997; Fant et al., 1995)), so that it is not unlikely t h a t utterances with extreme values for these m a y differ critically from the training data. Other prosodic features m a y be more indirect indicators of errors. Longer ut- terances m a y simply provide more chance for error than shorter ones, while speakers who pause longer before utterances and take more time making them may also produce more disfluencies than others.
Table 4: Estimated Error for Predicting Misrecognized Turns (CA<l).
Features Used [ Error
Prosody, ASR Confidence~ ASR String, ASR Grammar 10.43% .63
ALL 10.68% .71
Prosody, ASR Confidence, ASR Grammar 11.24% .68
Prosody, ASR Confidence 11.34% .64
ASR Confidence, ASR String, ASR Grammar 11.70% .68
ASR Confidence 13.52% .82
ASR Confidence, ASR Grammar 13.52% .84
ASR String 13.62% .83
Prosody, ASR String 15.04% .84
Prosody 18.18% .85
Duration 18.38% .90
ASR Grammar 22.73% .96
Tempo 24.61% 1.28
Hyperarticulation 25.27% 1.05
F0 Mean 28.61% 1.19
F0 Max 28.76% .90
RMS Mean 28.86% 1.17
% Silence 28.91% 1.23
RMS Max 29.01% 1.16
Prior Pause 29.22% 1.26
Majority Baseline [ 28.61%
spoken dialogue system that supported registration, checking paper status, and information access for the IEEE Automatic Speech Recognition and Under- standing Workshop (ASRU99) (Rahim et al., 1999). This system employed the AT&T WATSON speech recognition technology (Sharp et al., 1997). Prelim- inary results indicate that our T O O T results do in fact hold up across recognizers. We also are extend- ing our TOOT corpus analysis to include prosodic analyses of turns in which users become aware of misrecognitions and correct them. In addition, we are exploring whether prosodic differences can help explain the "goat" phenomenon - - the fact that some voices are recognized much more poorly than others (Doddington et al., 1998; Hirschberg et al., 1999). Our ultimate goal is to provide prosodically- based mechanisms for identifying and reacting to ASR failures in SDS systems.
A c k n o w l e d g e m e n t s
We would like to thank Jennifer Chu-Carroll, Candy Kamm, participants in the AT&T "SLUG" seminar series, and participants in the 1999 JHU Summer Language Engineering Workshop, for providing us with useful comments on this research and on earlier versions of this paper.
R e f e r e n c e s
Linda Bell and Joakim Gustafson. 1999. Repe- tition and its phonetic realizations: Investigat-
ing a Swedish database of spontaneous computer- directed speech. In
Proceedings of ICPhS-99,
San Francisco. International Congress of Phonetic Sci- ences.E. Blaauw. 1992. Phonetic differences between read and spontaneous speech. In
Proceedings of IC-
SLP92,
volume 1, pages 751-758, Banff.A. G. Bouwman, J. Sturm, and L. Boves. 1999. Incorporating confidence measures in the dutch train timetable information system developed in the ARISE project. In
Proc. International Con-
ference on Acoustics, Speech and Signal Process-
ing,
volume 1, pages 493-496, Phoenix.William Cohen. 1996. Learning trees and rules with set-valued features. In
l$th Conference of the
American Association of Artificial Intelligence,
AAAI.
George Doddington, Walter Liggett, Alvin Martin, Mark Przybocki, and Douglas Reynolds. 1998. Sheep, goats, lambs and wolves: A statistical anal- ysis of speaker performance in the NIST 1998 speaker recognition evaluation. In
Proceedings of
ICSLP-98.
G. Fant, J. Liljencrants, I. Karlsson, and M. B£veg£rd. 1995. Time and frequency do- main aspects of voice source modelling. BR Speechmaps 6975, ESPRIT. Deliverable 27 WP 1.3.
[image:7.612.144.510.93.369.2]Prosody: Computational Models for Processing Spontaneous Speech, pages 327-342. Springer. Julia Hirschberg, Diane Litman, and Marc Swerts.
1999. Prosodic cues to recognition errors. In Pro- ceedings of the Automatic Speech Recognition and Understandin9 Workshop (ASRU'99).
Julia Hirschberg. 1991. Using text analysis to pre- dict intonational boundaries. In Proceedings of the Second European Conference on Speech Commu- nication and Technology, Genova. ESCA.
C. Kamm, S. Narayanan, D. Dutton, and R. Rite- nour. 1997. Evaluating spoken dialog systems for telecommunication services. In 5th European Conference on Speech Technology and Communi- cation, EUROSPEECH 97.
Hans Kraayeveld. 1997. Idiosyncrasy in prosody. Speaker and speaker group identification in Dutch using melodic and temporal information. Ph.D. thesis, Nijmegen University.
E. Krahmer, M. Swerts, M. Theune, and M. Weegels. 1999. Error spotting in human- machine interactions. In Proceedings of E UR OSPEECH- 99.
Irene Langkilde, Marilyn Walker, Jerry Wright, A1 Gorin, and Diane Litman. 1999. Automatic prediction of problematic human-computer dia- logues in 'how may i help you?'. In Proceedings of the Automatic Speech Recognition and Under- standin 9 Workshop (ASRU'99).
Gina-Anne Levow. 1998. Characterizing and recog- nizing spoken corrections in human-computer dia- logue. In Proceedings of the 36th Annual Meeting of the Association of Computational Linguistics, COLING/ACL 98, pages 736-742.
Diane J. Litman and Shimei Pan. 1999. Empirically evaluating an adaptable spoken dialogue system. In Proceedings of the 7th International Conference on User Modeling (UM).
Diane J. Litman, Marilyn A. Walker, and Michael J. Kearns. 1999. Automatic detection of poor speech recognition at the dialogue level. In Pro- ceedings of the 37th Annual Meeting of the As- sociation of Computational Linguistics , ACL99, pages 309-316.
M. Ostendorf, B. Byrne, M. Bacchiani, M. Finke, A. Gunawardana, K. Ross, S. Roweis, E. Shriberg, D. Talkin, A. Waibel, B. Wheatley, and T. Zep- penfeld. 1996. Modeling systematic variations in pronunciation via a language-dependent hid- den speaking mode. Report on 1996 C L S P / J H U Workshop on Innovative Techniques for Large Vo- cabulary Continuous Speech Recognition.
S. L. Oviatt, G. Levow, M. MacEarchern, and K. Kuhn. 1996. Modeling hyperarticulate speech during human-computer error resolution. In Pro- ceedings of ICSLP-96, pages 801-804, Philadel- phia.
M. Rahim, R. Pieracini, W. Eckert, E. Levin, G. Di Fabbrizio, G. Riccardi, C. Lin, and C. Kamm. 1999. W99 - a spoken dialogue system for the asru'99 workshop. In Proc. ASRU'99.
R.D. Sharp, E. Bocchieri, C. Castillo, S. Parthasarathy, C. Rath, M. Riley, and J Rowland. 1997. The watson speech recognition engine. In Proc. ICASSP97, pages 4065-4068. Ronnie W. Smith. 1998. An evaluation of strate-
gies for selectively verifying utterance meanings in spoken natural language dialog. International Journal of Human- Computer Studies, 48:627-647. Hagen Soltau and Alex Waibel. 1998. On the in- fluence of hyperarticulated speech on recognition performance. In Proceedings of ICSLP-98, Syd- ney. International Conference on Spoken Lan- guage Processing.
M. Swerts and M. Ostendorf. 1997. Prosodic and lexical indications of discourse structure in human-machine interactions. Speech Communica- tion, 22:25-41.
Marc Swerts and Raymond Veldhuis. 1997. Interac- tions between intonation and glottal-pulse char- acteristics. In A. Botinis, G. Kouroupetroglou, and G. Carayiannis, editors, Intonation: Theory, Models and Applications, pages 297-300, Athens. ESCA.
Nanette Veilleux. 1994. Computational Models of the Prosody/Syntax Mapping for Spoken Language Systems. Ph.D. thesis, Boston University.
E. Wade, E. E. Shriberg, and P. J. Price. 1992. User behaviors affecting speech recognition. In Pro- ceedings of ICSLP-92, volume 2, pages 995-998, Banff.
M. Weintraub, K. Taussig, K. Hunicke-Smith, and A. Snodgrass. 1996. Effect of speaking style on LVCSR performance. In Proceedings of ICSLP- 96, Philadelphia. International Conference on Spoken Language Processing.