Effect of Particle Size Distribution on SiC Ceramic Sinterability
Nur Zalikha Khalil
1,+, Sanjay K. Vajpai
2, Mie Ota
3and Kei Ameyama
3 1Department of Mechanical Engineering, Ritsumeikan University, Kusatsu 525-8577, Japan2Research Organization of Science and Technology, Ritsumeikan University, Kusatsu 525-8577, Japan 3Faculty of Science and Engineering, Department of Mechanical Engineering, Ritsumeikan University,
Kusatsu 525-8577, Japan
Silicon Carbide has drawn a significant attention in recent decades for its excellent properties such as high oxidation resistance, high hardness and low density. However, an important drawback for SiC manufacturing is its poor sinter ability due to its highly covalent nature of bonding. This work investigates the effect of dispersion in Particle Size Distribution on the sinter ability of SiC ceramics. In the present work, two types of SiC powders, consisting powders of sizes 0.3 µm and 2.5 µm, were subjected to mechanical milling in order to produce various patterns of particle size distributions. Subsequently, milled powders were sintered by spark plasma sintering. This sintering technology is used in account of its rapid heating and short time sintering. This work also suggests the usage of coefficient of variation,Cvas an appropriate parameter
to indicate the dispersion level in PSD range investigated. [doi:10.2320/matertrans.Y-M2015823]
(Received July 3, 2015; Accepted August 7, 2015; Published October 9, 2015)
Keywords: silicon carbide, particle size distribution, mechanical milling, spark plasma sintering, sinterability
1. Introduction
Silicon Carbide (SiC) is a typical candidate for high temperature applications owing to its excellent thermal and mechanical properties.15) However, due to its highly
covalent bonded characteristic and the resultant low self-diffusion coefficient,6,7) sintering of SiC has been a
challenging topic for materials’ researcher. Generally, the conventional solid state sintering requires extremely high temperatures up to 2200°C and long sintering time to achieve full densification.7,8) It is well known that high temperature
and longtime sintering may cause the grain growth phe-nomenon that will eventually detract the mechanical proper-ties of thefinal sintered product. With regard to particle size distributions (PSD), earlier researchers have suggested using mono-sized powders of narrow particle size distribution in producing uniform, dense and fine-grained microstruc-ture.912)Later, Patterson and Griffin13)has reported that for coarse spherical copper powder, the increasing of PSD led to an increase in densification while infine tungsten powders, the narrowest and widest distribution made the most rapid densification compared to the intermediate one. Working on commercial alumina powder, Yeah and Sacks14) have
reported that broad distribution is preferable due to a higher starting green density. In recent work on submicron alumina powder, Ma and Lim15)have demonstrated that for practical
use, narrow PSD is preferred to monosized or broad size distribution for better sinterability due to the microstructural homogeneity of the green compact, provided that the powder is agglomerate free to start with. They also added that the optimum PSD for a given powder system would vary depending on the consolidation technique and condition used. Recently, Andreaset al.16)have simulated the effect of PSD on solid state sintering for several patterns of PSD (normal, log-normal and bimodal). They have reported that
polydispersity in PSD resulted in the declination of densification rate with increasing distribution width. This is due to the lower coordination number and higher average contacts area in the initial packing structure. Apparently, the effects of particle size distributions are inconsistent and rather complicated since it depends to a great extent on the sintering mechanism and material used. Thus, present work attempts to establish the effect of dispersion in particle size distribution on sinterability of SiC ceramic. This work also discusses the appropriate dispersion measure for distributions with different variables (e.g.: mean, standard deviation). In this work, SiC powders were subjected to mechanical milling in order to produce various kinds of particle size distributions. Wet milling is adopted due to its effectiveness to increase homogeneous dispersion in powder while milling is conducted.17)Subsequently milled powders were subjected to spark plasma sintering and the sinterability of powder compacts were evaluated by measuring the relative density and flexural strength. The evolution of powders particle morphology during mechanical milling is also discussed.
2. Experimental Procedures
In present work, coarse ¡-SiC powder of 2.5 µm and a relatively fine SiC powder of 0.3 µm commercialized by Kojundo Chemical Labroratory, Co., Ltd. were used. Each powder was subjected to vibratory ball mill (Super Misuni NEV-MA-8 Nishin Gikken, Japan). Dense tungsten carbide-cobalt (WC-Co) of 11 mm in diameter was used as a grinding media. Wet milling was conducted in the presence of ethanol to avoid agglomeration while milling and the ratio of ethanol to powders is 1 : 1 by mass. A constant vibration frequency of 12.5 Hz and a total time of 0 ks³360 ks were used to mill the powders and the ratio of the grinding ball to milled powder was 5 : 1 by mass. After milling, the powders were dried and sieved to eliminate hard agglomerate. Subse-quently, particle size was measured using Laser Diffraction
+Graduate Student, Ritsumeikan University. Corresponding author, E-mail:
[email protected]; [email protected]
Materials Transactions, Vol. 56, No. 11 (2015) pp. 1827 to 1833
Particle Size Analyser (Shidmadzu SALD-2300, Japan) using 10 different powder samples to get the average distribution pattern for each powder. The morphology of milled powders were observed using Field Emission Scanning Electron Microscope (FE-SEM S-4800, Hitachi Japan). The milled powders were inserted in a graphite die with external and internal diameter of 30 mm and 15.5 mm, respectively, with graphite punch having a diameter of 15 mm and 20 mm height. Subsequently, the powders were sintered by Spark Plasma Sintering (SPS) using DR.SINTER 1020 apparatus SPS Syntex Inc., Japan at 1873 K for 0.6 ks under an applied pressure of 50 MPa and carried out in a vacuum. The temperature was measured using an infrared active homing (IR-AH) thermometer. After the powders were soaked in the desired temperature, the pressure was released and the specimen is cooled down to room temperature. Density for the sintered compacts was measured by dividing the weight of the compacts by its dimension. The sintered samples were carefully polished and microstructure characterization was conducted by means of SEM. The mechanical properties of the sintered SiC compacts were evaluated by 4-point bend test. The dimension of the bend test specimen was 13 mm©4 mm©2 mm specimens, with crosshead of 0.1 mm/min.
3. Results
3.1 Effect of mechanical milling to particle morphology
and PSD
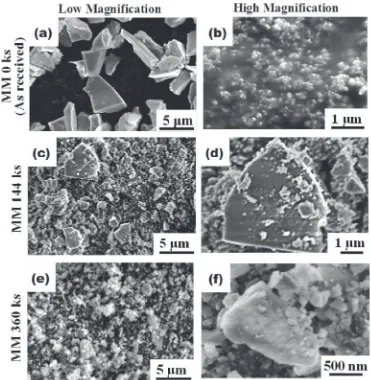
Figure 1 shows the appearance of both as received and milled coarse SiC powders at low and high magnifications. As received coarse powder used in this study has angular morphology (Fig. 1(a)). However, it is also interesting to note that the as received coarse SiC powder consisted of a significant amount of nano-sized particles also, as shown by a high magnification SEM micrograph in Fig. 1(b). Therefore, it appears that the as-received coarse SiC powder had particles of two different size regimes, i.e. coarse micron-sized andfine nano-sized particles. After milling for 144 ks, it can be observed that coarse particles have fragmented to smaller particles as shown in Fig. 1(c). This can be attributed to the intense impact of ball while milling was conducted. It can also be observed that a wide range of particles exist after milling and the shape of the particle is somewhat a mixture of angular and partially rounded. Figure 1(d) shows the remained coarse particle after milling. It is partially rounded in morphology and the existence of many nano-sized particles after milling is also observed. Further milling for 360 ks continues crushing SiC particles as shown in Fig. 1(e).
Fig. 1 SEM micrographs of coarse SiC powders in low and high magnifications (a) and (b) are as received powders, (c) and (d) are MM 144 ks powders, (e) and (f ) are MM 360 ks powders.
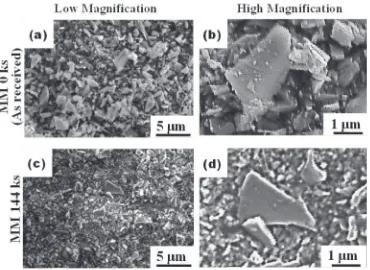
[image:2.595.112.483.68.448.2]As a result, most of the SiC particles have fragmented to nanosized particles. The final shape of the particles is somewhat rounded, as shown in Fig. 1(f ). Similarly, Fig. 2 shows the appearance of both as received and milledfine SiC powders at low and high magnifications. As received fine powders has an angular morphology, as shown in Fig. 2(a). It would be worth mention that this powder initially consists of many nano-size particles as shown in Fig. 2(b). After milling for 144 ks, it can be observed that the fragmentation occurs to the most of the particles, as shown in Fig. 2(c). However, there is no significant morphological change as the particle remained angular, as shown in Fig. 2(d). It is worth mentioning that from these morphological observations, milled powders do not show any obvious agglomeration. This might be attributed to the adoption of wet milling using ethanol while preparing these powders. Generally, very
fine-sized particles, especially nano-sized particles, tend to agglomerate due to higher interparticle attractive forces, which resist dispersion. This is undesirable because it leads to poor flow of powder during compaction, resulting in decreased packing density. However, the usage of ethanol as process control agent (PCA) acts as a dispersant to induce particle-particle repulsion, which in turn hinders the agglom-eration amongst the particles. As a result, no significant agglomeration was observed in the present case.
Table 1 shows the mean particle size for both coarse and
fine powder. It is observed that, for coarse powders, mechanical milling leads to a significant reduction in mean particle size with increasing milling time, and a stable mean particle size is attained after approximately 144 ks of milling time, as no significant reduction in the mean particle size was observed after subsequent milling up to 360 ks. However, it is interesting to note that the mean particle size remains
unchanged despite of a significant particle fragmentation observed in SEM micrographs corresponding to the powders milled for 144 ks and 360 ks (Figs. 1(c)1(f )). This observa-tion could be attributed to the presence of a significantly larger number fraction of finer particles than the coarser particles in MM 144 ks powder, leading to no significant effect of coarser particle size on the mean particle of the aggregate powder mass. It must be emphasized at this juncture that the variation in overall size distribution is expected to have more pronounced effect on the densification rather than a slight variation in mean particle size of the powder mass aggregate. Similarly, mechanical milling resulted in no significant change in the mean particle size in case offine-sized powders also. This might be due to the limit of particle fragmentation under present milling conditions.
Figure 3 shows the PSD for both as received and milled SiC coarse powders. For as received coarse powder, it apparently demonstrates a bimodal distribution with two distinct peaks, namely coarse and fine peaks, as shown in Fig. 3(a). It can be observed that, as the milling time increased to 144 ks, the frequency of the coarse particles decreased significantly and the peak corresponding to coarser
[image:3.595.115.485.68.338.2]Fig. 2 SEM micrographs offine SiC powders in low and high magnifications (a) and (b) are as received powders, (c) and (d) are MM 144 ks powders.
Table 1 Mean particle size.
Milling time (ks) Mean particle Size (µm)
Coarse Fine
0 (As received) 2.5 0.3
144 0.6 0.4
360 0.6
[image:3.595.306.548.404.473.2]particles shifted toward the relatively smaller particle size, as shown in Fig. 3(b). These results suggest that the milling led to the fragmentation of only the particle with size larger than 1 µm. It is also noted that the PSD is broadened while retaining a somewhat bimodal distribution. Subsequent milling up to 360 ks demonstrated a complete disappearance of peak corresponding to coarser particles, as shown in Fig. 3(c), indicating that the particles with size greater than 1.0 µm are further fragmented at this stage. Moreover, the PSD demonstrates a broadened unimodal distribution. It is also worth mention that thefinal PSD demonstrates a skewed right distribution. In general, skewed distribution is a statistical term to describe a distribution in which one of its tails is stretched out longer than the other, and the skewness direction will take the side of the longer tail.18)
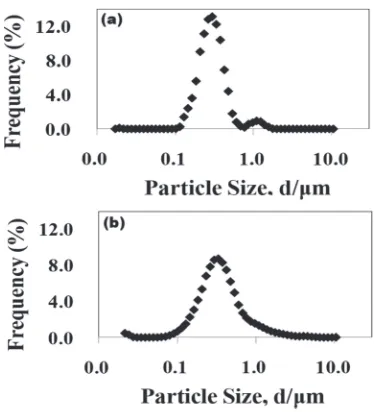
Figure 4 shows the PSD forfine SiC powders. Initialfine powder had a narrow bimodal distribution, as shown in Fig. 4(a). After milling was carried out for 144 ks, the distribution became a complete unimodal distribution, as shown in Fig. 4(b). It is also observed that the PSD is somewhat broadened. These observations suggest that the fragmentation under present milling conditions only occur to the particle with size larger than 1 µm. The final PSD also demonstrate a skewed right distribution. Therefore, the effect of mechanical milling to particle morphology and PSD can be concluded as follows; (1) for coarse powders, milling leads to significant reduction of particle mean size and the reduction of particle aspect ratio, (2) forfine powders, milling does not reduce the mean particle size and particle aspect
ratio significantly, (3) mechanical milling leads to the fragmentation of particles with size greater than 1 µm, resulting in a broadened unimodal size distribution for both coarse andfine powders.
3.2 Relative density and mechanical properties
Table 2 shows the relative density andflexural strength of the powder compacts with its standard deviation. The average density of sintered compacts was evaluated by the quotient of the weight of compact and its dimensions. The flexural strength was obtained by 4-point bend test using three bars for each powder condition. It can be observed that, for coarse powder compacts, the relative density andflexural strength is increasing as milling time increases. This may be attributed to the increase in specific surface area in mechanically milled powders which stores more surface energy and sinters quickly. Moreover, powders obtained from high-energy ball-milling consist of various particle sizes, leading to easier
filling of pores and providing shorter diffusion distances for atoms, which is necessary for achieving higher densifi ca-tion;19,20)On the other hand, forfine powder compacts, it is observed that the relative density andflexural strength has not significantly changed as milling time increases. This might be due to the limit of fragmentation for SiC particle under present milling condition, which results in no significant change in surface energy and densification rate as explained beforehand.
Fig. 3 Particle size distributions of coarse SiC powders; (a) As received, (b) MM 144 ks, (c) MM 360 ks.
[image:4.595.75.262.65.377.2]Fig. 4 Particle size distributions of fine SiC powders; (a) As received, (b) MM 144 ks.
Table 2 Relative density and mechanical properties of SiC compact.
Milling Time (ks)
Relative Density (%)
Flexural Strength (MPa)
Coarse
0 (As received) 58.1«5.2 105«6.3
144 75.3«4.3 187«26.9
360 81.8«6.5 219«43.1
Fine 0 (As received) 68.6«3.3 171«28.3
144 67.6«2.5 163«21.1
[image:4.595.333.520.67.273.2] [image:4.595.304.549.332.424.2]4. Discussions
4.1 Dispersion measures in PSD
4.1.1 Variance and standard deviation
In order to define dispersion level in PSD, typical dispersion measures for frequency distribution which are sample standard deviation, s and sample variance, s2 are calculated using eqs. (1) and (2), respectively;18)
Sample standard deviation;
s¼pffiffiffiffiffiffiffiffiffiffiffiffiffiffiffiffiffiffiffiffiffiffiffiffiffiffiffiffiffiffiffiffiffiffiffiffiffiffiffiffiffiffiffiffiffiffiffiffiffiffiffiffiffiffiffiffiffiffiffiffix2f ððxfÞ2=fÞ=f1 ð1Þ Sample variance;
s2 ¼x2f ððxfÞ2=fÞ=f1 ð2Þ
In these equations,xrefers to the particle size andfindicates the frequency of particle on the specificxvalue.
4.1.2 Coefficient of variation,Cv
As mentioned at 4.1.1, variance and standard deviation are the most commonly used dispersion measures in statistic. When compared to the variance, the standard deviation has an important advantage: it is expressed in the same units as the variable under study, while the variance is measured in the square units of the respective variable making the standard deviation is easier to interpret. However, when the main purpose is to compare the dispersion of distributions of several variables, standard deviation is not the most appropriate indicator unless all the variables are expressed in the same measurement units and have identical mean values. When these two requirements do not hold, the coefficient of variation,Cvwhich measure relative dispersion expressed as
the standard deviations a proportion of the arithmetic mean is frequently used. The equation is shown in eq. (3);
Coefficient of variation; Cv¼s=X ð3Þ
where s and X represent sample standard deviation and sample mean respectively. X value is calculated using the following equation;
Sample mean; X¼xf=n ð4Þ
wheren=f.
The variable with largest value for theCv is the one with
the highest relative dispersion around mean. It is important to note that the ratio only applies when the expected values is not zero or negative. Moreover, it is worth mentioning thatCv
is a normalized statistical measure which make it dimension-less and useful for comparing relative variability of strictly positive random variable distributions.21,22)Therefore, in this
work, Cv is introduced as an alternative dispersion measure
for PSD, considering the mean size of PSD range investigated is not identical.
4.2 Correlation between PSD parameters and
sinter-ability
Figure 5 shows the relation of relative density when plotted using three main dispersion parameters which are standard deviation s, variances2 and coefficient of variation
Cv. Similarly, Fig. 6 shows the relation of flexural strength
when plotted with those dispersion parameters. It is worth to mention that relative density andflexural strength are used as an indicator to determine the accuracy of the dispersion
parameters. It is well known that the flexural strength is dependent on the relative density. Higher relative density provides stronger interparticle bonding, which hinders crack propagation and leads to higherflexural strength. From these result, it is observed that when the experimental results are plotted using powder standard deviation,s, and variance,s2,
no clear and reliable correlation between these parameters
50 60 70 80 90 100
0.0 0.5 1.0 1.5 2.0 2.5
Relative density
(%
)
Standard Deviation, s
50 60 70 80 90 100
0.0 1.0 2.0 3.0 4.0 5.0 6.0
Relative density
(%
)
Variance, s2
50 60 70 80 90 100
0.0 0.5 1.0 1.5 2.0 2.5
Relative density
(%
)
Coefficient of Variation, Cv
(a)
(c) (b)
As received Coarse Coarse MM 360 ks Fine MM 144 ks
Coarse MM 144 ks As received Fine
Fig. 5 Relative density plotted with dispersion measures; (a) standard deviation, (b) variance, (c) coefficient of variation.
0 100 200 300
0.0 1.0 2.0 3.0 4.0 5.0 6.0
Fl ex ural Str ength, (MP a)
Variance, s2
0 100 200 300
0.0 0.5 1.0 1.5 2.0 2.5
F lex ural Str ength, (MP a)
Coefficient of Variation, Cv
(c) (b) 0 100 200 300
0.0 0.5 1.0 1.5 2.0 2.5
F lex ural Str ength, (MP a)
Standard Deviation, s
(a)
As received Coarse Coarse MM 360 ks Fine MM 144 ks
Coarse MM 144 ks As received Fine
Fig. 6 Flexural Strength plotted with dispersion measures; (a) standard deviation, (b) variance, (c) coefficient of variation.
[image:5.595.328.519.70.347.2] [image:5.595.333.519.390.657.2]and experimental results is observed. As already suggested in 4.1.2, standard deviation and variance are not the appropriate parameter for indicating dispersion when comparing distri-bution with different mean size. It is a normal practice to set the mean particle size constant when comparing dispersion level in several powders so that the dispersion measure value will be reliable. On the other hand, the experimental results show a positive linear relation when plotted using coefficient of variation,Cv. As proposed in 4.1.2, at this point, higherCv
value (i.e.: higher relative dispersion) is expected to lead to a higher relative density andflexural strength, attributed to the improvement in packing density due to the gapfilling ability of finer particles. This leads to improvement in particle rearrangement and enhance particle average coordination number, which favors subsequent sintering. As mentioned in the introduction of the present paper, several significant efforts have been made by various researchers to determine the effect of dispersion in PSD to the sinterability.915)
However, in these research works, the mean particle size had to be made constant before comparing the dispersion of powders. Obviously, it is not always practically feasible, especially for commercial powders. In this respect, Cv, as
normalized dispersion measure has demonstrated a conven-ient solution to this problem by providing a more reliable measure when comparing the dispersion level in powders having different mean particle sizes. Therefore, these results justify the usage ofCvas the appropriate dispersion measure,
in the PSD range investigated, as it is comparatively accurate in describing the relation between dispersion in initial powder and sintering behavior.
4.3 Relationship between dispersion in PSD with
sinter-ability
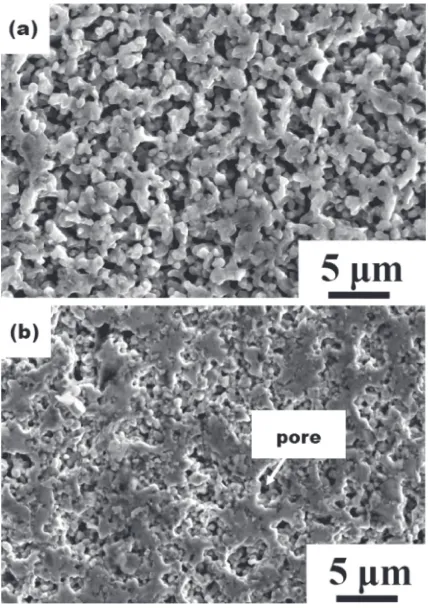
Figure 7 shows the microstructure of as receivedfine and milled 360 ks coarse powder compact. TheCvvalue for those
initial powders are 0.59 and 2.06, respectively. It is observed that for as receivedfine powder compact, the sintered region is very minimum, as shown in Fig. 7(a). Moreover, the existence of many pores can also be noted, which suggest the poor sinterability in this compact. On the other hand, for milled 360 ks coarse compact, an improvement in sinter-ability is observed when the sintered region is significantly increased, as shown in Fig. 7(b). These results indicate that under a constant sintering temperature, higher Cv value of
initial powder results in improved sinterability. In general, sinterability of a powder compact is determined by several factors, namely mean particle size, size distribution, and packing structure. Considering the mean particle size, particles with smaller mean size sinter quickly as compared to the relatively coarser particles. The better sintering characteristic of the relatively smaller particles can be attributed to the larger specific surface area of the smaller particles which leads to increased surface energy and favors subsequent sintering. However, it is inadequate to consider this factor individually because the dispersion of the PSD also plays important role in determining the initial packing structures as explained beforehand. It is often difficult to predict the sinterability of powders accurately when consid-ering several powders having different mean particle sizes and dispersion. Thus, by applying theCvvalue, which takes
both mean particle size and dispersion into account, the sinterability of the respective powder can be predicted more accurately and holistically.
5. Conclusion
This work has investigated the effect of dispersion in Particle Size Distribution (PSD) to sintering ability of SiC ceramics under constant sintering temperature. Mechanical milling was adopted to create various patterns of PSD. Mechanical milling has resulted in the reduction of particles aspect ratio for coarser particle and no significance change in
finer particles. The usage of Coefficient of variation,Cv, has
demonstrated a reliable correlation for SiC sinter ability and thus was suggested as the most appropriate dispersion measure for PSD which do not hold identical mean values. In the range PSD investigated, the result showed that the sinterability of SiC ceramic improved with the increase ofCv
value under constant sintering conditions.
Acknowledgments
This research was supported by the Japan Science and Technology Agency (JST) under a Collaborative Research Based on Industrial Demand “Heterogeneous Structure Control: Towards Innovative Development of Metallic Structural Materials”, and by the Grant-in-Aid for Scientific Research on Innovative Area, Bulk Nanostructured Metals through MEXT, Japan (contract No. 22102004). These supports are gratefully acknowledged.
Fig. 7 Microstructure of sintered compacts; (a) As receivedfine powders compact,Cv=0.59, (b) coarse MM 360 ks powders compact,Cv=2.06.
[image:6.595.320.534.69.373.2]REFERENCES
1) F. M. Varela-Feria, J. Martinez-Fernandez, A. R. de Arellano-Lopez and M. Singh:J. Eur. Ceram. Soc.22(2002) 27192725.
2) J. Sánchez-González, A. L. Ortiz, F. Guiberteau and C. Pascual:J. Eur. Ceram. Soc.27(2007) 39353939.
3) Q.-W. Huang and L. H. Zhu:Mater. Lett.59(2005) 17321735. 4) A. Maître, A. Vande Put, J. P. Laval, S. Valette and G. Trolliard:J. Eur.
Ceram. Soc.28(2008) 18811890.
5) M. Singh and J. A. Salem:J. Eur. Ceram. Soc.22(2002) 27092717. 6) S. H. Lee:J. Ceram. Soc. Jpn.119(2011) 640644.
7) A. Lara, A. L. Ortiz, A. Muñoz and A. Domínguez-Rodríguez:Ceram. Int.38(2012) 4553.
8) A. Can, M. Hermann, D. S. McLachlan, I. Sigalas and J. Adler:J. Eur. Ceram. Soc.26(2006) 17071713.
9) M. F. Yan:Mater. Sci. Eng.48(1981) 5372.
10) E. A. Barringer and H. K. Bowen: J. Am. Ceram. Soc. 65(1982) C-199C-201.
11) M. D. Sacks and T. Y. Tseng:J. Am. Ceram. Soc.67(1984) 532537. 12) D. J. Sordelet and M. Akinc:J. Am. Ceram. Soc.71(1988) 11481153. 13) B. R. Patterson, V. D. Parkhe and J. A. Griffin: Mod. Des. Pow. Metall.
15(1984) 279288.
14) T. S. Yeh and M. D. Sacks:J. Am. Ceram. Soc.71(1988) C484C487. 15) J. Ma and L. C. Lim:J. Eur. Ceram. Soc.22(2002) 21972208. 16) A. Wonisch, T. Kraft, M. Moseler and H. Riedel:J. Am. Ceram. Soc.
92(2009) 14281434.
17) M. Hussain, Y. Oku, A. Nakahira and K. Niihara: Mater. Lett. 26 (1996) 177184.
18) R. Johnson and P. Kuby:Elementary Statistics, (Thomson Brooks/ Cole., California, 2007) pp. 118119.
19) Y. Han, J. Fan, T. Liu, H. Cheng and J. Tian:Int. J. Ref. Met. H. Mater. 29(2011) 743750.
20) I. J. Shon and S. M. Kwak: J. Ceram. Proc. Res.14(2013) 694699. 21) J. Sappakitkamjorn and S. Niwitpong: Int. J. Math. Comput. Nat. Phys.
Eng.7(2013) 885890.
22) J. D. Curto and J. C. Pinto:J. Appl. Stat.36(2009) 2132.