and Cluster (2). It is found that both of Cluster (1) and Cluster (2) formation are enhanced with the higher Mg+Si and the Mg/Si ratio close to 1.0. Especially, it is suggested that the formation sequence of Cluster (1) during natural aging is classified into three regions from the results of hardness and electrical resistivity measurement. These results mean that the composition of Cluster (1) is initially Si-rich then gradually becomes enriched in Mg by the incorporation of Mg. The growth rate of Cluster (1) is not high, whereas of Cluster (2) is higher and the composition becomes Mg/Si’1.0. [doi:10.2320/matertrans.MBW201208]
(Received October 16, 2012; Accepted November 14, 2012; Published December 21, 2012)
Keywords: aluminummagnesiumsilicon alloy, age hardening, nanoclusters, formation behavior, magnesium/silicon ratio
1. Introduction
Age-hardenable AlMgSi alloys have attractive proper-ties such as good formability and high corrosion resistance. With these advantages, AlMgSi alloys (6xxx series) have been widely used for body panels of automobiles and many applications. The AlMgSi alloys are well known to be hardened during a paint baking process at around 170°C for 1.2 ks in the automobile manufacturing process, resulting in improving mechanical strength. The strengthening of Al MgSi alloys is based on a precipitation hardening through the sequence as follows:
¡ðSSSSÞ !Nanoclusters!GP zones!¢00!¢0!¢
ð1Þ where SSSS is the super saturated solid solution.1)Practically, the alloy sheets are solution treated alloys at aluminum factories and normally transported to automobile companies. During transportation and storage, the alloy sheets are exposed at room temperature before the paint baking process. This is the natural aging and results in positive or negative effect on the bake-hardening (BH) response.2,3) The compli-cated changes of the nano or micro scale structures in the matrix such as nanoclusters or GP zones during natural aging affect the BH response.4) Recently, Serizawa et al.5,6) introduced the characteristics of two types of nanoclusters, i.e., Cluster (1) and Cluster (2), which play strongly important roles in the age-hardening using a three dimen-sional atom probe (3DAP) equipment. Cluster (1) and Cluster (2) are preferentially formed at around room temper-ature and 100°C. In addition, Yamadaet al.7)and Kimet al.8) explained that the formation of Cluster (1) causes the negative effect of two-step aging, while the formation of
Cluster (2) prior to the formation of Cluster (1) suppresses the negative effect. The control of nanoclusters by the microalloying elements as well as the heat-treatment histories becomes extremely important in terms of the nanocluster formation at the early stage of the phase decomposition.8,9) Furthermore, Otsuka et al.10) reported the effect of alloy composition on the formation of nanoclusters and precipitates. They concluded that the formation of nano-clusters markedly depends on the Mg, Si concentration and the Mg/Si ratio.
However, the detailed clustering behavior during low temperature aging is still complicated and unclear with the heat treatment and alloy composition. The aim of this study is, therefore, to investigate the formation behavior of nanoclusters with alloys consisted of several different Mg and Si concentration and to find the optimum Mg/Si ratio.
2. Experimental Procedure
Several alloys with different Mg and Si concentration were used in this study in order to investigate the formation behavior of nanoclusters with different alloy composition. Most of the alloys were prepared with the concentration close to those of commercial alloys as shown in Fig. 1. The chemical compositions are summarized in Table 1. The specimens were solution treated at 560°C for 1.8 ks, subsequently quenched into ice-water and kept for 60 s. These specimens are called as as-quenced (A.Q.) alloys in this paper. Differential scanning calorimetry (DSC) which is a useful technique to detect very small nanoclusters was carried out using a Rigaku equipment of DSC8230 with 30 mg of pure Al (99.99%) as a reference under an argon atmosphere with heating rate of 10°C/min. The range of temperature for the DSC measurement was set from¹50 to 500°C using a liquid nitrogen controller.
The natural aging was performed at room temperature up to 2419.2 ks (1 month) in order to investigate the precise formation behavior of Cluster (1). Micro-Vickers hardness +1Graduate Student, Tokyo Institute of Technology
+2Graduate Student, Tokyo Institute of Technology. Present address:
measurements were carried out using Mitsutoyo HM-102 with the specimens prepared within 0.3 ks after each natural aging time. Electrical resistivity measurements were also performed by a four-probe method at ¹196°C with the specimens prepared as wires with the diameter of 1.0 mm and the gage length of 300 mm in order to understand the size and number density changes with the natural aging time.
3. Results
3.1 Differential scanning calorimetry (DSC)
Figure 2 shows the DSC results of the as-quenched (A.Q.) specimens with the different Si concentration. The DSC curves show four exothermic peaks and one endothermic peak indicated by Peak I, II, III, IV and V. The reactions corresponding to peak I and II are attributed to the formation of nanoclusters and the dissolution of the preformed nano-clusters, respectively. Peak III, IV and V are described to the formation of ¢AA, ¢A metastable precipitates and the equi-librium precipitates ¢-(Mg2Si). These results are in good agreement with those of Miaoet al.11)and Gaberet al.12)It is found that the peak area and peak temperature are changed depending on the Si concentration. In this paper, peak I corresponding to the formation of nanoclusters is mainly focused and discussed because nanoclusters play important roles in AlMgSi alloys. Figures 3(a) and 3(b) show the DSC results of nanoclusters in the as-quenched alloys with
different (a) Si and (b) Mg concentration obtained by a heating rate of 10°C/min. Two overlapped peaks correspond-ing to the Cluster (1) and Cluster (2) appeared in a temper-ature range from 0 to 150°C as indicated by arrows in Figs. 3(a) and 3(b). Obviously, the formation of nanoclusters occurs in all prepared specimens at two temperatures,firstly, lower temperature and secondly higher temperature. These peaks were successfully separated using the Gaussian function method and utilized to analyze the nanocluster formation quantitatively.13)Figures 4(a) and 4(b) describe the peak separation of nanoclusters using the Gaussian function method. One of used alloys, 9M10S was used for giving an proper example. Multiple peaks as shown in Fig. 4(a) were simply fitted by selecting number of peaks and center of peaks based on the following equation:
y¼y0þwpAffiffiffiffiffiffiffiffi³=2e2
ðxxcÞ2
w2 ð2Þ
wherey0,xcandwrepresent bottom, center and width of the peak. Multiple peaks were clearly separated in Cluster (1) and Cluster (2) as shown by two curves shown in Fig. 4(b). The formation behavior of nanoclusters is analyzed using peak area and peak temperature of the separated Cluster (1) and Cluster (2) peaks.
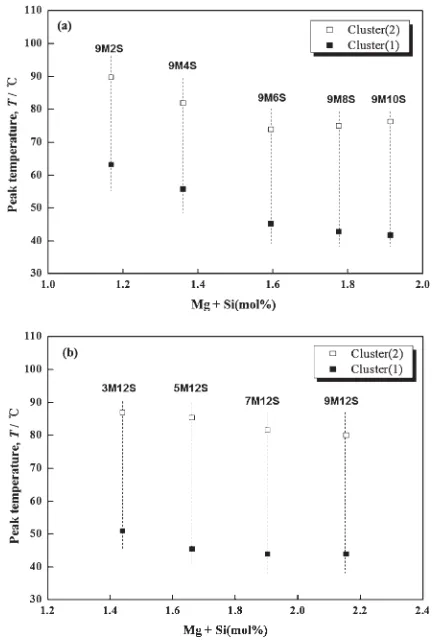
[image:2.595.63.284.63.225.2] [image:2.595.91.529.65.224.2]3.1.1 Peak temperatures for Cluster (1) and Cluster (2) Figure 5 shows peak temperatures for Cluster (1) and Cluster (2) obtained from the DSC results represented with
Table 1 Chemical compositions of the alloys with different Mg and Si concentration (mol%).
Alloys Elements (mol%) Mg/Si Mg+Si Excess Si Excess Mg
Mg Si Fe Al
9M2S 0.976 0.192 0.048 Bal. 5.084 1.168 ® 0.592
9M4S 0.976 0.384 0.053 Bal. 2.542 1.360 ® 0.208
9M6S 1.009 0.586 0.053 Bal. 1.724 1.595 0.081 ®
9M8S 0.998 0.778 0.053 Bal. 1.284 1.776 0.278 ®
9M10S 1.010 0.903 0.058 Bal. 1.119 1.912 0.398 ®
9M12S 1.032 1.123 0.063 Bal. 0.918 2.155 0.607 ®
7M12S 0.799 1.104 0.058 Bal. 0.723 1.903 0.705 ®
5M12S 0.566 1.095 0.058 Bal. 0.517 1.661 0.812 ®
[image:2.595.312.535.69.224.2] [image:2.595.45.550.293.435.2]Mg+Si (mol%). It can be assumed that the peak temper-ature is that at which the formation of nanoclusters is most accelerated. Then, the peak temperature shifts to lower or
higher temperature depending on the formation rate of nanoclusters. As shown in Figs. 5(a) and 5(b), the peak temperatures of both Cluster (1) and Cluster (2) tend to shift to lower temperature with increasing Si and Mg concen-tration, resulting in the accelerated formation rate.
Furthermore, Figs. 6(a) and 6(b) show the peak temper-atures of Cluster (1) and Cluster (2) with the Mg+Si and Mg/Si ratio. It is found that the formation rates of Cluster (1)
Fig. 3 DSC results showing the formation of nanoclusters, Cluster (1) and Cluster (2), in the as-quenched alloys with different Si and Mg concentration. (a) Effect of Si concentration and (b) effect of Mg concentration.
Fig. 4 Peak separation of the DSC curves corresponding to nanoclusters, Cluster (1) and Cluster (2), by the Gaussian function method. (a) Nanocluster peaks corresponding to Cluster (1) and Cluster (2) and (b) obtained results for Cluster (1) and Cluster (2) by the Gaussian function method.
[image:3.595.134.462.67.263.2] [image:3.595.318.534.310.630.2] [image:3.595.48.290.310.673.2]and Cluster (2) are more accelerated with the increased Mg+Si concentration as shown in Fig. 6(a). It is noted that the formation rate of Cluster (1) is highest when the Mg/Si ratio’1.0, whereas Mg/Si ratio’1.01.5 in the case of Cluster (2) as shown in Fig. 6(b).
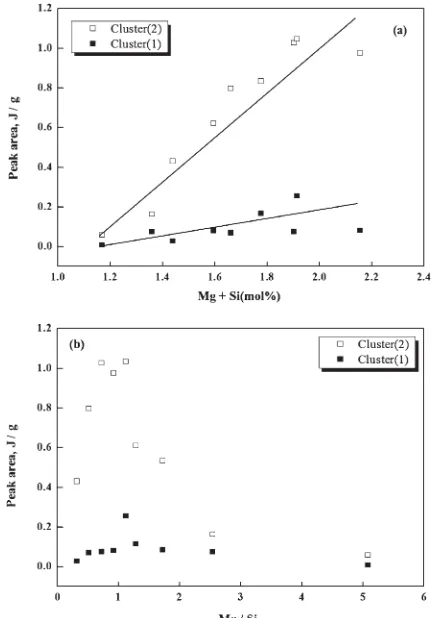
[image:4.595.61.278.65.387.2]3.1.2 Peak areas for Cluster (1) and Cluster (2) Figure 7 shows peak areas for Cluster (1) and Cluster (2) obtained from the DSC results with Mg+Si (mol%). It can be also assumed that the peak area directly corresponds to the formed volume fraction of nanoclusters and is used to analyze quantitatively. That is, the more peak areas of Cluster (1) and Cluster (2) are increased, the more volume fraction of them is also increased. As shown in Figs. 7(a) and 7(b), peak areas of both Cluster (1) and Cluster (2) show the tendency to increase with increasing Si and Mg concentration, resulting in the increased volume fraction. In addition, Figs. 8(a) and 8(b) show the peak areas of Cluster (1) and Cluster (2) with the Mg+Si and Mg/Si ratio. It is considered that the volume fractions of Cluster (1) and Cluster (2) are increased with more Mg+Si concen-tration and in the specimens with about 1.0 of Mg/Si ratio. Furthermore, Figs. 9(a) and 9(b) show peak areas obtained from the DSC curves as functions of Mg+Si (mol%) and Mg/Si for Cluster (1) and Cluster (2). The size and centers of each circle is proportional to the peak area and alloy concentration of used specimens in this experiment. These results represent that the formation amounts both of Cluster (1) and Cluster (2) are increased with Mg/Si ratio close to 1.0 and increasing Mg+Si concentration. There is
Fig. 7 Peak areas of Cluster (1) and Cluster (2) obtained by the DSC results with Mg+Si (mol%). (a) Effect of Si concentration and (b) effect of Mg concentration.
Fig. 8 Peak areas of Cluster (1) and Cluster (2) as a function of (a) Mg+Si (mol%) and (b) Mg/Si.
[image:4.595.318.535.67.386.2] [image:4.595.318.534.448.757.2]the case that even if Mg+Si concentration is increased, the formation amount of Cluster (1) is affected by the ratio of Mg/Si. In other words, the Mg/Si ratio is important role in order to form the Cluster (1) and Cluster (2). In this paper, Cluster (1) which formed during natural aging is mainly handled in order to investigate the complicated formation behavior of Cluster (1).
3.2 Hardness and electrical resistivity
The results of micro-Vickers hardness changes during natural aging in the alloys with different Si concentration are
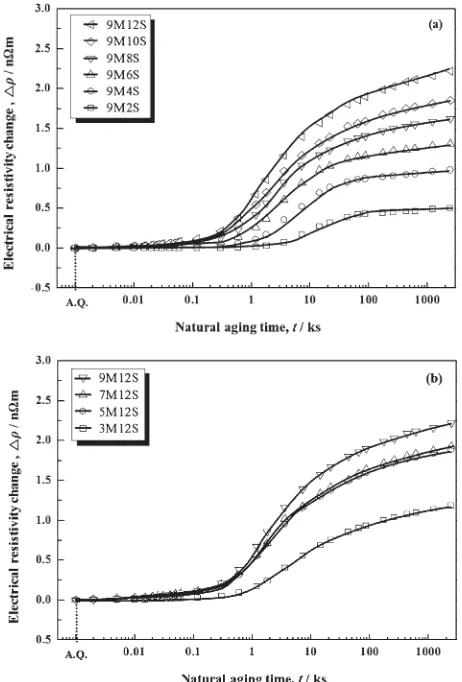
[image:5.595.312.543.70.411.2]shown in Fig. 10. The hardness changes are correlated with the formation of Cluster (1). The hardness is clearly increas-ed during natural aging due to the formation of Cluster (1). The nanoclusters of Cluster (1) are found to interact strongly with dislocations as is reported by Serizawaet al.14)based on the evaluated dimensionless activation energy,g0. The details of the dislocation-nanocluster interaction are discussed for the different nanocluster size in the paper by Serizawa et al.14)It is clear that the hardness increase is much faster in the alloys with higher Si concentration as shown in Fig. 10. These results are well confirmed by the electrical resistivity changes during natural aging in the alloys with the different Si and Mg concentration as shown in Figs. 11(a) and 11(b). The electrical resistivity is strongly affected by the amount of solute atoms in the Al matrix and the nanocluster formation behavior.15) The electrical resistivity change is much in-creased due to the formation of Cluster (1) in the alloys with higher Si and Mg concentration. The increase of electrical resistivity is much accelerated after the initial slow change, indicating that the formation of Cluster (1) is enhanced by the rapid diffusion of solute atoms with quenched - in excess vacancies. It is considered that Si-rich clusters are initially formed and gradually enriched in Mg during natural aging, basically controlled by the interaction energy between elements and vacancies.16) The hardness and electrical resistivity changes shown in Figs. 10 and 11 are associated with the formation of Si-rich clusters and MgSi co-clusters.
Fig. 10 Micro-Vickers hardness changes during natural aging for various alloys with different Si concentration.
Fig. 9 Plots of peak areas of DSC curves as functions of Mg+Si (mol%) and Mg/Si for (a) Cluster (1) and (b) Cluster (2). The size of each circle
[image:5.595.59.278.70.386.2] [image:5.595.53.286.444.611.2]Figure 12 shows changes of electrical resistivity change at 1209 ks and time to reach electrical resistivity of 0.25 n³m as a function of Mg/Si for various alloys aged at room temperature. It is found that the number density of Cluster (1) is high when the ratio of Mg/Si ’1.0. The formation rate is also accelerated at around 1 of the ratio of Mg/Si. These results are in good agreement with for the DSC as we mentioned previously.
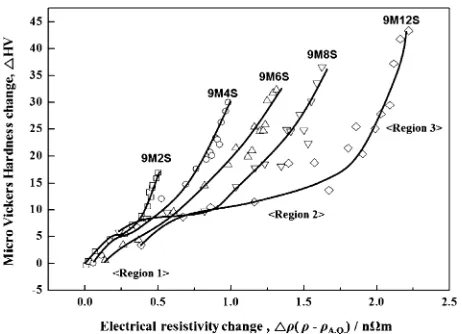
Figure 13 shows relationships between micro-Vickers hardness and electrical resistivity changes due to the Cluster (1) formation for naturally aged various alloys with different Si concentration. The changes shown in Fig. 12 are classified into three regions, Region 1, Region 2 and Region 3 as indicated in Fig. 13. Region 1 represents a liner change of the slope and corresponds to the stage of the aggregation of Mg and Si atoms. As the natural aging time proceeds, the hardness change is much smaller than the electrical resistivity change. It is found by 3DAP that the average size of Cluster (1) is not dramatically changed,5,6) whereas the number density is increased in Region 2. Finally, in Region 3, the hardness change is much larger than the electrical resistivity change. This suggests that the average size of Cluster (1) is slightly changed, whereas the number
behavior of nanoclusters is well coincident with the hardness and electrical resistivity changes. Therefore, it is concluded that the hardness and electrical resistivity changes are due to the formation of Cluster (1) and Cluster (2).
The shift of the peak temperature to a lower temperature and the increase of the peak area depending on the Mg and Si concentration indicate that the formation of Cluster (1) and Cluster (2) is more enhanced in the alloys with the higher Mg+Si. However, it is also clarified that the Mg/Si ratio is important to affect the formation behavior of nanoclusters. In the present work it is found that the formation of Cluster (1) and Cluster (2) is most enhanced when the Mg/Si ratio is approximately 1.0. The Mg/Si ratio of the equilibrium ¢-Mg2Si is 2.0, however, the most favorable Mg/Si ratio for pre-formed nanoclusters is almost 1.0. These mean that the ¢ which is the equilibrium phase and nanoclusters are easily formed in the different composition of Mg and Si each other. This is probably due to the effect of interactions among solute atoms and vacancies, and kinetics. The attractive interaction of MgSi is strong, therefore the co-clusters of MgSi are easily formed in the initial stage, resulting in the formation of nanoclusters and GP zones with the composition of the Mg/Si’1.0. Serizawa et al.6) found using the 3DAP technique that Cluster (2) has the composition of Mg/ Si ’1.5. This must be the reason why the formation of nanoclusters is most enhanced in the alloy with the Mg/ Si ’1.0.
On the other hand, Si-rich clusters containing vacancies will be initially formed during natural aging because of the strong interaction of SiSi and Si-vacancy.
[image:6.595.62.278.69.214.2]Based on the above discussion the formation sequence of nanoclusters in AlMgSi alloys is proposed as follows. Cluster (1) is formed at around room temperature and Cluster (2) is formed at around 100°C. The composition of Cluster (1) is initially Si-rich then gradually becomes enriched in Mg by the incorporation of Mg. The growth rate of Cluster (1), however, is not high. On the contrary, the growth rate of Cluster (2) is higher and the composi-tion becomes Mg/Si’1.0. Again, this will be a good explanation for the most favorable alloy composition. Further research will be discussed about clustering be-havior with the others concentration of Mg and Si and/or Mg/Si.
[image:6.595.54.285.271.438.2](2) The dependence of the formation of Cluster (1) and Cluster (2) on the alloy composition is clarified based on the peak temperature and peak area. The higher Mg+Si fundamentally enhances both of Cluster (1) and Cluster (2) formation. It is also clarified that the Mg/Si ratio from 1.0 to 1.5 most enhances the formation of Cluster (1) and Cluster (2). This is well understood based on the interactions among solute atoms and vacancies.
(3) The formation sequence of Cluster (1) is classified into three regions, Region 1, 2 and 3 based on the relationships between hardness and electrical resistivity. As for Cluster (1), it is basically understood that nanoclusters of Cluster (1) are Si-rich initially and gradually changes to be enriched with Mg and then growing.
41.
3) C. S. T. Chang, I. Wieler, N. Wanderka and J. Banhart: Ultra-microscopy109(2009) 585.
4) T. Sato:J. JILM56(2006) 592601.
5) A. Serizawa, S. Hirosawa and T. Sato: Mater. Sci. Forum519521 (2006) 245250.
6) A. Serizawa, S. Hirosawa and T. Sato:Metall. Mater. Trans. A 39 (2008) 243251.
7) K. Yamada, T. Sato and A. Kamio:J. JILM51(2001) 215.
8) J. H. Kim and T. Sato:J. Nanosci. Nanotechnol.11(2011) 13191322.
9) J. Kim, E. Kobayashi and T. Sato:Mater. Trans.52(2011) 906913.
10) Y. Otsuka, A. Serizawa and T. Sato: Proc. 115th Conf. Japan Inst. Light Metals, (2008) p. 325.
11) W. F. Miao and D. E. Laughlin:Metall. Mater. Trans. A31(2000) 361.
12) A. Gaber, M. A. Gaffar, M. S. Mostafa and E. F. Abo Zeid:J. Alloy. Compd.429(2007) 167175.
13) J. Banhart, C. S. T. Chang, Z. Liang and N. Wanderka: Adv. Eng. Mater.12(2010) 559571.
14) A. Serizawa, T. Sato and W. J. Poole:Phil. Mag. Lett.90(2010) 279.
15) K. Osamura, Y. Hiraoka and Y. Murakami:Philos. Mag.28(1973) 809.