Local Reinforcement of 6061 Aluminum Alloy Bar
Using High-Frequency Induction Heating Apparatus
Fang-ni Shang
1,+, Eiji Sekiya
2and Yoshihiro Nakayama
31Department of Education, Interdisciplinary Graduate School of Medicine and Engineering, University of Yamanashi, Kofu 400-8511, Japan
2Departments of Research and Design, YS Electrics Co. Ltd., Kofu 400-0043, Japan 3Department of Research, Interdisciplinary Graduate School of Medicine and Engineering, University of Yamanashi, Kofu 400-8511, Japan
A commercial 6061 aluminum alloy bar was partially reinforced using a high-frequency induction heating apparatus. One end of the bar was locally heated for solution treatment (local solution treatment). The power supplied to a heating coil was adjusted based on the surface temperature of the bar, which was measured using a radiation thermometer. The temperature profiles and hardness distributions in the longitudinal direction were investigated after the local solution treatment. The results of this study are as follows. The local solution treatment achieved a rapid heating rate of 80 K/s, overheating of about 2 K at the temperature transition stage from the heating to holding process, and a small-scale temperaturefluctuation (below«8 K) in the holding process. The reproducibility of the temperature profile during the local solution treatment was also sufficient. An increase in the hardness was achieved from solution treatment at 723 K or more. A holding time of 5 min or more was not very important for increasing in the hardness. The partial reinforcement of a 6016 aluminum alloy bar can be realized by applying an induction heating apparatus. [doi:10.2320/matertrans.L-M2012820]
(Received March 7, 2012; Accepted May 25, 2012; Published August 1, 2012)
Keywords: induction heating, 6061 aluminum alloy, local reinforcement, solution treatment
1. Introduction
The hardness and strength of many machine parts such as gears, bearings, and turbine blades may be increased by heat treatment. However, partial strengthening may be more desirable to maintain the toughness, rather than overall strengthening of the products. For heat treatable aluminum alloys, local heat treatment at solution temperatures has been considered to be a useful technique for partial reinforcement. Such local heat treatments are also expected to reduce the quenching distortion, energy consumption and production cost, as well as improve the wear resistance and fatigue properties. Induction heating, a laser, or aflame is commonly used for this local heating. In the laser method, the application of a CO2 laser to the local softening of 1070
aluminum alloy has been reported.1,2) An improvement
in the formability as a result of local heating by the CO2
laser was also observed for steel sheets.3) Moreover, the
wear resistance of AlSi alloy products was improved by a surface melting treatment using a CO2 laser.4,5) In the case
of the flame method, the surface hardness of 12%Cr steel was increased from 250 HV to 420550 HV by flame hardening.6,7) Afterflame hardening treatment, cast iron also
showed a superior wear resistance.8) For the induction heating method, the ductility of a 1070 aluminum alloy sheet was improved as a result of local heat treatment using induction heating.9)The effect of partial heat treatment using induction heating on the distribution of the residual stress has also been reported for S45C steel bars.10)The dieless forming of pipe materials by local induction heating has been applied for cost reduction.11) The fatigue strength of a low carbon
steel pipe was also improved by applying local induction
heating.12) As mentioned above, there have been many
studies on the local heat treatment of steel, as compared to aluminum alloys. In particular, studies on the heat treatment of aluminum alloys using induction heating are limited. This may be because the heating efficiency of aluminum alloy products using conventional induction heating apparatus is insufficient. In addition, because a conventional thermo-couple cannot be used because of the magnetic fields generated by the induction heating coil and the emissivity of aluminum alloys is unstable for temperature measurement using a radiation thermometer, it is difficult to measure the temperature of an aluminum alloy during heating by induction heating apparatus. Our previous study13) showed that aluminum alloy bars with a 10-mm diameter can be heated efficiently using the induction heating apparatus with a higher frequency (2 MHz) than a conventional induction heating apparatus (less than 400 kHz). Furthermore, surface coating of the aluminum alloy with a black spray also leads to precision temperature measurement using a radiation thermometer. These experimental results suggest that com-bining a radiation thermometer and the induction heating apparatus with a high frequency of 2 MHz will enable the accurate and efficient heat treatment of aluminum alloys. In particular, precise local heating using an induction coil may be expected.
In this work, a commercial 6061 aluminum bar was locally heated using the induction heating apparatus having a frequency of 2 MHz, with the objective of confirming the possibility of partial reinforcement. The heating states were examined in terms of the temperature profiles and hardness distributions in the longitudinal direction of the bars. The effects of the holding times and heating rates during local heating on the hardness distribution were also investigated.
2. Experimental
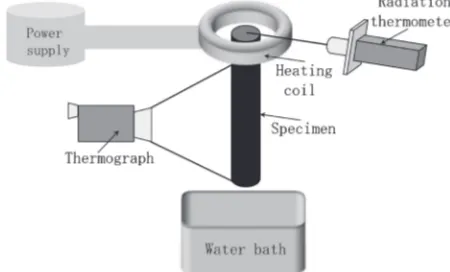
The material used in this study was an extruded bar of commercial A6061-T6 aluminum alloy (10 mm in diameter, 150 mm in length). Before the local heating using the induction heating apparatus, the samples were subjected to over-aging treatment (688 K for 2 h) using an electrical furnace to adjust them to almost the same states of precipitation (as-annealed). Figure 1 is a schematic diagram showing the arrangement of the specimen, induction heating coil, radiation thermometer, thermograph and cooling water bath. The frequency and power of the induction heating apparatus were 2 MHz and 10 kW, respectively. The surface of the sample was sprayed with a black coating to ensure precise temperature measurement using a radiation thermom-eter with a measurable temperature range of more than 523 K. Based on a previous study,13) the emissivity value of the
radiation thermometer was set to 0.78 to accurately measure the temperature. The radiation thermometer measured the temperature at the tip of the bar. The tip of the bar was locally heated for the solution treatment (local solution treatment). In this case, the power supply to the heating coil was regulated by the temperature of the tip. The local solution treatment conditions are summarized in Fig. 2. The temperature distribution in the longitudinal direction of the bar was also measured simultaneously at the side surface of the bar using a thermograph. After the local solution treatment, the bars were quenched in water at room temperature, which was located below the bar. After quenching, the samples were naturally aged for 48 h at room temperature (T4). One of them was artificially aged at 453 K for 8 h using an electric furnace (T6). After the natural/artificial aging, a Vickers microhard-ness test, electrical conductivity measurement, and
structure observation were performed. The Vickers micro-hardness was measured at a load of 100 gf and a holding time of 15 s. The hardness distribution in the longitudinal direction was measured at the central part of a sample. The electrical conductivity was measured using a digital electrical con-ductivity meter (Autosigma 2000). The samples for optical microscopy observations were prepared using the anodic oxidation method. These measurements and observations were also conducted at the center plane of the bar.
3. Results
3.1 Accuracy and reproducibility of heating state
Because it was difficult to maintain the thermal conduction in the bar and the heat radiation into the air constant, it was necessary to investigate the heating state during the local solution treatment in detail. Therefore, the accuracy and reproducibility of the heating state during the local solution treatment were examined, that is, the temperature profile at the tip and the temperature distribution in the longitudinal direction of the bar were measured repeatedly. First, the heating rate dependence of the temperature profile during the local solution treatment was investigated because temperature control appeared to be difficult at a rapid heating rate. The temperature profiles at heating rates of 80 and 0.8 K/s were measured at the tip of the bar using the radiation thermometer. Figure 3(a) shows the heating rate dependence of the temperature profile. The enlargements of the temper-ature profiles immediately after the completion of the temperature rise are shown in Figs. 3(b) and 3(c). Because the measurable lower limit temperature of the radiation thermometer was 523 K, temperatures above 523 K are shown in Fig. 3(a). A linear rise in the temperature up to the solution treatment temperature during the heating process was confirmed for each heating rate. As the enlargements show, a small-scale overheating (2 K) was achieved during the temperature transition stage from the heating to holding processes. In addition, there was no significant temperature
fluctuation (below«8 K) in the holding process. From these results, precision temperature control during the local solu-tion treatment can be achieved using an inducsolu-tion heating apparatus for each heating rate. To check the heat conduction state during the local solution treatment, the temperature distribution in the longitudinal direction of the bar was measured using a thermograph. Figures 4(a) and 4(b) show the temperature distributions at each holding time for the heating rates of 0.8 and 80 K/s, respectively. The temperature distributions of the 0.8 K/s rate were almost the same at every holding time because a sufficient time for thermal conduction was maintained by the very slow heating rate. However, for the heating rate of 80 K/s, heat at the tip of the bar conducted gradually in the longitudinal direction with the lapse of holding time. In particular, significant heat was conducted from 0 to 1 min. These temperature distributions suggest that an effective local reinforcement at the tip of the bar may be realized when the tip is heated rapidly in a short time. To examine the reproducibility of the heating state during the local solution treatment, the temperature distribu-tions in the longitudinal direction were measuredfive times for the local solution treatment at a holding time of 5 min for
Fig. 1 Schematic diagram of experimental apparatus.
[image:2.595.53.278.74.210.2] [image:2.595.49.288.253.352.2]the heating rates of 80 and 0.8 K/s. Figure 5 shows the temperature difference ¦T between the highest and lowest temperatures, at each position for the five measurements. That is, the values of ¦T show the reproducibility of the heating state. For the heating rate of 0.8 K/s, ¦Tincreased rapidly from 0 to 10 mm and then saturated at about 7 K. A similar tendency was obtained for the 80 K/s heating rate. However, the saturated value was around 10 K higher than that of 0.8 K/s. The reason for the higher ¦T value with the 80 K/s rate is that the state of the heat conductions in the bar and into the air became unstable with an increase in the heating rate. As the maximum value of ¦T, 17 K, is equivalent to 2% of the solution temperature of 803 K, a comparatively good reproducibility for the heating state can be secured for each heating rate, especially within 10 mm of the tip.
3.2 Holding time dependence of hardness distribution
To examine the effect of the holding time on the partial reinforcement, the hardness distribution was measured for specimens that were locally solution treated at the rapid
Fig. 3 Temperature profiles for various heating rates (a) and enlargements of temperature profiles immediately after completion of temperature rise for heating rates of 80 K/s (b) and 0.8 K/s (c).
300 400 500 600 700 800 900
0 10 20 30 40 50 60
0 min 1 min 5 min 10 min
T
emperature,
T
/K
Distance from tip, Y/mm
(a) Heating rate:0.8 K/s
300 400 500 600 700 800 900
0 10 20 30 40 50 60
0 min 1 min 5 min 10 min
T
emperature,
T
/K
Distance from tip, Y/mm
(b) Heating rate:80 K/s
Fig. 4 Temperature distributions for heating rates of 0.8 K/s (a) and 80 K/s (b).
0
5
10
15
20
25
0
10
20
30
40
50
60
Dif
ference of temperature,
Δ
T
/K
Distance from tip, Y/mm
Temperature:803 K
Holding time:5 min
Heating rate:80 K/s
Heating rate:0.8 K/s
[image:3.595.149.448.70.275.2] [image:3.595.137.461.332.489.2] [image:3.595.321.533.530.740.2]heating rate of 80 K/s. The local solution treatment was conducted at 803 K for various holding times, and then the samples were artificially aged at 453 K for 8 h. Figure 6 shows the Vickers hardness distribution in the longitudinal direction. The hardness near the tip of the bar clearly increased until a holding time of 5 min, but was saturated at about 100 HV with a further increase in time. An approx-imately similar tendency was also observed in the hardened area. These results suggest that various hardness distributions can be realized by adjusting the holding time. The hardness shown in Fig. 6 was measured at the center of the bar. If the temperature distribution in the radius direction of the bar is steep as a result of the skin effect14)of the induction heating,
the hardness may vary in the radial direction. Figure 7 shows the Vickers hardness distribution in the radial direction. The hardness distribution in the radial direction was measured for
a sample that was locally solution treated at 803 K for 1 min and then aged at 453 K for 8 h. As shown in Fig. 7, there was no significant difference in the hardness distribution in the radial direction at any distance from the tip (Y-position). These hardness distributions suggest that a steep temperature distribution in the radial direction of the bar does not occur because of the good heat conduction of the aluminum alloy, as well as the small sample size.
3.3 Heating rate dependence of hardness distribution
As shown in Fig. 4, the temperature distributions varied with the heating rate, and a sharp distribution of the temperature occurred with rapid heating. Therefore, the heating rate is expected to have a significant influence on the partial reinforcement. To investigate the effect of the heating rate on the partial reinforcement, the hardness distributions for slow and rapid heating rates were measured. Figure 8 shows a comparison of the hardness distributions between the heating rates of 0.8 and 80 K/s. The samples were subjected to local solution treatment at 803 K for 0 min and artificial aging treatment at 453 K for 8 h. The hardness with the 0.8 K/s heating rate was higher than that for 80 K/s, and the hardened area was also extended. The sufficient heat conduc-tion and extension of the time in the high-temperature range with a slow heating rate of 0.8 K/s may result in a higher hardness value, as well as an extension of the hardened area. Although the increase in the hardness at 80 K/s was small, this result also suggests that an increase in the heating rate could produce reinforcement in a narrow area.
4. Discussion
As mentioned above, the tip of the bar could be partially reinforced using an induction heating apparatus. This partial reinforcement may result from precipitation hardening caused by the local solution treatment followed by the artificial aging treatment. Thus, on the basis of the temperature profiles and electrical conductivities, the state of the solid solution during
0
20
40
60
80
100
120
0
10
20
30
40
50
60
0 min
1 min
5 min
6 min
8 min
10 min
V
ick
ers microhardness,
HV
Distance from tip, Y/mm
Temperature:803 K
Heating rate:80 K/s
T6 treatment
Fig. 6 Vickers hardness distributions in longitudinal direction for various holding times. Hardness measurement was conducted after T6 treatment.
Fig. 7 Vickers hardness distribution in radial direction.
0
20
40
60
80
100
120
0
10
20
30
40
50
60
0.8 K/s
80 K/s
V
ick
ers microhardness,
HV
Distance from tip, Y/mm
Temperature:803 K
Holding time:0 min
T6 treatment
[image:4.595.64.277.69.275.2] [image:4.595.321.533.71.279.2] [image:4.595.54.285.331.557.2]the local solution treatment and the precipitation behavior in the artificial aging treatment were examined. The temperature profiles at each measurement position (Y-position) in the longitudinal direction were obtained from the thermograph data and are shown in Fig. 9. The sample was locally solution treated at 803 K for 10 min at a heating rate of 80 K/s. The temperature increased rapidly in a short time and saturated after additional time. As the position approached the tip of the bar, the increase in temperature became faster and the time required for saturation also became shorter. The saturated temperature at each position decreased with an increase in the distance from the tip. The electrical conductivity at each measurement position was also meas-ured to investigate the relationship between the temperature profile during the local solution treatment and the amount of solid solution. This electrical conductivity measurement was performed for the samples under naturally aged (T4) and artificially aged (T6) conditions. Figure 10(a) shows the electrical conductivity in the T4 condition. For less than 40 mm, the electrical conductivity decreased with an increase
in the holding time. Particularly, there was a significant decrease in electrical conductivity within 5 min. In addition, this decrease in electrical conductivity was markedly at a position close to the tip. This change in electrical con-ductivity suggests that the amounts of solid solute atoms in the matrix increased within 5 min at a position near the tip. Figure 10(b) shows the difference in the electrical conductiv-ities between the T4 condition and T6 condition,¦IACS% = IACS%T6¹IACS%T4. The increase in ¦IACS% suggests
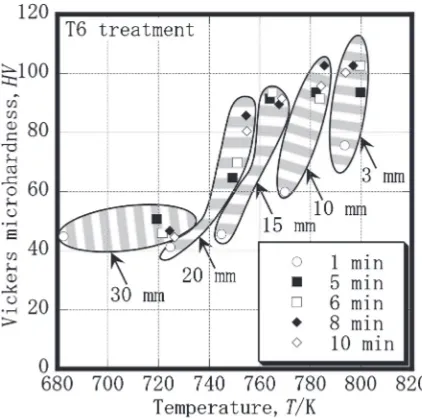
[image:5.595.64.276.329.531.2]that the quantity of the solid solute atoms in the matrix decreased as a result of the formation of precipitates during the artificial aging treatment. Although a slightly different change was seen in the 10 min period, ¦IACS% generally increased with an increase in the holding time. For a position within 30 mm from the tip, a significant increase in¦IACS% was recognized. These changes are in contrast to those for the electrical conductivity during the local solution treatment, as shown in Fig. 10(a). Therefore, a precipitation hardening can be expected to occur for a position within 30 mm from the tip. It is well known that the temperature and holding time during solution treatment have a significant influence on the mechanical properties. To investigate the relationships between the hardness, temperature, and holding time, the hardness was plotted against the temperature, as shown in Fig. 11. The hardness and temperature values at each measurement position for various holding times were obtained from Figs. 6 and 9. In Fig. 9, distances of 3, 10, 15, 20 and 30 mm were selected as typical positions in the longitudinal direction. Similarly, 1, 5, 6, 8 and 10 min in Fig. 6 were chosen as the holding times. Figure 11 shows that a temperature of 723 K or more is necessary to increase the hardness, and a rise in temperature brings about a higher hardness. The hardness increase at each position resulted from the extension of the holding time, while the quantity of hardness increase became lower for a holding time of 5 min or more. A previous report13) on heat treatment with rapid heating pointed out that a sample must be heated to more than 713 K to increase the mechanical properties. The findings shown in Figs. 6, 9, 10 and 11 are in good agreement with those of the previous study. Namely, temperatures above 723 K made the quantity of solid solution atoms increase,
300 400 500 600 700 800 900
0 100 200 300 400 500 600 3 mm 6 mm 10 mm 15 mm 20 mm 25 mm 30 mm T emperature,
T
/K Time, t/sHeating rate:80 K/s
Y–position
Fig. 9 Temperature profiles at each measurement position in longitudinal direction. 35 40 45 50 55
0 10 20 30 40 50 60
0 min 1 min 5 min 6 min 8 min 10 min Electrical conducti vity , IA CS%
Distance from tip, Y/mm
Temperature:803 K Heating rate:80 K/s T4 treatment (a) –2 –1 0 1 2 3 4 5 6
0 10 20 30 40 50 60
0 min 1 min 5 min 6 min 8 min 10 min Dif
ference of electrical
conducti vity , Δ IA CS%
Distance from tip, Y/mm
[image:5.595.123.476.592.759.2](b)
which resulted in precipitation hardening. In addition to the above, it was also shown that a holding time of 5 min or more was less important. To investigate the microstructural features in detail, optical microscope images were observed. Figure 12 shows the cross-sectional microstructures of the samples under the as-annealed and locally solution treated conditions. The local solution treatment was conducted at 803 K for 10 min with a heating rate of 80 K/s, and the microstructure was observed at the positions of 3, 10, 20 and 30 mm. The broken line inserted in the figure indicates the boundary of the grain-growth region and the fine-fibrous grain region. The grain growth in the outer section, which may have been formed in the extrusion process or following the T6 heat treatment, was observed for the as-annealed sample. When the local solution treatment was conducted, the area of grain growth increased at the positions of 3 and 10 mm. However, the state of the grain growth at the positions of 20 and 30 mm was almost the same as the
as-annealed sample. From these microstructures and the temperature profiles shown in Fig. 9, grain growth was promoted in the outer section at about 753 K or more. In contrast, the fibrous grains in the inner section remained in a fine state regardless of the heat treatment. Because the hardness was measured at the center plane of the bar, the hardness distribution shown in Fig. 6 is considered to have resulted from precipitation hardening.
5. Conclusions
The ability to partially reinforce a heat-treatable aluminum alloy bar was investigated through the application of an induction heating apparatus. The temperature and hardness distributions after local solution treatment were examined. The results of this study are as follows:
(1) Rapid and excellent local heating could be performed for a 6061-aluminum alloy bar using an induction heating apparatus. The local solution treatment achiev-ed a rapid heating rate of 80 K/s, overheating of about 2 K at the temperature transition stage from the heating to holding process, and a small-scale temperature
fluctuation (below «8 K) in the holding process. A local solution treatment with good reproducibility could be performed using the induction heating apparatus. (2) Good agreement was found between the temperature
profile and hardness. An increase in hardness resulted from a solution treatment at 723 K or more. The holding time of 5 min or more was less important for the increase in hardness. Applying an induction heating apparatus made it possible to partially reinforce a 6016 aluminum alloy bar.
Acknowledgements
[image:6.595.62.273.311.520.2]This work was supported by Asakawa Netusyori Co., Ltd. and Marushin Heat Co., Ltd. for the technical analysis. Part of this study was funded by the Light Metal Educational Foundation, Inc.
Fig. 12 Cross-sectional microstructures of samples under as-annealed and locally solution treated conditions. Local solution treatment was conducted at 803 K for 10 min with heating rate of 80 K/s. Broken line infigure indicates boundary between grain-growth region andfine-fibrous grain region.
[image:6.595.104.494.573.752.2]REFERENCES
1) K. Nakamura, M. Nakamura, A. Takahashi and S. Yoshioka:J. JILM 53(2003) 421426.
2) K. Nakamura, A. Takahashi and M. Nakamura:J. JILM55(2005) 494 499.
3) O. Ichiko and N. Ikenaga:J. Jpn. Soc. Pre. Eng.60(1994) 17761780. 4) S. Shibata, S. Tomida and K. Nakata:J. JILM50(2000) 609613. 5) I. Shigematsu, M. Nakamura and M. Machida:J. JILM47(1997) 292
297.
6) M. K. Lee, G. H. Kim, K. H. Kim and W. W. Kim:Surf. Coat. Technol. 184(2004) 239246.
7) M. K. Lee, G. H. Kim, K. H. Kim and W. W. Kim:J. Mater. Process.
Technol.176(2006) 140145.
8) K. Ogawa:J. Jpn. Soc. Pre. Eng.30(1964) 794802.
9) K. Manabe and H. Nishimura:J. Jpn. Soc. Mech. Eng.26(1983) 194 201.
10) M. Kurita and T. Sato:Trans. Jpn. Soc. Mech. Eng. A57(1991) 2472 2479.
11) H. Asao, K. Okda, H. Yonemura and S. Fujishima:J. Jpn. Soc. Pre. Eng.50(1984) 531533.
12) Y. Lee, J. Lim, Y. Kwon and Y. Moon:Proc. Eng.10(2011) 3333 3338.
13) F. Shang, E. Sekiya and Y. Nakayama:Mater. Trans.52(2011) 2052 2060.