Theoretical Calculation of Activation Free Energy
for Self-Diffusion in Prototype Crystal
K. Sato, S. Takizawa and T. Mohri
Division of Materials Science and Engineering, Graduate School of Engineering, Hokkaido University, Sapporo 060-8628, Japan
We investigate temperature dependency of the activation free energy for the atomic diffusion in the fcc Lennrad-Jones system within the transition states theory based on the quasi-harmonic approximation. The activation free energy consists of the static activation energy and the vibrational free energy difference between the saddle point and the equilibrium state, and it is shown that both of them strongly depend on the system volume and the temperature. The temperature dependencies of both quantities exhibit opposite tendencies, i.e., the static activation energy decreases, while the free energy difference increases with increasing temperature. As a result, the activation free energy shows a weak temperature dependency. We discuss the effects of anharmonicity on the activation free energy by comparing the activation free energy obtained by the quasi-harmonic and harmonic approximations. [doi:10.2320/matertrans.MAW201009]
(Received April 26, 2010; Accepted May 20, 2010; Published July 7, 2010)
Keywords: atomic diffusion, transition state theory, quasi-harmonic approximation
1. Introduction
Theoretical investigations of the atomic diffusion have been extensively made for several decades.1–6) Among the
many topics associated with the atomic diffusion in metals, one of the most essential problems is calculating the self-diffusion coefficient from the first-principles.4,5) While accurate first-principles calculations are now possible for the energetics of crystalline solids at zero temperature, it is challenging to predict the atomic diffusivity at finite temper-atures since one needs to calculate theactivation free energy rather than activation energy at finite temperatures. The activation energy is defined as the difference of the internal energies in the equilibrium and transition states at 0 K. On the other hand, the activation free energy is defined as the difference of the free energies between the two states due to the entropy contribution at finite temperatures. This reflects the fact that various paths from a potential energy minimum to another through the relevant saddle points are possible.
A strategy to calculate the diffusion coefficient is to simulate directly the diffusion events by Molecular Dynam-ics (MD).6,7)First-principles MD is also available at present. However these direct simulations involve a serious problem that as the temperature is lowered, atomic jumps become rarer, and thus for the time scale of MD, it is very time-consuming to observe the atomic jumps statistically enough. Therefore MD is available only for very high temperatures.
In the framework of the transition state theory (TST),1,8–10)
the transition rate is defined as the ratio of two configura-tional partition functions, one is for the equilibrium states including3N3degree of freedoms, and the other is for the transition states including3N4degree of freedoms since one degree of freedom which corresponds to the direction of reaction coordinate is excluded. Evaluating two partition functions rigorously from the first-principles is daunting task, in principle, which originates from the difficulty of restricted integration on the transition states. One approximated solu-tion is to employ the harmonic approximasolu-tion (HA)5,9,10)in order to calculate two partition functions. It is known that the HA is valid only for low temperatures. However, the
interesting temperature range for the diffusion phenomena in solids is above one half of a melting point. At high temperatures, the anharmonicity of lattice vibrations which induces the thermal expansion of a lattice, cannot be ignored. The quasi-harmonic approximation (QHA)11) takes into
account the thermal expansion of a lattice as a form of the volume dependent phonon frequencies.
The aims of the present study are to calculate the activation free energy of self-diffusion in a prototype crystal and clarify the temperature dependency of the activation free energy and origin within the QHA.
2. System of Interest
We employ the 12–6 Lennard-Jones (LJ) potential given by
ðrÞ ¼ r0
r 12
2 r0
r 6
" #
; ð1Þ
where and r0 are the depth of energy and the nearest neighbor distance respectively. In the present calculations the interaction energy is calculated by taking the interaction range up to the 2nd nearest neighbor atoms. The fcc supercell is prepared by repeating the cubic fcc unitcell by555 with periodic boundary conditions, and one atom is removed to create a vacancy. For all calculations in this study, this supercell is used. Basic physical properties can be expressed in reduced units: volume ina3, whereais the lattice constant of fcc unitcell, energy in, and temperature in=kBwherekB
is Boltzmann constant. Planck constant is also expressed by reduced unith¼h=pffiffiffiffiffiffiffiffiffiffima2. In the present study, we adopt h¼0:02which is roughly the same as that of Al. Thus unit of time in this study is¼hpffiffiffiffiffiffiffiffiffiffiffiffiffiffiffima21.
3. Theoretical Details and Methods
3.1 Transition state theory
In general the diffusion coefficient is derived from the Einstein relation based on the random walk of the diffusing atom,
D¼ lim
t!1
hr2ðtÞi
2dt ; ð2Þ
wherehr2ðtÞi ¼a2
0Nis the mean square displacement of the diffusing atom,Nthe number of jumps,a0the jump distance, d the dimension of the space, andtis the time. The number of jumps,N, is simply the product of the time period and a jump rate, which for thermally activated diffusion can be expressed according to the TST1)as
¼kBT h exp
F
kBT
; ð3Þ
where F is the difference in the Helmholtz free energy between the maximum (saddle point) and the minimum of the potential energy curve along the reaction coordinate,kBis the
Boltzmann constant, h is the Planck constant and T is the temperature.
In the present work, the vacancy mechanism diffusion is considered, thus a vacancy diffusion coefficient is given by
D¼DCVf ð4Þ
where f is the correlation factor which corrects deviation from random jump of a vacancy, andCVis the equilibrium
vacancy concentration given by
CV¼exp
Ff
kBT
; ð5Þ
whereFf is the formation free energy of a vacancy defined
by difference in the free energy between the perfect crystal and a crystal including one vacancy. In the present study, we focused on the transition rate, alone and neglect the temperature dependency of the formation free energy of a vacancy, i.e., Ff is a constant. Thus we refer to F in
eq. (3) as the activation free energy in the following. The activation free energy,F, consists of two terms,
F¼þFvib ð6Þ
where is the static activation energy andFvib is the
vibrational free energy difference. In the followingdenotes the difference of a quantity,A, between the saddle point and the equilibrium state,
A¼AsadAequi: ð7Þ
Here subscripts ‘sad’ and ‘equi’ express the saddle point and equilibrium states respectively. In order to determine the activation free energy,andFvib, which depend on the
temperature and system volume, are needed. We calculate the static activation energy,by Molecular Statics (MS) calculations, and Fvib by the QHA. In the following
sections, we present the detail of each calculation.
3.2 Molecular statics calculation
We determine the static activation energy and relaxed atomic configuration for both the equilibrium state and saddle point at several volumes by MS calculations. These config-urations are exploited as an input configuration when calculating the vibrational free energy within the QHA.
The definition of the static activation energy is
¼sadequi ð8Þ
wheresadandequi are the internal energy at 0 K with the
saddle point and the equilibrium configuration respectively. The equilibrium energy and configuration with one vacancy are evaluated simply by relaxing the displacements of all atoms toward the energy minimum. For the saddle point energy calculations, we need to know the saddle point configuration. In the present case of a bulk fcc crystal, the position of the jumping atom at the saddle point is known by symmetry of fcc structure, and it is halfway of the jump vector which connects the equilibrium position of jumping atom and vacancy. For the configuration, the total energy of simulation cell was minimized with respect to the displace-ments of all other atoms. During the minimization process the motion of the jumping atom is restricted within the perpen-dicular direction of the jump vector. In order to prevent the rigid translation of the whole simulation cell, an equal artificial counter-force is applied to every non-jumping atom so that to balance the force acting on the jumping atom.12)
3.3 Quasiharmonic approximation
To determine the activation free energy, it is necessary to evaluate the equilibrium volumes in the temperature range of interest. Once the equilibrium volumes are determined, the corresponding vibrational free energy differences,Fvibare
calculated at each equilibrium volume. We calculate the equilibrium volumes and the corresponding vibrational free energy differences within the QHA. The QHA takes into account contributions of an anharmonicity of the lattice vibration which is only associated with the volume depend-ence of the phonon frequencies. Although various approxi-mated methods to incorporate this effect into the free energy of system have been suggested,11) we choose a
straightfor-ward way in which one calculates directly the phonon frequencies at several volumes within the HA and determines the equilibrium volume by minimizing the obtained free energies with respect to the volume at each temperature.
In the QHA, the free energy of a system is expressed as
FvibðT;VÞ ¼E0ð0;VÞ þFharðT;VÞ ð9Þ
where E0 is static lattice energy at 0 K and Fhar is the
harmonic free energy at a temperature given by
Fhar ¼kBT
Z1
0
NðÞln 2 sinh hðVÞ 2kBT
d; ð10Þ
whereNðÞis the phonon density of states. The equilibrium volume is obtained by minimizing eq. (9) with respect toV. At each equilibrium volume, we also calculate the free energy of a saddle point. The phonon freqencies are calculated according to standard procedures.13) Let u
i be
displacemnt of atom i, and Mi be mass of atom i. Time
derivatives are denoted by dots while greek letter subscripts denote one of the Cartesian components of a vector. In the HA, the energy of the system can be expressed as
H¼1
2
X
i
Miuu_2i þ
1 2
X
i;j
uðiÞTði;jÞuðjÞ; ð11Þ
where
ði;jÞ ¼ @
2U
@uðiÞ@uðjÞ
Here U is a potential energy of a system as a function of positions of all atoms. The dynamical matrix is defined as the Fourier transform of the force constant matrix ði;jÞ. Diagonalizing the dynamical matrix leads to square of the phonon freqencies. The components of force constant matrix can be calculated analytically using first- and second-order derivative of the Lennard-Jones potential. In the calculation of the free energy at the equilibrium states, we integrate over all vibrational states, including 3N3 degree of freedoms (3 is due to rigid body translation). When calculating the vibrational free energy at the saddle points, we have to estimate the volume in the configurational space where the system must pass through in order to reach a next energy minimum. In other words, we calculate the volume where the points of the highest energy along the various reaction paths distribute. Thus we should not make integration along the direction of the reaction coordinate. Since the eigenvalue corresponding to the reaction coodinate is negative, we can easily exclude the irrelevant direction. In all calculations, the k-point sampling is done on555 mesh in the first Brillouin zone.
4. Results and Discussion
4.1 Static activation energy
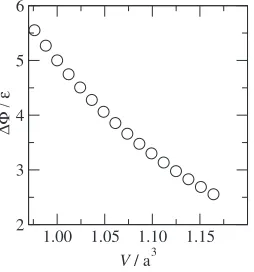
The calculated static activation energies at several vol-umes are shown in Fig. 1. strongly depends on the system volume and decreases with dilation of the volume. In
the LJ potential, the potential energy of an atom is a function of interatomic distances between interacting atoms, and the repulsive part is more rigid than the attractive part. The interatomic distances around the jumping atom are smaller than other atoms, which are responsible for the activation energy. Hence the activation energy decreases with the increase of the system volume. It is noted that the static activation energy depends on the temperature through the temperature dependence of the system volume within the QHA.
4.2 Quasiharmonic calculation
[image:3.595.108.235.429.565.2]In order to determine the equilibrium volume at each temperature, we calculate the vibrational free energy at several volumes from the eq. (10). Figure 2 shows the typical phonon density of states in the present system for the equilibrium state and saddle point. Both the results are nearly identical, but two general aspects appear for the saddle point. First, some high frequency modes are generated, which are caused by the relatively small interatomic separations around the jumping atom. Second, though it cannot be visualized, total vibrational degree of freedom is 3N3 for the equilibrium state while that is 3N4 for the saddle point since there is a imaginary frequency which corresponds to the reaction coordinate direction (unstable mode) as stated above. The fact that both results are almost the same implies that the activation free energy is a localized quantity. The difference of both configurations is localized only around jumping atom. Therefore atoms which are far from the jumping atom remain at the equilibrium positions in both states.
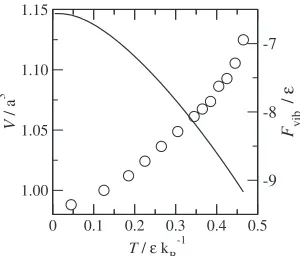
Figure 3 shows the calculated equilibrium volume and corresponding free energy, E0þFhar. In fcc LJ solids,
anharmonicity of the crystal is quite large and it leads to the large thermal expansion of the lattice. In the QHA calculations, we find that the free energy minimum with respect to the volume disappears above T ¼0:5, which represents the instability of the lattice.14)Moreover, near the
instability temperature, the thermal expansion of the lattice becomes steeper, i.e., the coefficient of thermal expansion is quite large.
For these obtained equilibrium volumes, we also calculate the free energy of the saddle point using eq. (10). The 1.00 1.05 1.10 1.15
V / a3 2
3 4 5 6
∆Φ / ε
Fig. 1 Static activation energy vs system volumes.
0
10
20
30
40
50
frequency,
ω / τ
-10.0
0.1
0.2
density of states,
D
(
ω)
0
10
20
30
40
50
frequency,
ω / τ
-10.0
0.1
0.2
density of states,
D
(
ω)
(a) equilibrium state (b) saddle point [image:3.595.131.467.609.767.2]obtained vibrational free energy difference, internal energy and entropy are shown in Fig. 4. In these figures, the circle represents the results of the QHA, the solid line represents results of the HA. Note that in HA there are no thermal expansions and thus the volume is fixed atV ¼1:00. In both results, the vibrational free energy differences increase with increasing the temperature. One can confirm that at high temperatures, the result of the QHA exhibits larger change than that of the HA, and the difference originates from the anharmonicity of the activation entropy since the internal energy changes are almost the same for the both results.
4.3 Anharmonicity
The internal energy in Fig. 4(b) changes linearly, espe-cially at high temperatures the slope is unity which equals to thekB in the present unit system. This temperature
depend-ency can be explained by the difference in the degree of freedom between the equilibrium state and the saddle point. In the QHA the anharmonicity of lattice vibrations is introduced through the volume dependence of phonon frequencies as above mentioned. Thus a potential energy function is expanded up to the second order with respect to the atomic displacements similar to the HA. It is well known that the HA yields kB as the temperature dependence of
the internal energy per one degree of freedom, indicating that at high temperatures where quantum effects can be neglected, an expectation value of the internal energy obeys exactly equipartition theorem. Hence expectation values
of the equilibrium state and saddle point are hEequii ¼
ð3N3ÞkBT andhEsadi ¼ ð3N4ÞkBT respectively. Thus
Evib¼ hEsadi hEequii ¼ kBT: ð13Þ
This is the general results within the harmonic approximation of the potential surface. In real systems, the anharmonicity of a potential surface affects the internal energy difference, which is beyond the present study.
To examine the effect of anharmonicity on entropy, we rewrite the difference in entropy between the QHA and HA as
SQHA{HA¼SQHASHA
¼ ðSsadQHASequiQHAÞ ðSsadHASequiHAÞ ¼ ðSsadQHASsadHAÞ ðSequiQHASequiHAÞ:
Third line in the equations above expresses the magnitude of anharmonicities at the saddle point and equilibrium state, and our results show that it is negative. As stated above, the QHA includes the anharmonicity through the volume dependence of phonon frequencies. Therefore this result indicates that the influence of the thermal expansion on the entropy is larger for the equilibrium state than for the saddle point. In the simple estimation of anharmonic contribution,11)
changes in the entropy as a function of the temperature that is due to the thermal expansion are proportional to the ratio of square of Gru¨neisen parameter and bulk modulus,
SðTÞ /2=B. If one focuses on the local atomic configu-rations around a vacancy, the equilibrium state issofterthan the saddle point since atoms located around a vacancy almost retain the equilibrium interatomic distance for the equi-librium state, while interatomic distances between jumping atom and its neighboring atoms are somewhat small for the saddle point.
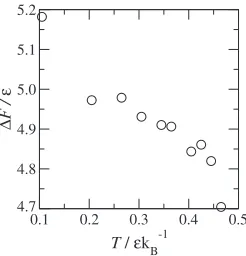
The calculated activation free energy from eq. (6) is shown in Fig. 5. One can see from Fig. 5 that F shows weak temperature dependency as a result of compensation between andFvib. Each term in eq. (6) exhibits strong
temper-ature dependency but they are opposite tendencies. As a temperature approaches 0.5, the activation free energy decreases. As mentioned above, the minimum of the free energy disappers at T ¼0:5 and the thermal expansion is quite large near this temperature. Thus the value may include some uncertainty.
0.1 0.2 0.3 0.4 0.5
T / εkB-1
0.0 0.5 1.0 1.5 2.0
∆
F vib
/
ε
0.1 0.2 0.3 0.4 0.5
T / εkB-1
-0.5 -0.4 -0.3 -0.2 -0.1 0.0
∆
E vib
/
ε
0.1 0.2 0.3 0.4 0.5
T / εkB-1
-5.0 -4.0 -3.0 -2.0
∆
S vib
/ k
B
(a) (b) (c)
Fig. 4 Difference in (a) vibrational free energy, (b) internal energy and (c) entropy. Circle and solid line represent the results of the QHA and HA respectively.
0 0.1 0.2 0.3 0.4 0.5
T / ε kB-1
1.00 1.05 1.10 1.15
V
/ a
3
-9 -8 -7
Fvib
/
ε
[image:4.595.94.244.73.201.2] [image:4.595.96.504.626.757.2]5. Conclusion
The activation free energy which determines the self-diffusion coefficient within the TST is investigated based on the QHA. The static activation energy and vibrational free energy difference strongly depend on the temperature and the system volume. However the tendencies are opposite nature, i.e., the static activation energy decreases while the vibra-tional free energy increases with increasing the temperature. Consequently the obtained activation free energy has weak
temperature dependency. The temperature dependency is found to be larger for the QHA calculation, and the difference between the HA and QHA originates from the entropy term.
REFERENCES
1) G. H. Vineyard: J. Phys. Chem. Solids3(1957) 121. 2) W. Franklin: J. Phys. Chem. Solids28(1967) 829.
3) G. De Lorenzi, G. Jacucci and C. P. Flynn: Phys. Rev. B36(1987) 9461.
4) W. Frank, U. Breier, C. Elsa¨sser and M. Fa¨hnle: Phys. Rev. Lett.77
(1996) 518.
5) M. Mantina, Y. Wang, R. Arroyave, L. Q. Chen and Z. K. Liu: Phys. Rev. Lett.100(2008) 215901.
6) N. Sandberg, B. Magyari-Ko¨pe and T. R. Mattsson: Phys. Rev. Lett.89
(2002) 065901.
7) B. P. Uberuaga, S. M. Valone and M. I. Baskes: J. Alloy. Compd.444
(2007) 314.
8) H. Yildirim, A. Kara, S. Durukanoglu and T. S. Rahman: Surf. Sci.600
(2006) 484.
9) U. Ku¨rpick: Phys. Rev. B64(2001) 075418.
10) L. Kong and L. J. Lewis: Phys. Rev. B77(2008) 165422. 11) A. van der Walle and G. Ceder: Rev. Mod. Phys.74(2002) 11. 12) C. Herzig, T. Przeorski and Y. Mishin: Intermetallics7(1999) 389. 13) J. M. Ziman: Principles of the theory of solids, (Syndics of the
Cambridge University Press, Cambridge, 1972).
14) R. G. D. Valle and E. Venuti: Phys. Rev. B58(1998) 206.
0.1 0.2 0.3 0.4 0.5
T / εkB-1
4.7 4.8 4.9 5.0 5.1 5.2
∆
F /
ε
[image:5.595.108.231.73.201.2]