Phase Separation of the B2 Structure Accompanied by an Ordering
in Co-Al and Ni-Al Binary Systems
Hiroshi Ohtani
1, Ying Chen
2and Mitsuhiro Hasebe
11
Department of Materials Science and Engineering, Kyushu Institute of Technology, Kitakyushu 804-8550, Japan
2School of Engineering, The University of Tokyo, Tokyo 113-8656, Japan
The phase separation of the B2 structure in the Co-Al and Ni-Al binary systems has been studied by combiningab initioenergetic calculations with the CALPHAD approach. The total energies of the ordered phases based on the bcc lattice were obtained using first-principle band-energy calculations. The cluster expansion method was applied to the results, and the free energies at finite temperatures were calculated for the bcc solid solution. The Co-Al and Ni-Al binary systems were analysed thermodynamically by considering the estimated metastable free energy of the bcc phase. The descriptions of the lattice stability parameters for each pure element were obtained chiefly from the Scientific Group Thermodata Europe (SGTE) datafile. The optimized parameters reasonably reproduced the characteristic features of these binary phase diagrams. The metastable (A2+B2) two-phase field forms in the Co-Al phase diagram, and this equilibrium is closely related to the anomaly in the phase boundaries of the binary system. On the other hand, the phase separation of the A2 and B2 structures are hindered by the presence of the D03phase in the Ni-Al system. Ground state analysis was performed to clarify the difference in the behaviour of the B2 phase. (Received November 20, 2003; Accepted February 3, 2004)
Keywords: phase diagram, thermodynamic analysis, ab initio energetic calculations, metastable phase separation, order-disorder transition
1. Introduction
Various changes in the physical properties of alloys are indirectly reflected in the equilibrium phase diagrams. For example, it is well known that a magnetic transition is manifested in an abnormal behaviour at the phase boundaries in some alloy systems. The phase boundaries in the Co-Al binary system may be classified as such a category. The Co-Al phase diagram consists of liquid, two fcc solid solutions
(Co) and (Al), hcp Co ("),with CsCl structure, and the intermetallic phases Co2Al5, CoAl3, Co4Al13, and Co2Al9. There exist one eutectic reaction concerning the liquid phase and six invariant reactions between the solid phases. The B2 () phase has a large homogeneity range at higher temper-atures, but the range decreases remarkably in the lower temperature region. It has been confirmed experimentally that the two-phase region for the A1 ()/B2 () phases extends over a wide composition range with decreasing temperature.1)Owing to a sudden drop in the homogeneous region, these experimental values are debatable, and are not adopted in the assessment of the binary phase diagrams.2) This judgement originates in the unusual shape of the phase boundary. Our preliminary analysis has shown that a phase separation, accompanied by an order-disorder transition of the B2 phase, plays an essential role in the anomaly at the phase boundary.
The Ni-Al binary system has almost the same phase constitutions as the Co-Al system. The system is composed of liquid, two fcc solid solutions(Ni) and(Al),with CsCl structure, and the intermetallic phases L12 (0), Ni5Al3, Ni2Al3, NiAl3. However, the features of the two phase diagrams are quite different, as shown in Fig. 1. In Fig. 1, the stable0phase (L1
2structure) is omitted in the Ni-Al binary system to allow for a direct comparison with the Co-Al system. Although the presence of an order-disorder transition of the bcc structure is known, the phase equilibria for the A1 ()/B2 () composition appears differently for the two binary
systems.
Thus, in the present study, the difference in the behaviour of the B2 structure in the Co-Al and Ni-Al binary systems was studied using a thermodynamic analysis incorporatingab initioenergetic calculations. Furthermore, the phase separa-tion of the B2 structure is discussed in connecsepara-tion with the interaction energies between unlike atoms.
2. Calculation Procedures
2.1 Ab initiocalculations of the Gibbs free energy
To clarify the thermodynamic properties of the bcc-based structure over the entire composition range, the formation energy was estimated by incorporating band-energy calcu-lations using the cluster variation method. An outline for deriving the Gibbs free energies of the bcc-based structures is described as follows.
First, a set of superstructures {A-A2, A3B-D03, AB-B2, AB-B32, AB3-D03, and B-A2} was selected to be represen-tative of a series of bcc-based ordered phases. The total energies were calculated using the WIEN2k3) software package, based on the Full Potential Linearized Augmented Plane Wave (FLAPW) method within the generalized gradient approximation (GGA).4) Muffin-tin radii of 2.0 au
(0.106 nm) for Co, Ni, and Al were assumed, and RKmaxwas
fixed at 9.0, which almost corresponds to the 20 Ry (270 eV) cut-off energy.
With the total energies known, the formation energy of the bcc-based superstructures,Eform, was defined by averaging the total energy of the elements with chemical compositions up to the segregation limit, as follows:
EformðaÞ ¼EtotðaÞ x
ME bccM tot ðaÞ
ð1xAlÞEtotbccAlðaÞ; ð1Þ
wheredenotes the type of superstructure andais the lattice constant. M denotes an element, Co or Ni.
The resultant formation energy can be further fitted using a
Special Issue on Advances in Computational Materials Science and Engineering III
Lennard–Jones type potential function, as shown in eq. (2).
Eform ðaÞ ¼ p
a 2n
q
a
n
þr ð2Þ
Here, the exponentn¼3:5is used to reproduceEform to the highest accuracy.
Then, the effective cluster interaction energies,fviðaÞg, can
be extracted from these formation energies using the Cluster Expansion Method (CEM) developed by Connolly and Williams.5) This leads to a set of composition-independent
parameters from which, the energy of the set of super-structures can be reproduced in terms of a set of correlation functionsfig
Eform ðaÞ ¼X
i¼0
viðaÞ
i; ð3Þ
where,viðaÞis the effective interaction energy of thei-point
cluster, andi is the correlation function for clusteriin the phase .i is defined as the ensemble average of the spin operator,ðpÞ, which takes values of1, depending on the atomic occupancy of the lattice site,p. The values ofi for the superstructures considered in this study are summarized in Table 1.
The upper limit of the summation in eq. (3),, specifies the largest cluster participating in the expansion. In this study, we considered a tetrahedron as being the largest cluster. Since in the bcc structure the tetrahedron is an irregular shape that
contains both the first- and second-nearest neighbour dis-tances, the second pair interactions are also taken into account, which leads to the consequence that mathematically, five should represent six types of cluster.
From Table 1, it can be seen that figis a regular66
matrix. Then, the matrix inversion of eq. (3) yields the effective interaction energies
viðaÞ ¼
X5
i¼0
ðiÞ1EformðaÞ: ð4Þ
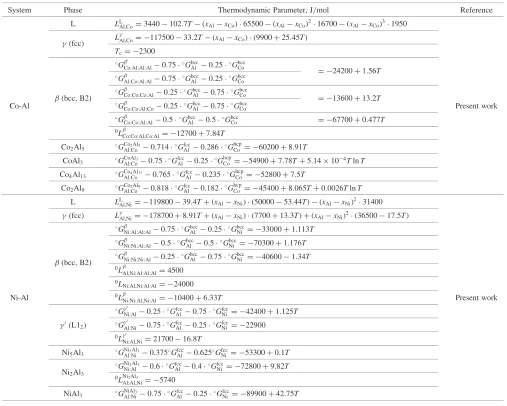
The formation energies to the segregation limit for the Co-Al and Ni-Co-Al systems in the D03, B2, B32, and A2 structures in the ground state are summarized in Table 2. The Gibbs free energies of the metastable bcc-based phase in the Co-Al and the Ni-Al binary systems were evaluated using the effective cluster interaction energies up to the tetrahedron cluster, including the second pair interactions
E¼X
5
i¼0
vii: ð5Þ
At a finite temperature,T, the free energy of a phase of interest,G, can be obtained by adding the configurational entropy term,S, to the internal energy, as follows6,7) 600
800 1000 1200 1400 1600 1800 2000
20 40 60 80
Co
Al
γ(Co)
β
L
γ(Al)
ε(hcp)
600 800 1000 1200 1400 1600 1800 2000
20 40 60 80
Al
Ni
γ(Ni)
β
L
γ(Al)
Al (mol%) Al (mol%)
T
e
mperature
,
T
/ K
T
e
mperature
,
T
/ K
γ
'
NiAl
3
Ni
2
Al
3
Co
2
Al5
CoAl
3
Co
4
Al
13
Co
2
Al
9
[image:2.595.85.512.73.269.2]Fig. 1 Characteristic features of the phase equilibria for the A1 ()/B2 () phases in the Co-Al and Ni-Al binary systems. The stable0 phase (with the L12structure) is omitted in the Ni-Al binary system.
Table 1 Values ofi for the tetrahedron cluster.
Ordered
0
1 2 3 4 5
structures point n.n.pair n.n.n.pair triangle tetrahedron
A-bcc 1 1 1 1 1 1
A3B-D03 1 1/2 0 1 1 1
AB-B2 1 0 1 1 1 1
AB-B32 1 0 0 1 0 1
AB3-D03 1 1=2 0 1 1 1
[image:2.595.305.549.652.787.2]B-bcc 1 1 1 1 1 1
Table 2 Formation energies to the segregation limit for Co-Al and Ni-Al in the D03, B2, B32, and A2 structures in the ground state.
Alloy system Molar fraction of Al Structure Formation energy (kJ/mol)
0.25 D03 12:7
Co-Al 0.5 B2 62:3
B32 23:7
0.75 D03 18:3
0.25 D03 40:7
Ni-Al 0.5 B2 69:5
B32 34:0
[image:2.595.46.291.675.785.2]G¼ETS: ð6Þ
We used the cluster variation method (CVM) with the tetrahedron approximation to calculate the configurational entropy. For the bcc-structure, the entropy formula is
S¼kBln
Q
i;j;k
ðNzijkÞ!
( )12
Q i
ðNxiÞ!
Q
i;j;k;l
ðNwijklÞ!
( )6
Q
i;j
ðNyijÞ!
( )4
Q
i;j
ðNyijÞ!
( )3;
ð7Þ
wherexi;yij;yij;zijk andwijkl are the cluster probabilities of
finding the atomic configurations specified by the subscript(s) at a point, the nearest neighbour pair, the second-nearest neighbour pair, a triangle cluster, and a tetrahedron cluster, respectively, andN is the number of lattice points.
By minimizing the grand potential with respect to all the correlation functions, the Gibbs energy of mixing can be obtained as a function of composition at a constant temper-ature,T.
2.2 Thermodynamic models
The Co-Al binary system is composed of the liquid (L), fcc ( Co, Al), B2 (), hcp ("Co), Co2Al5, CoAl3, Co4Al13, and Co2Al9 phases. On the other hand, the Ni-Al binary system consists of the liquid (L), fcc (Ni,Al), L12(0), B2 (), Ni5Al3, Ni2Al3, and NiAl3 phases.
The B2 structure () in the Co-Al and Ni-Al binary systems exhibits a range of non-stoichiometric alloys, and it was modelled using a multi-sublattice model,8)by
consider-ing its orderconsider-ing behaviour. The general formula of the model was
Al1 M1
y1
Al y1M !
u1
Al2 M2
y2
Al y2M !
u2
: ð8Þ
M denotes Co or Ni in eq. (8). The subscriptsu1,u2. . .are the numbers of the sublattice sites that are within the brackets, and Al1, M1. . .and Al2, M2. . .denote the elements in the corresponding sublattice sites. The quantitiesy1
i andy
2
j
are the site fractions of the elementsiandjin their respective sublattice, designated by the numbers 1 and 2. If the relationship u1þu2 ¼1 holds, then the thermodynamic quantities are referring to one mole of the sites. For each sublattice,s, the site fraction of speciesiis equal to
ysi ¼nsi=X j
nsj ¼nsi=ns with X
k
nsk¼ns and X
s
ns¼n; ð9Þ
wherens
jis the number of speciesjin sublattices,nsis the number of sites in sublattices, andnis the total number of sites. The
quantityns is related tonbyns¼nðus=ðu1þu2þ ÞÞ.
Thephase was described using a four-sublattice model, so as to reflect the results of theab initiocalculations on the phase diagram computation as follows:
Al1 M1
y1
Al y
1
M !
0:25
Al2 M2
y2
Al y
2
M !
0:25
Al3 M3
y3
Al y
3
M !
0:25
Al4 M4
y4
Al y
4
M !
0:25
: ð10Þ
The number of each sublattice site is 0.25, and the four sites are therefore equivalent. The disordered state is described when the site fractions of the different species are the same in the four sublattices. For the ordered structures, if two sublattices have the same site fractions, as do the two others, but are different, then the model describes the B2 and B32 phases. If three sublattices have the same site fractions, and are different from the fourth, then D03ordering is described.
The Gibbs energy of the phase is expressed by the following equation:
Gm¼
X
i X
j X
k X
l
y1iy2jy3ky4lGi:j:k:l
þRT 4
X4
s¼1
X
i
ysilnðysiÞ
þX
4
s¼1
X
i X
j>i
X
k X
l X
m
ysiysjyrkytlyumLi;j:k:l:m; ð11Þ
whereGi:j:k:ldenotes the Gibbs energy of a compoundijkl,
and terms relative to the same stoichiometry are identical, whatever the occupation of the sublattice. Li;j:k:l:m is the
interaction parameter between unlike atoms on the same
sublattice.
The following regular solution approximation was applied to the disordered fcc (Co,Ni,Al), hcp ("Co), and liquid phases
Gm ¼xAlGAlþxMGM
þRTðxAllnxAlþxMlnxMÞ þxAlxML
Al,MþGmag;
ð12Þ
whereGi denotes the Gibbs energy of elementi in the
phase. This quantity is called the lattice stability parameter, and is described by the formula
G
i
Href
i ¼AþBTþCTlnTþDT
2
þET3þFT7þIT1þJT9; ð13Þ
whereHref
i denotes the enthalpy of the pure elementiin its
stable state at 298.15 K. The parameter LAl,M denotes the interaction energy between Al and M, and has a composi-tional dependency following the Redlich–Kister polynomial as
LAl,M¼0LAl,Mþ ðxAlxMÞ 1L
Al,M þ ðxAlxMÞ22L
Al,M:
ð14Þ
The magnetic contribution to the Gibbs free energy,Gmag,
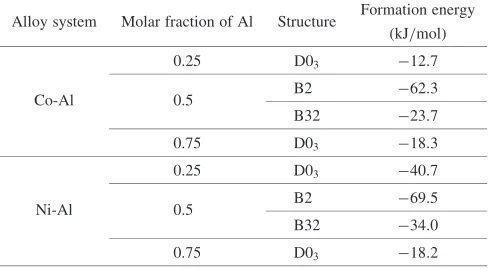
Gmag ¼RTfðÞlnðþ1Þ; ð15Þ
where
fðÞ ¼11
A
( 791
140p þ
474 497
1
p1
3
6 þ 9 135þ
15 600
)
; for <1
ð16Þ
and
fðÞ ¼ 1
A
5
10 þ 15
315 þ 25
1500
; for 1; ð17Þ
and
A¼ 518
1125þ 11692 15975
1
p1
: ð18Þ
The variableis defined asT=Tc, where TC is the Curie
temperature andis the mean atomic moment expressed in Bohr magnetons,B. The value ofpdepends on the structure,
andp¼0:28for the fcc phase.
The L12 (0) phase in the Ni-Al system is an ordered structure based on the fcc phase. Therefore, it is also possible to treat the =0 equilibrium as an order-disorder transition.
However, to avoid a complication of the parameters, a different thermodynamic model was applied to the0phase,
and the Gibbs energy was represented using the two-sublattice model as
Al1 Ni1
y1
Al y
1
Ni !
0:75
Al2 Ni2
y2
Al y
2
Ni !
0:25 :
The Gibbs energy for one mole of the phase is given by the following equation.
Gm¼y1Aly
2
Al
G0
Al:Alþy
1
Aly
2
Ni
G0
Al:Niþy
1
Niy
2
Al
G0
Ni:Al þy1Niy2NiGNi:Ni0 þRT0:75 ðy1Allny1Alþy1Nilny1NiÞ þ0:25 ðy2Allny2Alþy2Nilny2NiÞþy1Aly2Aly2NiLAl:Al,Ni0
þy1Niy2Aly2NiLNi:Al,Ni0 þy1Aly1Niy2AlLAl,Ni:Al0
þy1Aly1Niy2NiLAl,Ni:Ni0 ð19Þ
Ni2Al3 is an intermetallic compound with an extension away from stoichiometry to the Al-rich side. The two-sublattice model given by
Al1 Ni1
y1
Al y
1
Ni !
0:4 Al2
y2
Al !
0:6 :
was applied, consideringy2
Al¼1.
Gm¼y1Al
GNi2Al3
Al:Al þy
1
Ni
GNi2Al3
Ni:Al
þRTðy1Allny1Alþy1Nilny1NiÞ þy1Aly1NiLNi2Al3
Al,Ni:Al ð20Þ
The Co2Al5, CoAl3, Co4Al13, and Co2Al9phases, as well as the Ni5Al3and NiAl3phases, with nil homogeneity ranges were treated as stoichiometric compounds.
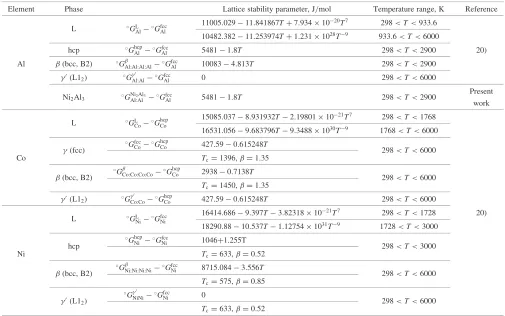
Thermodynamic parameters of the Co-Al binary and Ni-Al systems were derived by analysing the reported experimental data and the free energies of the bcc structure derived by the
procedures described in Section 2.1. In the actual optimiza-tion process, the parameters for the bcc phase were first evaluated at 1000 and 2000 K using band-energy calcula-tions, and subsequently, the parameters for the other phases were obtained from the experimental data on the phase boundaries and thermochemical properties. Finally, all the parameters were optimized simultaneously, and a set of parameters that mostly agreed well with the experimental data was obtained.
3. Results and Discussion
3.1 Thermodynamic analysis of the Co-Al and Ni-Al systems
3.1.1 Co-Al binary system
According to the critical assessments of McAlister9)and Dupin and Ansara,10) there exist one eutectic reaction
concerning the liquid phase and six invariant reactions between the solid phases. The peritectic reactions of Co2Al5, CoAl3, Co4Al13, and Co2Al9 were determined by thermal analysis and metallographic studies,11)and there were small
discrepancies within experimental error. Several liquidus studies using melt analysis as well as thermal analysis have been reported, and the experimental data11–16)were adopted
in this analysis. The B2 () phase that formed congruently from the melt at an almost equiatomic composition has a homogeneity range extending from 22%Al to almost 50%Al at higher temperatures, but the range decreases remarkably in the lower temperature region. The phase boundary on the Co-rich side has been studied metallographically and using X-ray diffraction,14) EPMA,17) electromotive force
measure-ments,18) lattice constant measurements,19) and EPMA and
lattice parameter measurements.1) The present analysis
attempted to reproduce the experimental data of Takayama et al.,1) which locates the phase boundary nearest to the
stoichiometric composition among the above measurement values.
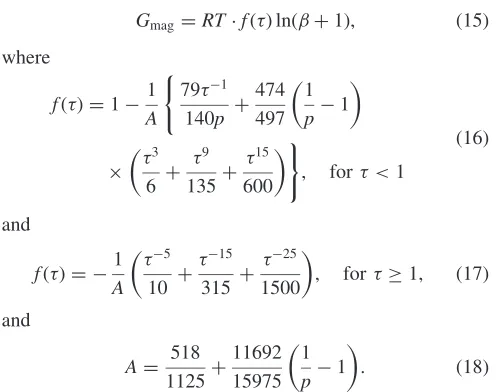
[image:4.595.46.294.72.268.2]The descriptions of the lattice stability parameters for each pure element were obtained chiefly from the Scientific Group Thermodata Europe (SGTE) data file,20) and are shown in
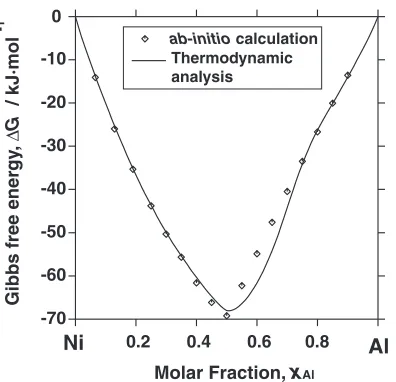
Table 3. The evaluated parameters for the Co-Al binary system are shown in Table 4. The calculated Gibbs free energy of the bcc phases at 1000 K was compared with the results from theab initioenergetic calculations in Fig. 2. The calculated Co-Al binary phase diagram is compared with the experimental data1,12–15,21,22) in Fig. 3. The characteristic
features of the binary phase diagram are well reproduced by the calculations. The dotted line shows the metastable two-phase separated region between the A2 (bcc Co) and the B2 () phases.
3.1.2 Ni-Al binary system
With regard to this binary system, a large number of experimental data have been reported, and a critical assess-ment has been carried out by Nashet al.23)The liquidus lines
58%Al, and it melts congruently at 1911 K. The phase boundary of the B2 ()/L12 (0) composition was initially established using electron probe microanalysis.21,24,26)On the
other hand, a slight difference in the experimental data can be seen for the phase boundary of the B2 ()/Ni2Al3phase, and the results obtained by X-ray and the microstructure observation24) are usually referred. Although the phase
boundary of Ni5Al3 has not been clarified, an approximate position has been derived.27,28)The Ni phase dissolves Al up to 21.2% at the Ni-rich eutectic temperature of 1658 K.24) Since the L12(0) phase is an ordered structure based on the fcc structure, there is some scatter in the experimental data originating in the coherency with theNi matrix. Nashet al. adopted this experimental data,24,29) among the several
reported values, and we have also adopted this strategy. With regard to the thermodynamic properties, the enthalpy of formation of each of the solid phases has been evaluated,30)
and the mixing enthalpy of the liquid phase has been reported.31)In addition, the enthalpies of formation of the0,
Ni2Al3, NiAl3phases have been reported.32)Thermodynamic analysis of this binary system has been carried out by several researchers,33–36)and even an attempt to calculate the phase diagram by applying the first-principle method has been carried out.37)
The procedure used in our thermodynamic analysis was the same as used for the Co-Al binary. The evaluated thermodynamic parameters based on the experimental data are given in Table 4. The calculated Gibbs free energy of the bcc phase is compared with the results of the ab initio energetic calculations in Fig. 4. The calculated Ni-Al binary
phase diagram is compared with the experimental da-ta24–26,28,38–42)in Fig. 5.
3.2 Effect of the phase separation of the B2 structure on the phase boundaries
A thermodynamic analysis of the Co-Al system shows the occurrence of the metastable (A2 + B2) two-phase region in the Co-rich side of the phase diagram, as can be seen in Fig. 3. The two-phase separation, based on the bcc structure, closely relates the anomaly in the phase boundaries in the Co-Al binary system. This situation is schematically illustrated in Fig. 6, where the Gibbs free energies of the B2 () and the A1 ( Co) phases are drawn. The two-phase separation of the
phase does not occur at higher temperatures, T1, mainly owing to the effect of the entropy of random mixing on the atomic arrangement. On the other hand, the tendency towards ordering becomes stronger at lower temperatures,T2. In the B2 structure, the interaction between unlike atoms strength-ens around the 50%Al composition, since the degree of order reaches a maximum at the equiatomic composition. The decrease in the enthalpy term due to the attractive interaction results in the acute point in the free energy curve in the vicinity of the 50%Al composition, and consequently, a two-phase separation in thephase forms. This situation yields a significant shift of the phase boundary for the ( Co +)/
composition to the equiatomic composition.
3.3 Effective interaction energies of clusters
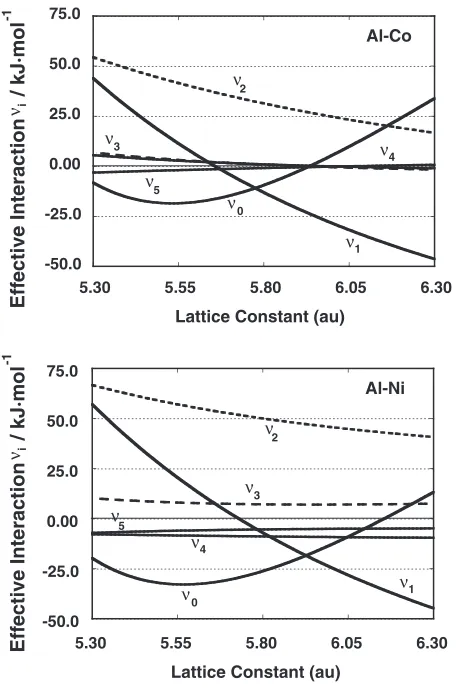
The variation in the effective interaction energy, viðaÞ,
[image:5.595.45.550.83.399.2]with the lattice constant calculated using eq. (4) is shown in
Table 3 Lattice stability parameters for Al, Co, and Ni.
Element Phase Lattice stability parameter, J/mol Temperature range, K Reference
L GL
Al Gfcc
Al
11005:02911:841867Tþ7:9341020T7 298<T<933:6
10482:38211:253974Tþ1:2311028T9 933:6<T<6000
hcp Ghcp
Al Gfcc
Al 54811:8T 298<T<2900 20)
Al (bcc, B2) G Al:Al:Al:Al
Gfcc
Al 100834:813T 298<T<2900
0(L1
2) G
0
Al:AlGfccAl 0 298<T<6000
Ni2Al3 GNiAl:Al2Al3 Gfcc
Al 54811:8T 298<T<2900
Present work
L GL
CoG hcp Co
15085:0378:931932T2:198011021T7 298<T<1768
16531:0569:683796T9:34881030T9 1768<T<6000
(fcc)
Gfcc CoG
hcp
Co 427:590:615248T 298<T<6000
Co Tc¼1396,¼1:35
(bcc, B2) G
Co:Co:Co:CoG hcp
Co 29380:7138T 298<T<6000
Tc¼1450,¼1:35
0(L1
2) G
0
Co:CoG hcp
Co 427:590:615248T 298<T<6000
L GL
Ni Gfcc
Ni
16414:6869:397T3:823181021T7 298<T<1728 20)
18290:8810:537T1:127541031T9 1728<T<3000
hcp
Ghcp
Ni GfccNi 1046+1.255T 298<T<3000
Ni Tc¼633,¼0:52
(bcc, B2)
G
Ni:Ni:Ni:NiGfccNi 8715:0843:556T 298<T<6000
Tc¼575,¼0:85
0(L1
2)
G0
NiNiGfccNi 0 298<T<6000
Table 4 The optimized thermodynamic parameters for the Co-Al and Ni-Al binary systems.
System Phase Thermodynamic Parameter, J/mol Reference
L LL
Al,Co¼3440102:7T ðxAlxCoÞ 65500 ðxAlxCoÞ216700 ðxAlxCoÞ31950
(fcc) L
Al,Co¼ 11750033:2T ðxAlxCoÞ ð9900þ25:45TÞ
Tc¼ 2300
G0
Co:Al:Al:Al0:75 Gbcc
Al 0:25 Gbcc
Co ¼ 24200þ1:56T
G
Al:Co:Al:Al0:75GAlbcc0:25GbccCo
(bcc, B2)
G
Co:Co:Co:Al0:25 Gbcc
Al 0:75 Gbcc
Co ¼ 13600þ13:2T
Co-Al G
Co:Co:Al:Co0:25GbccAl 0:75GbccCo Present work G
Co:Co:Al:Al0:5 Gbcc
Al 0:5 Gbcc
Co ¼ 67700þ0:477T
0L
Co:Co:Al,Co:Al¼ 12700þ7:84T Co2Al5 GCoAl:Co2Al50:714
Gfcc Al0:286
Ghcp
Co ¼ 60200þ8:91T CoAl3 GCoAlAl:Co30:75GfccAl 0:25G
hcp
Co ¼ 54900þ7:78Tþ5:14104TlnT Co4Al13 GCoAl:Co4Al130:765
Gfcc Al0:235
Ghcp
Co ¼ 52800þ7:5T Co2Al9 GCoAl:Co2Al90:818
Gfcc
Al0:182G hcp
Co ¼ 45400þ8:065Tþ0:0026TlnT
L LL
Al,Ni¼ 11980039:4Tþ ðxAlxNiÞ ð5000053:44TÞ ðxAlxNiÞ231400
(fcc) LAl,Ni¼ 178700þ8:91Tþ ðxAlxNiÞ ð7700þ13:3TÞ þ ðxAlxNiÞ2 ð3650017:5TÞ G
Ni:Al:Al:Al0:75GbccAl 0:25GbccNi ¼ 33000þ1:113T G
Ni:Ni:Al:Al0:5 Gbcc
Al 0:5 Gbcc
Ni ¼ 70300þ1:176T
(bcc, B2)
G
Ni:Ni:Ni:Al0:25GbccAl 0:75GbccNi ¼ 406001:34T 0L
Al,Ni:Al:Al:Al¼4500 0L
Ni:Al,Ni:Al:Al¼ 24000
Ni-Al 0L
Ni:Ni:Al,Ni:Al¼ 10400þ6:33T Present work
G0
Ni:Al0:25 Gfcc
Al0:75GfccNi ¼ 42400þ1:125T
0(L1
2) G
0
Al:Ni0:75 Gfcc
Al0:25 Gfcc
Ni ¼ 22900 0L0
Ni:Al,Ni¼2170016:8T
Ni5Al3 GAl:NiNi5Al30:375GfccAl0:625GfccNi ¼ 53300þ0:1T Ni2Al3
GNi2Al3
Ni:Al 0:6 Gfcc
Al 0:4 Gfcc
Ni ¼ 72800þ9:82T 0LNi2Al3
Al:Al,Ni¼ 5740 NiAl3 GNiAlAl:Ni30:75
Gfcc Al 0:25
Gfcc
Ni ¼ 89900þ42:75T
0.2 0.4 0.6 0.8
-70 -60 -50 -40 -30 -20 -10 0
Gibbs free ener
gy
,
∆
G
/ kJ·mol
-1
Molar Fraction, xAl
Co Al
ab-initio calculation Thermodynamic analysis
Fig. 2 The calculated Gibbs free energy of the bcc phase in the Co-Al binary system at 1000 K compared with the results from theab initio
energetic calculations.
400 600 800 1000 1200 1400 1600 1800 2000
20 40 60 80
Gwyer Fink
Takayama Koester
Schramm
Ettenberg
Co
Al
β
γ(Co)
L
ε Co
2
Al5
CoAl
3
Co
4
Al
13
Co
2
Al9
γ(Al)
Al (mol%)
T
emperature
,
T
/ K
[image:6.595.305.548.535.735.2] [image:6.595.72.272.537.724.2]Fig. 7. The positive numbers define the attractive force working between unlike atoms. The i-point effective inter-action energy at the equilibrium lattice constant in these two binary systems can be compared using the data in Table 5. The equilibrium lattice constant of the B2 structure was 5.38 au (0.285 nm) for the Co-Al system, and 5.46 au (0.289 nm) for the Ni-Al system. There seems to be no remarkable difference in these values between the two binary systems.
Ino43)proposed a pairwise interaction model to explain the coexistence of the ordering and the phase separation. This model requires an attractive first-nearest neighbour interaction and a repulsive next nearest neighbour interaction. However, the sign of the interaction energies may not play an essential role in the systems under investigation in this study, since both parameters show positive numbers in the binary systems.
3.4 Origin of the different behaviour of the B2 phase in the Co-Al and Ni-Al systems
The formation energies to the segregation limit for Co-Al and Ni-Al in the D03, B2, B32, and A2 structures in the ground state, as listed in Table 2, are plotted versus Al concentration in Fig. 8. In comparing the two systems, it can be seen that in the Co-Al system, the energy of the D03 structure at the 25%Al composition is located slightly above the straight line connecting the energy values at the 0%Al and 50%Al compositions, which results in a two-phase separation of the A2 (bcc Co) and B2 () structures in Co-Al that is more stable than the formation of the Co3Al-D03 structure in the ground state. On the other hand, the energy plot of the Ni-Al system shows the stabilization of the Ni3Al-D03 structure compared with the two-phase separation of the A2 (bcc Ni) and B2 () structures, since the formation energy of the D03 Gγ
Gβ
Gγ
Gβ
Τ=Τ1 Τ=Τ1
Τ=Τ2
Τ=Τ2
400 600 800 1000 1200 1400 1600 1800 2000
20 40 60 80
Co
Al
β
γ(Co)
ε
Al (mol%) Al (mol%)
Gibbs free ener
gy
Gibbs free ener
gy
T
e
mperature
,
T
/ K
Fig. 6 The schematic Gibbs free energies of the B2 () and A2 (Co) phases in the Co-Al system.
400 600 800 1000 1200 1400 1600 1800 2000
20 40 60 80
Alexander
Verhoeven Jia Hilpert Taylor Fink
Phillips
Robertson Nash
Ni Al
L
β
γ(Ni)
γ'
NiAl
3
Ni
2
Al3
Ni
5
Al3
γ(Al)
Al (mol%)
T
e
mperature
,
T
/ K
Fig. 5 A comparison of the calculated Ni-Al binary phase diagram with previous work.
-70 -60 -50 -40 -30 -20 -10 0
0.2 0.4 0.6 0.8
Ni Al
ab-initio calculation Thermodynamic analysis
Molar Fraction, xAl
Gibbs free ener
gy
,
∆
G
/ kJ·mol
-1
[image:7.595.73.271.71.262.2] [image:7.595.305.547.71.267.2] [image:7.595.117.483.332.555.2]phase is lower than the straight line connecting the energy values at the 0%Al and 50%Al compositions. This energetic analysis suggests that a two-phase separation of the bcc-Co and B2 () phases occurs on the Co rich side in Co-Al system, while such a separation is not realized in the Ni-Al system.
Figure 9 shows the density of states (DOS) of the B2 () structure in the Co-Al and Ni-Al alloy systems. In Fig. 9,Ef
denotes the Fermi energy, where no electrons occupy the
electronic states above this energy level. It can be seen that the distribution of the DOS of the B2 phase in the two systems is similar, with both showing a low DOS at the Fermi level. However, when observing the DOS of the D03 phase for theses two systems, as shown in Fig. 10, we observe a marked difference between these two systems, in that the Fermi level is located near the peak of the DOS for the Co3Al-D03 phase but decreases in a region with a very low DOS in the Ni3Al-D03phase. This fact indicates that, from an energetic point of view, the stable D03structure of the Ni3Al phase is highly preferred, while in the Co3Al-D03 phase is unstable with respect to separation of the A2 and B2 phases in the Co-Al system.
This difference in the density of states at the Fermi level might be considered to be the result of the extra d-electron in Ni versus Co. From the point of view of the rigid band approximation,44)this difference in the number of electrons for two neighbouring elements shifts the Fermi level towards the higher energy side in the Ni-Al system versus the Co-Al system. This raises the different relative positions of the Fermi level in the DOS curve, which consequently leads to the different structural stabilities.
The ground state analysis of the Ni-Al system suggests that the phase separation concerning the D03 structure forms at absolute zero. When assuming that such a two-phase separation forms at a finite temperature, however, the agreement between the calculated phase boundaries and experimental data is insufficient. For example, Fig. 11 shows the phase diagram in the case that a two-phase separation between the metastable D03and B2 structures occurs around
-80 -70 -60 -50 -40 -30 -20 -10 0 10
0.2 0.4 0.6 0.8
Formation ener
gy
,
∆
E
/ kJ·mol
-1
Co Al 0.2 0.4 0.6 0.8
-80 -70 -60 -50 -40 -30 -20 -10 0 10
Ni Al
CoAl-B2 Co3Al-D03
CoAl-B32
CoAl3-D03 Co-bcc Al-bcc
NiAl-B2 Ni3Al-D03
NiAl-B32 NiAl3-D03 Ni-bcc Al-bcc
Molar Fraction, xAl Molar Fraction, xAl
Fig. 8 Variation of the formation energies to the segregation limit for Co-Al and Ni-Al with concentration of Al.
Table 5 Effective interaction energy of the B2 structure at the equilibrium lattice constant for the Co-Al and Ni-Al binary systems.
Effective cluster Co-Al Ni-Al interaction (kJ/mol) (kJ/mol)
v1 15.6 33.9
v2 52.5 63.2
v3 5.7 9.1
v4 4.8 8:6
v5 2:9 6:6
Al-Co
4
1 2
3
ν ν
ν ν
ν
ν5
0
-50.0 -25.0 0.00 25.0 50.0 75.0
-50.0 -25.0 0.00 25.0 50.0 75.0
5.30 5.55 5.80 6.05 6.30
Lattice Constant (au)
5.30 5.55 5.80 6.05 6.30
Lattice Constant (au) Al-Ni
4
1 2
3
ν ν
ν ν
ν
ν5
0
νi
Eff
ective Interaction / kJ·mol
-1
νi
Eff
ective Interaction / kJ·mol
-1
Fig. 7 Variation of the effective interaction energy,vi, of the Co-Al and
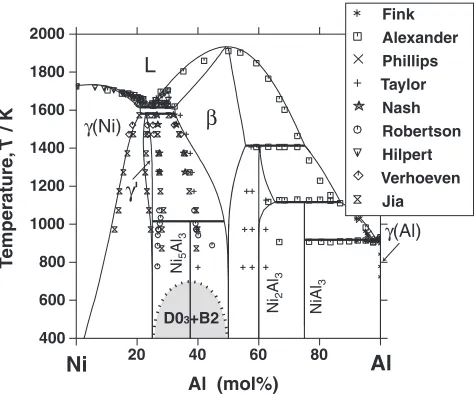
[image:8.595.303.549.95.182.2] [image:8.595.112.488.583.768.2]773 K. The homogeneity range of the B2 single phase is comparatively reduced owing to the influence of the metastable miscibility gap with decreasing temperature, and accordingly, the calculated phase boundaries deviate from the experimental data. Therefore, the phase separation of the D03structure is not likely in the experimentally observable
temperature range.
4. Conclusions
The phase separation behaviour of the B2 structure in the Co-Al and Ni-Al binary systems was studied using first-principle band-energy calculation and thermodynamic analy-sis, yielding the following results.
(1) The Co-Al and Ni-Al binary systems were analysed thermodynamically by considering the free energy of the bcc phase estimated fromab initiocalculations. The optimized parameters reasonably reproduced the char-acteristic features of these binary phase diagrams. The metastable (A2 + B2) two-phase field forms in the Co-Al binary system, and this metastable equilibrium relates closely to the anomaly seen in the phase boundaries in this system. On the other hand, the phase separation of the A2 and B2 structures is not likely in the Ni-Al system.
(2) The effective interaction energies for clusters were obtained using ab initiocalculations on the formation energies for the bcc-based ordered structures. However, there seems to be no marked difference in the values between these two binary systems.
(3) Ground state analysis showed that the D03 structure forms in the Ni-Al system, while two-phase separation between the ordered B2 and the disordered A2 phase occurs in the Co-Al system. The difference in the 400
600 800 1000 1200 1400 1600 1800 2000
20 40 60 80
Ni
Al
L
β
γ(Ni)
γ'
γ(Al)
D03+B2
Alexander
Verhoeven Jia Hilpert Taylor Fink
Phillips
Robertson Nash
Al (mol%)
T
emperature
,
T
/ K
NiAl
3
Ni
2
Al
3
Ni
5
Al
[image:9.595.190.526.71.399.2]3
Fig. 11 The calculated Ni-Al phase diagram assuming that the critical temperature of the two-phase separation between the metastable D03and B2 structures was around 773 K.
0 5 10 15 20 25
-20 -15 -10 -5 0 5
-20 -15 -10 -5 0 5
0 5 10 15 20 25 30 35
Co3Al (D03)
Ni3Al (D03)
Energy, E / eV Energy, E / eV
To
tal density of stat
e
To
tal density of stat
e
Ef
[image:9.595.67.403.71.394.2]Ef
Fig. 10 The density of states of the D03structure in the Co-Al and Ni-Al alloy systems.
0 2 4 6 8
-16 -14 -12 -10 -8 -6 -4 -2 0 2 4 CoAl(B2)
0 2 4 6 8 10 12
-16 -14 -12 -10 -8 -6 -4 -2 0 2 4 NiAl(B2)
Energy, E / eV Energy, E / eV
To
tal density of state
To
tal density of state
Ef
Ef
[image:9.595.51.288.454.651.2]stability of the D03 phase in these binary systems corresponds to a difference in the number of d electrons between Co and Ni.
Acknowledgments
The authors are grateful to Prof. Tetsuo Mohri, Hokkaido University, and Prof. Marcel Sluiter, Tohoku University, for helpful discussions about the CVM calculations.
REFERENCES
1) T. Takayama, M. Y. Wey and T. Nishizawa: Trans. Japan Inst. Metals
22(1981) 315–325.
2) A. J. McAlister:Binary Alloy Phase Diagrams, ed. T. B. Massalski, H. Okamoto, P. R. Subramanian and L. Kacprzak, (ASM International, Materials Park, OH, USA, 1990) 136–138.
3) P. Blaha, K. Schwarz, G. K. H. Madsen, D. Kvasnicka and J. Luiz: WIEN2k, An Augmented Plane Wave + Local Orbitals Program for Calculating Crystal Properties (Karlheinz Schwarz, Tchn. Universita¨t Wien, Austria), 2001, ISBN 3-9501031-1-2.
4) J. P. Perdew, K. Burke and Y. Wang: Phys. Rev. B54(1996) 16533– 16539.
5) J. W. D. Connolly and A. R. Williams: Phys. Rev. B27(1983) 5169– 5172.
6) M. H. F. Sluiter, Y. Watanabe, D. de Fontaine and Y. Kawazoe: Phys. Rev. B53(1996) 6137–6151.
7) Y. Chen, S. Iwata and T. Mohri: Calphad,26(2002) 583–589. 8) M. Hillert and L.-I. Staffansson: Acta Chem. Scand.24(1970) 3618–
3626.
9) A. J. McAlister: Bull. Alloy Phase Diagrams10(1989) 646–650. 10) N. Dupin and I. Ansara: La Revue de Me´tallurgie-CIT/Science et
Ge´nie des Mate´riaux, Sep.(1998), 1121–1129. 11) T. Goedecke: Z. Metallkd.62(1971) 842–843. 12) A. G. C. Gwyer: Z. Anorg. Chem.57(1908) 113–153. 13) W. Ko¨ster: Arch. Eisenhu¨tten.7(1933) 263–264. 14) J. Schramm: Z. Metallkd.33(1941) 381–387.
15) W. L. Fink and H. R. Freche: Trans. AIME99(1932) 141–148. 16) G. V. Raynor and P. C. L. Pfeil: J. Inst. Metals73(1947) 609–624.
17) H. E. Cline: Trans. Metall. Soc. AIME239(1967) 1906–1916. 18) A. A. Vecher, V. M. Es’kov and V. V. Samokhval: Izv. Akad Nauk,
SSSR Met. (4) (1975) 87–89.
19) Ya. I. Dutchak and V. G. Chekh: Zh. Fiz. Khim.55(1981) 2342–2345. 20) A. T. Dinsdale: Calphad15(1991) 317–425.
21) J. Schramm: Z. Metallkd.33(1941) 347–355.
22) M. Ettenberg, K. L. Komarek and E. Miller: Trans. Metall. Soc. AIME
242(1968) 1801–1807.
23) P. Nash, M. F. Singleton and J. L. Murray:Phase Diagrams of Binary Nickel Alloys, ed. P. Nash, (ASM International, Materials Park, OH, USA, 1991), Monograph Series on Alloy Phase Diagrams, 3–11. 24) W. O. Alexander and N. B. Vaughan: J. Inst. Metals61(1937) 247–
260.
25) W. L. Fink and L. A. Willey: Trans. AIME111(1934) 293–303. 26) P. Nash and D. R. F. West: Met. Sci.17(1983) 99–100.
27) V. S. Litvinov and A. A. Arkhangel’Skaya: Fiz. Met. Metalloved.43
(1977) 1044–1051.
28) I. M. Robertson and C. M. Wayman: Metallography17(1984) 43–55. 29) P. K. Rastogi and A. J. Ardell: Acta Metall.17(1969) 595–602. 30) P. D. Desai: J. Phys. Chem. Ref. Data16(1987) 109–124.
31) V. M. Sandakov, Ya. O. Esin and P. V. Gel’d: Zh. Fiz. Khim.45(1971) 1798–1799.
32) O. Kubaschewski: Trans. Faraday Soc.54(1958) 814–820. 33) L. Kaufman and H. Nesor: Calphad2(1978) 325–348. 34) C. Sigli and J. M. Sanchez: Acta Metall.33(1985) 1097–1104. 35) B. Sundman and J.Agren: J. Phys. Chem. Solids42(1981) 297–301. 36) I. Ansara, B. Sundman and P. Willemin: Acta Metall.36(1988) 977–
982.
37) A. Pasturel, C. Colinet, A. T. Paxton and M. van Schilfgaarde: J. Phys. Condens. Matter4(1992) 945–959.
38) H. W. L. Phillips: J. Inst. Metals68(1942) 28–30.
39) A. Taylor and N. J. Doyle: J. Appl. Crystallogr.5(1972) 201–209. 40) K. Hilpert, D. Kobertz, V. Venugopal, M. Miller, H. Gerads, F. J.
Bremer and H. Nickel: Z. Naturforsh A42(1987) 1327–1333. 41) J. D. Verhoeven, J. H. Lee, F. C. Laabs and L. L. Jones: J. Phase
Equilibria12(1991) 15–23.
42) C. C. Jia, K. Ishida and T. Nishizawa: Metall. Mater. Trans., A25A
(1994) 473–485.
43) H. Ino: Acta Metall.26(1978) 827–834.