Biomass and carbon stocks in Schima superba dominated
subtropical forests of eastern China
A. Ali
1,2, W.J. Ma
1,2, X.D. Yang
1,2, B.W. Sun
1,2, Q.R. Shi
1,2, M.S.Xu
1,21Department of Environmental Sciences, East China Normal University, Shanghai, P. R. China 2Tiantong National Forest Ecosystem Observations and Research Station, Ningbo, Zhejiang, P. R. China
ABSTRACT:Quantitative relationships between stand indices and carbon dioxide (CO2) stocking are missing in the evergreen broadleaved forests (EBLFs) in eastern China and this hinders to estimate carbon (C) budget in the subtropi-cal region. We determined the vegetation-soil C pool and CO2 stocking using stand indices [diameter at breast height (DBH), total height (H) and wood density] in Schima superba dominated EBLFs in the Tiantong National Forest Park in eastern China. Vegetation biomass was determined by a non-destructive method using the tree volume and wood density approach while soil C concentration was determined using the oil bath-K2CrO7 titration method. Finally, mul-tiple regression and one-way ANOVA with LSD test were used for data analysis. Results showed that total C stocks in the vegetation and the 0–20 cm surface soil were 90.53 t·ha–1 and 116.24 t·ha–1, respectively. The study revealed that the total amount of CO2 stocks in the studied forest is 331.87 t·ha–1. One-way ANOVA with LSD test showed that CO
2 stocks varied significantly (P < 0.05) between the tree growth stages. There was a significant variation in CO2 stocking capacity within sapling and pole growth stages but no significant variation within standard stage. The stepwise multiple regression analysis showed that DBH, BA and H were related to the C stocking while wood density had no significant effect. The significant amount of C stocking in EBLFs in the Tiantong National Forest Park of eastern China showed the potential and significant C stocks by trees. As the C pool structure changes due to a change in the forest type and location, therefore this study is important to estimate C stocks and predict CO2 stocks from stand indices in EBLFs which serve as a scientific basis for sustainable forestry operations, rational utilization of forest resources and global warming reduction in EBLFs in subtropical regions of China.
Keywords:carbon stocks; evergreen broadleaved forest; forest inventory-based approaches; tree growth; wood density
JOURNAL OF FOREST SCIENCE, 60, 2014 (5): 198–207
The increase of carbon dioxide (CO2) in the at-mosphere is becoming a global issue. Carbon (C) is sequestered by the plant photosynthesis and stored as biomass in different components of the tree. During photosynthesis, trees act as a sink for CO2 by fixing C and sequester excess C as biomass in different tree organs. The net long-term CO2 se-questration of forest changes through the life span as trees grow up, die and decay (Nowak, Crane 2002). Trees absorb CO2 from the atmosphere by getting an increase in their biomass through growth and sequester it in the plant tissues (Mathew et al. 2000) resulting in development of different tree components. As the tree biomass performs growth, the C held by the tree also increases the CO2 stock
(Tagupa et al. 2010). The CO2 sequestration rate depends on the growth (diameter) characteristics of the tree species (Huy, Anh 2008). The plant hav-ing a higher quantity of biomass reflects the higher CO2 sequestration in the whole tree as well as in tree components (overbark stem, branches and leaves) (Jana et al. 2011). Forest trees are recog-nized as very important in the global C cycling, because the amount of C stored in plant biomass globally exceeds that of atmospheric CO2, and nearly 90% of the plant biomass C is stored in tree biomass (Mooney et al. 2001). The quantifica-tion of forest biomass has a long history and has received renewed attention in the last decades be-cause forest biomass represents about 44% of the
globe forest C pool (Pan et al. 2011) and therefore plays a crucial role in climate change mitigation. Furthermore, sequestration of CO2 among forests depends on forest type, dominant tree species and forest stand age (Huy, Anh 2008). This highlights the need to precisely determine the amount of C stored and CO2 sequestrated in each of specific for-est ecosystems.
For estimating C stocks, forest inventory-based approaches have been used all over the world (Kurz, Apps 1999; Liski et al. 2002; Nizami 2012). The output variables of traditional forest inventories are tree height and diameter which can later be converted into tree volume, biomass and C stocks. Stand-level biomass is an aggregation of single-tree biomass. In various process models the relative proportion of biomass components in trees changes after canopy closure (Berninger, Nikinmaa 1997), which is the time point-based variable as light conditions change considerably during forest development (Oliver, Larson 1996). For example, the relative proportion of foli-age biomass decreases, while the relative biomass of stems continues to increase through the tree ontogenetic growth (Satoo, Madgwick 1982). Therefore, the stand-level biomass cannot be measured directly. Instead, an estimation for each tree can be done and then summed to give the total stand estimation (Zianis et al. 2005). Estimations of tree biomass can be measured directly by using harvesting methods, but estimation is preferred to avoid damaging the forests (Montès et al. 2000). Using allometric equations (species-specific or generalized; Chave et al. 2005) or general vol-ume equation (Brown, Lugo1992; Nizami et al. 2009; Nizami 2012) is a non-destructive approach to calculate total tree biomass. Then the estima-tion of C stocks can be derived from the biomass using an international standard conversion factor (0.5) and assuming that 50% of the tree biomass has elemental C (Dixon et al. 1994; Nizami et al. 2009). After that the ratio of CO2 to C, i.e. 3.6663, can be used to calculate CO2 stocks from total C stocks (Anh 2007; Tagupa et al. 2010).
The rate of sequestrated and stored CO2 of a giv-en tree is related to the tree size such as stem basal area (BA) and total tree height (H). At a sapling stage, the biomass and CO2 stocking varies among tree species but as trees grew bigger and reached the pole and standard stages, no more significant variation existed in terms of their C stocking capac-ity (Tagupa et al. 2010). During the tree growth, BA and H should allometrically relate to biomass accumulation and CO2 stocks of a tree. However,
the stem wood density might have no significant ef-fect on CO2 stocks because of a small variation in wood density with the tree growth for a given spe-cies (Zhang 1995). If this is true, we thus hypoth-esized that CO2 stocks should vary with the tree growth from sapling to standard stage. Rather than wood density, tree CO2 stocks should be associated with BA, diameter at breast height (DBH) and H, because of the negligible variation in wood density among the growth stages of a tree.
In absolute terms, soil C stocks are much larger than C sequestered in tree biomass (Lal 2004). A recent calculation of C storage values, includ-ing soil C stock estimates, revealed significantly higher estimates in nearly all biomes, including an approximately threefold increase in soil organic C stocks estimates for tropical forests (Eglin et al. 2011). The moist tropical or sub-tropical forests contained more than 50% of C stocks in soils and almost less than 50% in the vegetation because the dead biomass rapidly decomposes in the warm, hu-mid conditions and the minerals rapidly leach out of tropical forest soils (Ross 2009).Therefore, the C concentration in soils is highly significant; it is assumed that soils have approximately three times more C than the vegetation and twice more as to that present in the atmosphere (Batjes, Sombroek 1997). However, little is currently understood how C stocks partitioned between vegetation and soil in subtropical forests in eastern China.
Evergreen broadleaved forests (EBLFs) are a zonal vegetation type located in subtropical China (Song,Wang 1995; Feng et al. 1999).In this study, we determined the vegetation-soil C pool and esti-mated CO2 stocks in one of the typical EBLFs us-ing different stand indices through forest inventory based approaches. Specifically, we were interested in (1) how the C stock partitions between vegeta-tion and soil pools; (2) whether forest CO2 stocks relate to the tree growth stage, and (3) whether site indices can be used for predicting CO2 stocks of trees in EBLFs.
MATERIAL AND METHODS
low intra-annual variability) and mean annual evaporation is 1,320.1 mm (less than annual pre-cipitation). The soil is mostly mountain yellow-red soil, with the parent material mostly including Mesozoic sedimentary rocks, some acidic igneous rocks, and granite residual weathered material (Song, Wang 1995).
The zonal vegetation in this region is subtropical EBLFs. In Tiantong National Forest Park, the ma-jority of the EBLFs are Schima superba Gardn. et Champ dominated forests, which are considered as sub-climax monsoon EBLFs and have been severely disturbed in the history with only small tracks (ap-proximate 10 ha) of semi-intact forests left around a Buddhist temple (Yan et al. 2009). Since forest age, community structure and plant species composition are similar in this area (Yan et al. 2013), six square plots, each of 10 × 10 m in size, were established to represent the ranges of both community and environ-mental properties in this study. The tree stratum is 15 to 18 m high and cover percentage is 80~90%, occupied by evergreen broadleaf species. The shrub stratum is
< 4 m in height and coverage is 45–50%. The herb stratum is < 0.5 m in height with coverage being 10 to 30 % and the dominant species are normally ferns. Totally, eighteen woody plant species were found in the studied plots. The species list and their DBH (cm), BA (m2·ha–1), H (m), stem volume (m3·ha–1), wood
density (g·cm–3) and stem density (trees·ha–1) for each
species are shown in detail in Table 1.
Measurements of forest structure and tree biomass. The vegetation C stocks were estimated based on the general volume equation by getting the relationships between tree H, DBH and wood density (Nizami et al. 2009; Tagupa et al. 2010; Nizami 2012). For all woody plants in the studied plot, base diameter and DBH were measured for tall trees, while base diameter and 45 cm diameter (D45) were measured for small trees (of less than 1.50 m in height). The H to the top of trees was measured with a telescopic pole for heights up to 15 m, and with a clinometer for heights > 15 m.
[image:3.595.67.531.387.713.2]The tree individuals of S. superba and Lithocarpus glaber were classified into three growth stages on the
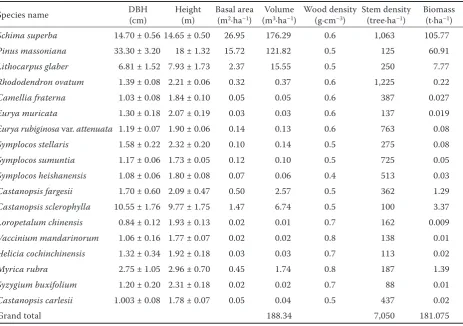
Table 1. Characteristics of the studied plots in Schima superba dominated evergreen broadleaved forest in the
Tian-tong National Forest Park in eastern China
Species name DBH (cm) Height (m) Basal area (m2·ha–1) (mVolume 3·ha–1) Wood density (g·cm–3) Stem density (tree·ha–1) Biomass (t·ha–1)
Schima superba 14.70 ± 0.56 14.65 ± 0.50 26.95 176.29 0.6 1,063 105.77
Pinus massoniana 33.30 ± 3.20 18 ± 1.32 15.72 121.82 0.5 125 60.91
Lithocarpus glaber 6.81 ± 1.52 7.93 ± 1.73 2.37 15.55 0.5 250 7.77
Rhododendron ovatum 1.39 ± 0.08 2.21 ± 0.06 0.32 0.37 0.6 1,225 0.22
Camellia fraterna 1.03 ± 0.08 1.84 ± 0.10 0.05 0.05 0.6 387 0.027
Eurya muricata 1.30 ± 0.18 2.07 ± 0.19 0.03 0.03 0.6 137 0.019
Eurya rubiginosa var. attenuata 1.19 ± 0.07 1.90 ± 0.06 0.14 0.13 0.6 763 0.08
Symplocos stellaris 1.58 ± 0.22 2.32 ± 0.20 0.10 0.14 0.5 275 0.08
Symplocos sumuntia 1.17 ± 0.06 1.73 ± 0.05 0.12 0.10 0.5 725 0.05
Symplocos heishanensis 1.08 ± 0.06 1.80 ± 0.08 0.07 0.06 0.4 513 0.03
Castanopsis fargesii 1.70 ± 0.60 2.09 ± 0.47 0.50 2.57 0.5 362 1.29
Castanopsis sclerophylla 10.55 ± 1.76 9.77 ± 1.75 1.47 6.74 0.5 100 3.37
Loropetalum chinensis 0.84 ± 0.12 1.93 ± 0.13 0.02 0.01 0.7 162 0.009
Vaccinium mandarinorum 1.06 ± 0.16 1.77 ± 0.07 0.02 0.02 0.8 138 0.01
Helicia cochinchinensis 1.32 ± 0.34 1.92 ± 0.18 0.03 0.03 0.7 113 0.02
Myrica rubra 2.75 ± 1.05 2.96 ± 0.70 0.45 1.74 0.8 187 1.39
Syzygium buxifolium 1.20 ± 0.20 2.31 ± 0.18 0.02 0.02 0.7 88 0.01
Castanopsis carlesii 1.003 ± 0.08 1.78 ± 0.07 0.05 0.04 0.5 437 0.02
Grand total 188.34 7,050 181.075
basis of DBH regardless of the age, i.e. sapling stage (< 10 cm DBH), pole stage (10–20 cm DBH) and stan-dard stage (> 20 cm DBH) by following the method standard of Tagupa et al. (2010) while the other species of the study plot could not be classified into growth stages according to the standard criteria.
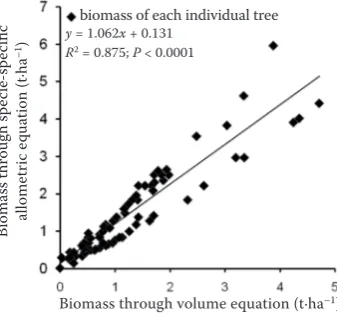
Aboveground biomass for each individual tree was calculated by a non-destructive method by mul-tiplying the tree volume by the species-specific dry wood density (Brown, Lugo 1992; Nizami et al. 2009; Nizami 2012). The biomass obtained by the volume-density equation was highly consistent (R2 =
0.87; P < 0.0001) with biomass obtained by the site and species-specific allometric equation for Schima superba (DBH ranges from 3.5 to 25.5 cm; the num-ber of trees cut = 6; Yang et al. 2010) (Fig. 1). Tree volume per hectare for each species was calculated using general Eq. (1) (Lu et al. 2003):
V = 0.42 × BA × H (1)
where:
V – volume of a tree (m3·ha–1),
0.42 – fixed general value used for form factor because it can be used in the absence of local equations to estimate the cubic volume of a standing tree (Mangnussen et al. 2004),
BA – basal area (m2·ha–1) using the formula BA = π (d/2)2 ×
10–4 (Small et al. 2004),
H – total tree height (m),
d – DBH for big trees or D45 for small trees (cm).
The per-hectare volume was estimated by the ratio of the sample plot area to the area of 1 ha.
For measuring wood density, wood samples were taken from the trunk of 7–10 trees of the same
spe-cies having different DBH using a 5 mm-diameter increment corer. In the laboratory, the length of the tree core was measured with an electronic vernier calliper, and then the volume of the tree core was calculated. Next, core samples were dried at 75°C in an oven for 72 h to determine dry mass used to calculate the wood density (Chave et al. 2006).
It should be noted that the studied plots did not include so much deadwood and debris because of clearing by the forest manager every year for a landscape view. Therefore, we decided to take the soil and vegetation as major C pools by ignoring dead woody debris.
Calculation of forest C and CO2 stocks. Total C stock in each species was determined by multi-plying the total tree biomass by a conversion factor (0.5), which is representative of the average C con-tent in tree biomass. This conversion factor shows that 50% of the total tree biomass is equal to el-emental C (Brown, Lugo 1982; Dixon et al. 1994; Nizami et al. 2009).
The CO2 stock in tree was computed using Eq. 2 (Tagupa et al. 2010).
CO2 stock = Cveg × 3.6663 (2)
where:
Cveg – C stocks in vegetation (t·ha–1),
3.6663 – universal conversion factor of C content values to CO2 values.
The ratio of CO2 to C is determined by atomic mass (Anh 2007; CFS 2009; Superak 2010). Fur-thermore, Anh (2007) also suggested on the basis of an experimental approach that the CO2 amount which vegetation absorbs and O2 are harmonized in the atmosphere and can be calculated by means of the chemistry equation, i.e. CO2 = C + O2 and thus CO2 = 3.6663C.
CO2 stocks in different tree components for each individual were estimated using tree components specific allometric Eqs. 3–6, developed by Huy and Anh (2008) for Schima superba dominated EBLFs in Vietnam:
CO2 stem = 6.15398 + 1.02468 × Ln(V) (3) CO2 bark = 4.11447 + 1.06381 × Ln(V) (4) CO2 branch = –4.11248 + 2.70337 × Ln(d) (5) CO2 leaf = –2.941 + 1.72414 × Ln(d) (6)
where:
CO2 – stocks in each tree component, converted to t·ha–1;
V – volume of a tree stem (m3),
[image:4.595.66.235.519.676.2]d – DBH for big trees or D45 for small trees (cm).
Fig. 1. Comparison of the individual tree biomass of Schima
superba estimated from the volume equation, i.e. tree
biomass = tree volume (m3·ha–1) × species-specific wood
density (g·cm–3) (Brown, Lugo 1992; Brown, Iverson
1992; Nizami et al. 2009) and species-specified allometric
equation for Schima superba (Yang et al. 2010)
biomass of each individual tree
Biomass through volume equation (t·ha–1)
Bioma
ss t
hr
oug
h sp
ec
ie-sp
ec
ific
allome
tr
ic e
qu
ation (t·ha
–1)
y = 1.062x + 0.131
However, to avoid the overestimation of the total CO2 content, the amount of CO2 in bark and stem was considered as an overall percentage, i.e. CO2 in overbark stem (Tagupa et al. 2010).
Measurement of soil carbon stock. Ten soil sam-ples were taken with a metal corer from randomly chosen spots in each of the studied plot (0–20 cm soil layer). The litter layer was removed before the soil was taken. The soil bulk density was determined us-ing a steel corer of the known volume. Before weigh-ing, approximately 5 soil cores per plot were placed in a 105°C oven for > 48 hours. Bulk density (g·cm–3)
was calculated by dividing the oven dry weight (g) of the soil sample by the volume of the soil sample in the steel corer (cm3). Then the remaining soil
sam-ples were air-dried for 30 days, and passed through a 2-mm sieve to determine the total C concentration using the oil bath-K2CrO7 titration method (Nelson, Sommers 1975). Finally, C stock in the top 0–20 cm soils was estimated using Batjes (1996) formula.
Data analysis. The data analysis included three steps. The first step was to determine relationships between H, DBH, BA, tree volume and CO2 stocks of all plant species using linear regression methods. In the second step, one-way ANOVA with the Least Significant Difference (LSD) test was used to find out the significant variance of CO2 stocks between tree
growth stages while regression ANOVA was used to explore the significant variation of CO2 stocks with the response of DBH in each growth stage of Schima superba and Lithocarpus glaber. In the third step, the stepwise multiple regression analysis was used to find out whether CO2 stocks were affected by differ-ent tree variables (DBH, H and wood density) of all studied species in the sampling plots. All statistical tests were considered significant at the P < 0.05 level.
RESULTS
Forest biomass
H in the studied forest increased with increasing DBH. Among all species, on average basis Pinus mas-soniana had greater H (18 m) and DBH (33.3 cm) than Schima superba with 14.65 m H and 14.70 cm DBH (Table 1). For most species, H and DBH showed a positive linear relationship. Stem volume increased linearly with increasing BA (r = 0.98) for all species.
Tree biomass was related to BA significantly and linearly for each species (Table 2). Total tree bio-mass was greater in Schima superba (105.77 t·ha–1)
than in Pinus massoniana (60.911 t·ha–1). In the
studied forest, grand total tree biomass being
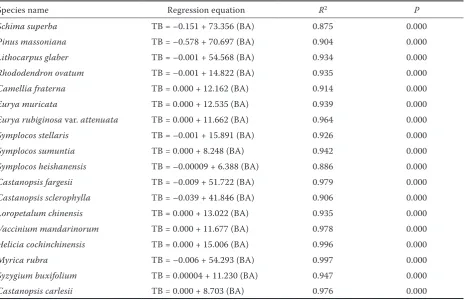
cal-Table 2. Linear regression analysis for tree biomass (TB) against basal area (BA)
Species name Regression equation R2 P
Schima superba TB = –0.151 + 73.356 (BA) 0.875 0.000
Pinus massoniana TB = –0.578 + 70.697 (BA) 0.904 0.000
Lithocarpus glaber TB = –0.001 + 54.568 (BA) 0.934 0.000
Rhododendron ovatum TB = –0.001 + 14.822 (BA) 0.935 0.000
Camellia fraterna TB = 0.000 + 12.162 (BA) 0.914 0.000
Eurya muricata TB = 0.000 + 12.535 (BA) 0.939 0.000
Eurya rubiginosa var. attenuata TB = 0.000 + 11.662 (BA) 0.964 0.000
Symplocos stellaris TB = –0.001 + 15.891 (BA) 0.926 0.000
Symplocos sumuntia TB = 0.000 + 8.248 (BA) 0.942 0.000
Symplocos heishanensis TB = –0.00009 + 6.388 (BA) 0.886 0.000
Castanopsis fargesii TB = –0.009 + 51.722 (BA) 0.979 0.000
Castanopsis sclerophylla TB = –0.039 + 41.846 (BA) 0.906 0.000
Loropetalum chinensis TB = 0.000 + 13.022 (BA) 0.935 0.000
Vaccinium mandarinorum TB = 0.000 + 11.677 (BA) 0.978 0.000
Helicia cochinchinensis TB = 0.000 + 15.006 (BA) 0.996 0.000
Myrica rubra TB = –0.006 + 54.293 (BA) 0.997 0.000
Syzygium buxifolium TB = 0.00004 + 11.230 (BA) 0.947 0.000
Castanopsis carlesii TB = 0.000 + 8.703 (BA) 0.976 0.000
[image:5.595.67.533.441.741.2]culated by summating each individual tree of all species was 181.07 t·ha–1.
Forest C and CO2 stocks
Assuming that 50% of the vegetation biomass is C, the greater amount of total C stocks was found in the species Schima superba (52.88 t·ha–1),followed
by Pinus massoniana (30.45 t·ha–1). Total vegetation
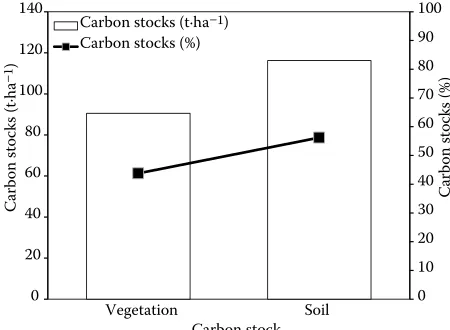
C stocks in the studied forest were 90.53 t·ha–1
(Ta-ble 3). Total soil C stocks at the 0–20 cm surface soil were 116.24 t·ha–1 (Fig. 2) having 1.3 ± 0.01 (g·cm–3)
bulk density. Totally, the overall C stocks on the eco-system (vegetation + soil) level were 206.77 t·ha–1
,
with43.79% in vegetation, while with 56.21% in the surface soil (Fig. 2).
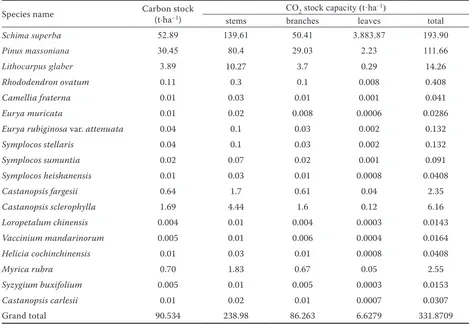
The total amount of CO2 stocks in the studied forest was 331.87 t·ha–1. The amount of CO
2 sequestrated
among tree components was largest in stems, interme-diate in branches, and lowest in leaves (Table 3). Con-sidering particular species, the greater amount of total CO2 stocks was found in Schima superba (193.90 t·ha–1)
and Pinus massoniana (111.66 t·ha–1).
Relationship between CO2 stock capacity and tree growth
To test whether the CO2 stocking capacity depends on tree ontogeny, the two most abundant species Schi-ma superba and Lithocarpus glaber were classified into three developmental stages on the basis of DBH; sapling stage (< 10 cm DBH), pole stage (10–20 cm DBH), standard stage (> 20 cm DBH). One-way ANO-VA with the LSD test showed that the CO2 stock
var-ies significantly (P < 0.05) between the growth stages (Fig. 3). Furthermore, according to the regression ANOVA result, significant variation in CO2 stock-ing capacity with DBH variation exists within saplstock-ing stage (P = 0.037) and pole stage (P = 0.00) while no significant (P = 0.13) variation exist within standard stage (Table 4).
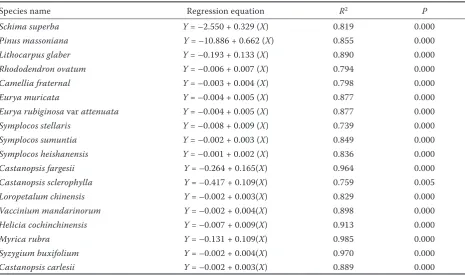
Relationships between CO2 stocks and stand indices
The regression equation of each species showed that CO2 stocks increase with the increasing diam-eter of the tree. Wood density, however, did not affect the C stocks. Also, P-values for each species showed that there was a significant relationship between CO2 stocks and DBH of trees (P < 0.05, Table 5).
In each unit area or each forest stand, it is nec-essary to calculate CO2 stocks to find out which stand indices influence the effectiveness of predict-ing CO2 stocks. The stepwise regression analysis showed that DBH and H influenced the effective-ness of predicting CO2 stocks and wood density was excluded from the regression model [i.e. Eq. 7, where R2 = 0.80, P < 0.001, DBH – diameter brest
hight (cm), H – total tree height (m)].
CO2 stock = –0.27 + 0.35 DBH – 0.14 H (7)
DISCUSSION
Effectiveness of stand indices in predicting forest CO2 stocks
According to Huy and Anh (2008) findings the absorbed CO2 amount depends on the species, DBH and H but they did not assess the role of wood den-sity and BA in terms of their effect on C stocks for the specific forest type. In this study, wood density and BA were taken as indicators for predicting the CO2 stocking capacity in EBLFs. The result showed that BA strongly affects the CO2 stocks because of a change in DBH and stem area occupied by the tree during growth. This result is consistent with the find-ings of Huy and Anh (2008) that CO2 has a firm relationship with DBH which has the advantage to identify the CO2 amount sequestrated in each forest stand. Also, this result was quite close to the finding of Tagupa et al. (2010) that the variation in the amount of CO2 sequestered and stored in the trees within a forest stand is affected greatly by the stand density of trees. The estimation of per-hectare tree volume us-ing BA as a function is more significant as compared
0 10 20 30 40 50 60 70 80 90 100
0 20 40 60 80 100 120 140
Car
bon
st
oc
ks
(%
)
Ca
rb
on
st
ock
s (t·
ha
1)
Vegetation Soil Carbon stocks (t·ha1)
Carbon stocks (%)
[image:6.595.64.289.531.696.2]Carbon stock
Fig. 2. Carbon stocks in each type of the aboveground
vegetation and the 0–20 cm surface soil in Schima superba
with using DBH only because BA is the area of a given section of land that is occupied by the cross-sections of tree trunks and stems at their base, which can be further applied to more precise estimation of tree biomass and then CO2 stocks per hectare. In this study, wood density had no significant effect on CO2 stocks in a mixed forest stand because wood density have a negative correlation with DBH (r = –0.125, P < 0.05) and H (r = –0.191, P < 0.05) growth (Ro-chon et al. 2007), but on the other hand, wood den-sity is a significant parameter for predicting tree bio-mass and C stocks (Nogueria et al.2005). Therefore, it is important to mention here that the role of wood density cannot be ignored in tree biomass estimation but it has no significant effect on the CO2 stocks with tree growth in a mixed forest stand.
Change in CO2 stocking capacity with tree growth
C sequestration varies from forest type to forest type and for the growth of forest which potentially relies on the tree diameter size class, i.e. growth stag-es according to DBH (Terakunpisut et al. 2007).
[image:7.595.62.534.87.412.2]The CO2 stocks were dependent on the amount of biomass of trees, specifically, on the variables trunk diameter and H. This confirmed the result of Ter-akunpisut et al. (2007) and Tagupa et al. (2010), who mentioned that the C stocking potential in dif-ferent forest types tends to be correlated with DBH and H. The oneway ANOVA result of Schima su-perba and Lithocarpus glaber species showed that the biomass and CO2 stock varied between growth stages. Furthermore, within sapling and pole stages, CO2 stocks varied significantly with DBH growth but as trees grow bigger and reach standard sizes,
Table 3. Estimates of C and CO2 stocks based on tree components in Schima superba dominated evergreen
broad-leaved forest in the Tiantong National Forest Park in eastern China
Species name Carbon stock (t·ha–1)
CO2 stock capacity (t·ha–1)
stems branches leaves total
Schima superba 52.89 139.61 50.41 3.883.87 193.90
Pinus massoniana 30.45 80.4 29.03 2.23 111.66
Lithocarpus glaber 3.89 10.27 3.7 0.29 14.26
Rhododendron ovatum 0.11 0.3 0.1 0.008 0.408
Camellia fraterna 0.01 0.03 0.01 0.001 0.041
Eurya muricata 0.01 0.02 0.008 0.0006 0.0286
Eurya rubiginosa var. attenuata 0.04 0.1 0.03 0.002 0.132
Symplocos stellaris 0.04 0.1 0.03 0.002 0.132
Symplocos sumuntia 0.02 0.07 0.02 0.001 0.091
Symplocos heishanensis 0.01 0.03 0.01 0.0008 0.0408
Castanopsis fargesii 0.64 1.7 0.61 0.04 2.35
Castanopsis sclerophylla 1.69 4.44 1.6 0.12 6.16
Loropetalum chinensis 0.004 0.01 0.004 0.0003 0.0143
Vaccinium mandarinorum 0.005 0.01 0.006 0.0004 0.0164
Helicia cochinchinensis 0.01 0.03 0.01 0.0008 0.0408
Myrica rubra 0.70 1.83 0.67 0.05 2.55
Syzygium buxifolium 0.005 0.01 0.005 0.0003 0.0153
Castanopsis carlesii 0.01 0.02 0.01 0.0007 0.0307
Grand total 90.534 238.98 86.263 6.6279 331.8709
C and CO2 stocks were obtained from the summation of all individuals for each species in the plot
Table 4. Results of regression ANOVA for the variability
of CO2 stocks induced by individual trees differing in
DBH within each growth stage (sapling, pole and stand-ard stages)
Growth stage CO2 stock (t·ha–1) F P
Sapling 6.17 3.328 0.037
Pole 132.17 5.469 0.00
Standard 69.85 76.838 0.13
[image:7.595.303.531.662.726.2]no significant variation exists any more in terms of their CO2 stocking because the growth rate (change in DBH) will gradually slow down for mature trees (Terakunpisut et al. 2007). The factors such as wood density, H, BA and DBH may have interplayed, giving complementary effects. The lower wood den-sity values may be compensated by greater H and DBH, and vice versa.
Carbon stock pattern in typical subtropical forest
Estimating C stocks by species is an important trend and should be studied to a greater extent es-pecially when the tree species composition might change in a mixed forest stand (Kellomäki, Kol-ström 1992). Therefore, the study of C stocks be-tween vegetation and soils is more important to clear the complex relationship for each forest type and location. A linear regression equation was de-veloped for the tree biomass of each species as a function of BA, showing that the tree biomass in-creases with the increasing stem diameter (Niza-mi et al. 2009). In this study, the result is quite close to the findings of Yang et al. (2010), who reported that the total biomass in Tiantong
Schi-ma superba community was 225.3 ± 30.1 t·ha–1.
The overall C stock (vegetation plus soil) in sub-tropical EBLFs was 206.77 t·ha–1 which consists of
43.79% in vegetation biomass and 56.21% in the topsoil. Additionally, our results are quite close to the findings of Ross (2009), who reported that the subtropical forest contained more than 50% (i.e. up to 50.5%) C in soil and less than 50% (i.e. up to 49.5%) C in vegetation. The overall C stocks are relatively close to the estimate by Dixon et al. (1994), who reported that the Asian tropical forest holds a C density of 132–174 t·ha–1. Brown and
Lugo (1984) estimated that the tropical forests of Bangladesh hold approximately 55–90 t·ha–1 of
[image:8.595.65.531.98.373.2]C in forest ecosystems. Overall, soil C stocks are the interactive result of climate, soil properties, litter production by vegetation, and litter quality; the more productive and dense vegetation in the site, the more litter is fed into soil (Liski 1995). In subtropical EBLFs, the C stocks in soils are a little higher than those in vegetation because of the rapid decomposition of dead biomass (Yan et al. 2007), higher litter production due to the dense mixed forest stand (approx; plant to plant and row to row distance was 3 × 3 m, respectively, in the study plot), and moist and humid climate (Yan et al. 2008).
Table 5.Results of linear regression analysis for CO2 stocking capacity (Y) against stem diameter at breast height (X)
for large trees or diameter at 45 cm height (X) for small trees in Schima superba dominated evergreen broadleaved
forest in the Tiantong National Forest Park in eastern China
Species name Regression equation R2 P
Schima superba Y = –2.550 + 0.329 (X) 0.819 0.000
Pinus massoniana Y = –10.886 + 0.662 (X) 0.855 0.000
Lithocarpus glaber Y = –0.193 + 0.133 (X) 0.890 0.000
Rhododendron ovatum Y = –0.006 + 0.007 (X) 0.794 0.000
Camellia fraternal Y = –0.003 + 0.004 (X) 0.798 0.000
Eurya muricata Y = –0.004 + 0.005 (X) 0.877 0.000
Eurya rubiginosa var attenuata Y = –0.004 + 0.005 (X) 0.877 0.000
Symplocos stellaris Y = –0.008 + 0.009 (X) 0.739 0.000
Symplocos sumuntia Y = –0.002 + 0.003 (X) 0.849 0.000
Symplocos heishanensis Y = –0.001 + 0.002 (X) 0.836 0.000
Castanopsis fargesii Y = –0.264 + 0.165(X) 0.964 0.000
Castanopsis sclerophylla Y = –0.417 + 0.109(X) 0.759 0.005
Loropetalum chinensis Y = –0.002 + 0.003(X) 0.829 0.000
Vaccinium mandarinorum Y = –0.002 + 0.004(X) 0.898 0.000
Helicia cochinchinensis Y = –0.007 + 0.009(X) 0.913 0.000
Myrica rubra Y = –0.131 + 0.109(X) 0.985 0.000
Syzygium buxifolium Y = –0.002 + 0.004(X) 0.970 0.000
Castanopsis carlesii Y = –0.002 + 0.003(X) 0.889 0.000
CONCLUSIONS
The significant amount of C stocking in the typical EBLF in the Tiantong National Forest Park of eastern China showed the potential and significant C stocks by trees. Despite of the tree age, the bigger trees, par-ticularly at their standard sizes, have the greatest C stocks, sequestered the greatest amount of CO2, but have a low ability to sequester more CO2 from the atmosphere for future because of the slow growth in trunk diameter as compared to the trees of pole and sapling sizes. Assuming that the trees are allowed to grow and are not cut for any purpose at all, they continue to provide the safety C sinks for the adverse effects of climate change. As the C pool structure changes due to a change in the forest type, class and location, therefore this study is important to estimate C stocks and predict CO2 stocks from stand indices in EBLFs which serve as a scientific basis for sustain-able forestry operations, rational utilization of forest resources and global warming reduction in EBLFs in subtropical regions of China.
Acknowledgements
We are grateful to Prof. En-Rong Yan for insight-ful comments during the development of this work.
References
Anh T.P. (2007): Forecasting CO2 absorbility capacity on natural broad-leaved evergreen forests in tuy duc district, Daknong province. [Summary of Master’s Thesis.] Đăk Lăk, Ministry of Agriculture and Rural Development (MARD), Forestry University-Tay Nguyen University in Vietnam: 24.
Batjes N.H. (1996): Total carbon and nitrogen in the soils of the world. European Journal of Soil Science, 47: 151–163. Batjes N.H., Sombroek W.G. (1997): Possibilities for carbon
sequestration in tropical and subtropical soils. Global Change Biology, 3: 161–173.
Berninger F., Nikinmaa E. (1997): Implications of varying pipe model relationships on Scots Pine growth in different climates. Functional Ecology, 11: 146–156.
Brown S., Lugo A.E. (1982): The storage and production of organic matter in tropical forests and their role in the global carbon cycle. Biotropica, 14: 161–187.
Brown S., Lugo A.E. (1984): Biomass of tropical forests: A new estimate based on forest volumes. Journal of Forest Science,
22: 1290–1293.
Brown S., Lugo A.E. (1992): Above ground biomass estimates for tropical moist forests of the Brazilian Amazon. Intercien-cia, 17: 8–18.
Chave J., Andalo C., Brown S., Cairns M.A., Chambers J.Q., Eamus D., Fölster H., Fromard F., Higuchi N., Kira T., Lescure J.P., Nelson B.W., Ogawa H., Puig H., Riéra B., Yamakura T. (2005): Tree allometry and improved estimation of carbon stocks and balance in tropical forests. Oecologia, 145: 87–99.
CFS (2009): CarbonFix Standard. Available at http://www. carbonfix.info/chameleon//outbox//public/216/Example-Calculations.pdf?PHPSESSID=cyqkigazki
Chave J., Muller-Landau H., Baker T., Easdale T., Teer-Steege H.T., Webb C.O. (2006): Regional and phylogenetic variation of wood density across 2,456 neotropical tree spe-cies. Ecological Applications, 16: 2356–2367.
Dixon R.K., Brown S., Solomon R.A., Trexler M.C., Wis-niewski J. (1994): Carbon pools and flux of global forest ecosystems. Science, 263: 185–190.
Eglin T., Ciais P., Piao L.S., Barre P., Belassen V., Cadule P., Chen C., Gasser T., Reichstein M., Smith P., Sauer J.T., Norman M.J., Sivakumar K.V.M. (2011): Overview on Response of Global Soil Carbon Pools to Climate and Land-Use Changes. In: Sauer T.J. et al. (eds): Sustaining Soil Productivity in Response to Global Climate Change: 183–199. Feng Z.W., Wang X.K., Wu G. (1999): The Biomass and Pro-ductivity of Forest Ecosystem in China. Beijing, China Science Press: 241. (in Chinese)
Huy B., Anh T.P. (2008): Estimating CO2 sequestration in natu-ral broad-leaved evergreen forest in Vietnam. Asia-Pacific Agroforestry Newsletter, 32: 7–10.
Jana B.K., Biswas S., Majumder M., Roy P.K., Mazumdar A. (2011): Carbon sequestration rate and aboveground biomass carbon potential of three young species in lower Gangetic plain. Journal of Environmental Science and Engineering,
53: 299–308.
Kellomäki S., Kolström M. (1992): Simulation of tree spe-cies composition and organic matter accumulation in Finnish boreal forests under changing climatic conditions. Vegetatio,
102: 47–68.
Kurz W.A., Apps M.J. (1999): Developing Canada’s national forest carbon monitoring, accounting and reporting system to meet the reporting requirements of the Kyoto protocol. Mitigation and Adaptation Strategies for Global Change,
11: 33–43.
Lal R. (2004): Soil carbon sequestration impacts on global climate change and food security. Science, 304: 1623–1627. Liski J. (1995): Variation in soil organic carbon and thickness
of soil horizons within a boreal forest stand – effect of trees and implications for sampling. Silva Fennica, 29: 255–266. Liski J., Perruchod D., Karjalainen T. (2002): Increasing
carbon stocks in the forest soils of Western Europe. Forest Ecology and Management, 169: 159–175.
Mangnussen S., Reed D. (2004): Modeling for estima-tion and monitoring. Available at http://www.fao.org/ forestry/17109/en/
Matthews E., Payne R., Rohweder M., Murray S. (2000): Forest ecosystem: carbon storage sequestration. Global Cli-mate Change Digest, 12: 157–180.
Montès N., Gauquelin T., Badri W., Bertaudiere V., Zaoui E.H. (2000): A nondestructive method for estimating above-ground forest biomass in threatened woodlands. Forest Ecology and Management, 130: 37–46.
Mooney H., Roy J., Saugier B. (2001): Terrestrial Global Productivity. San Diego, Academic Press: 573.
Nelson D.W., Sommers L.F. (1975): A rapid and accurate method for estimating organic carbon in soil. Proceedings of the Indian Academy of Sciences, 84: 456–462.
Nizami M.S., Mirza N.S., Livesley S., Arndt S., Fox C.J., Khan A.I., Mahmood T. (2009): Estimating carbon stocks in sub-tropical pine (Pinus roxburghii) forests of Pakistan. Pakistan Journal of Agricultural Sciences, 4: 266–270. Nizami M.S. (2012): Assessment of the carbon stocks in sub
tropical forests of Pakistan for reporting under Kyoto protocol. Journal of Forest Research, 23: 377–384.
Nogueira E.M., Nelson B.W., Fearnsid P.M. (2005): Wood density in dense forest in central Amazonia, Brazil. Forest Ecology and Management, 208: 261–286.
Nowak D.J., Crane D.E. (2002): Carbon storage and seques-tration by urban trees in the United States. Environmental Pollution, 116: 381–389.
Oliver C.D., Larson B.C. (1996): Forest Stand Dynamics. New York, John Wiley & Sons: 518.
Pan Y., Birdsey R.A., Fang J., Houghton R., Kauppi P.E., Kurz W.A., Phillips O.L., Shvidenko A., Lewis S.L., Canadell J.G., Ciais P., Jackson R.B., Pacala S.W., McGuire A.D., Piao S., Rautiainen A., Sitch S., Hayes D. (2011): A large and persistent carbon sink in the world’s forests. Science, 333: 988–993.
Rochon C., Margolis H.A., Weber J.C. (2007): Genetic vari-ation in growth of Guazuma crinita (Mart.) trees at an early age in the Peruvian Amazon. Forest Ecology and Manage-ment, 243: 291–298.
Ross W.G. (2009): Carbon sequestration in forests. Available at http://www.fas.org/sgp/crs/misc/RL31432.pdf
Satoo T., Madgwick H.A.I. (1982): Forest Biomass. Hague, Martinus Nijhoff/Dr W. Junk Publishers: 152.
Small A., Martin T.G., Kitching R.L., Wong K.M. (2004): Contribution of tree species to the biodiversity of a 1 ha old World rainforest in Brunei, Borneo. Biodiversity and Conser-vation, 13: 2067–2088.
Song Y.C., Wang X.R. (1995): Vegetation and flora of Tiantong national forest park Zhejiang province. Shanghai, Shanghai Scientific & Technological Literature Publishing House: 16. (in Chinese with English abstract)
Superak C. (2010): Rural tree decline in Tasmania’s Midlands: stand structure, substrate geology, and carbon content analysis. Available at http://digitalcollections.sit.edu/isp_col-lection/866
Tagupa C., Lopez A., Caperida F., Pamunag G., Luzada. A. (2010): Carbon dioxide (CO2) sequestration capacity of Tampilisan Forest. E-International Scientific Research Jour-nal, 2: 182–191.
Terakunpisut J., Gaajaseni N., Ruankawe N. (2007): Carbon sequestration potential in aboveground biomass of Thong Pha Phum National Forest, Thailand. Applied Ecology and Environmental Research, 5: 93–102.
Yan E.R., Yang X.D., Chang S.X., Wang X.H. (2013): Plant trait-species abundance relationships vary with environmen-tal properties in subtropical forests in eastern China. PLoS ONE, 8, e61113. doi:10.1371/journal.pone.0061113
Yan E.R., Wang X.H., Guo M. et al. (2009): Temporal patterns of net soil N mineralization and nitrification through second-ary succession in the subtropical forests of eastern China. Plant and Soil, 320: 181–194.
Yan E.R., Wang X.H., Zhou W. (2008): Characteristics of lit-ter fall in relation to soil nutrients in mature and degraded evergreen broad-leaved forests of Tiantong, Eastern China. Chinese Journal of Plant Ecology, 32: 1–12.
Yan E.R., Wang X.H., Huang J.J., Zeng F.R., Gong L. (2007): Long-lasting legacy of forest succession and forest manage-ment: Characteristics of coarse woody debris in an evergreen broad-leaved forest of Eastern China. Forest Ecology and Management, 252: 98–107.
Yang T.H., Song K., Da L.J. Li X.P., Wu J.P. (2010): The bio-mass and aboveground net primary productivity of Schima superba–Castanopsis carlesii forests in east China. Science China Life Sciences, 53: 811–821.
Zhang S.Y. (1995): Effect of growth rate on wood specific grav-ity and selected mechanical properties in individual species from distinct wood categories. Wood Science and Technol-ogy, 29: 451–465.
Zianis D., Muukkonen P., Mäkipää R., Mencuccini M. (2005): Biomass and Stem Volume Equations for tree Species in Europe. Silva Fennica Monographs Vol. 4 Tampere, The Finnish Society of Forest Science: 63.
Received for publication February 15, 2014 Accepted after corrections May 12, 2014
Corresponding author: