Great progress has been made in the breeding of beef cattle in the Czech Republic in the last years. Since 2000 breeding value in beef cattle in the Czech Republic has been estimated for the results of a field test (calving ease, birth weight and weight at 120, 210 and 365 days of age) by a multi-trait animal model (Přibyl et al., 2003). In 2004 the es-timation of breeding value for the own growth of bulls at performance-testing stations by a
single-trait animal model was introduced (Přibylová et al., 2004), and in 2005 for a description of the type traits of young animals of beef cattle by a multi-trait animal model (Veselá et al., 2005). In 2006 selection indexes for beef cattle in the Czech Republic were constructed on the basis of these evaluated traits (Šafus et al., 2006).
The estimation of breeding value for the growth of beef cattle is frequently done by a multi-trait
Stochastic simulation of the influence of insemination
on the estimation of breeding value and its reliability
Z. Veselá
1, J. Přibyl
1, L. Vostrý
1, L. Štolc
21Institute of Animal Science, Praha-Uhříněves, Czech Republic
2Czech University of Life Sciences Prague, Prague-Suchdol, Czech Republic
ABSTRACT: Insemination is used less commonly in the population of beef cattle than in dairy cattle. As a
con-sequence, herds are genetically isolated and their comparison is difficult. The objective of the paper was to evaluate the impact of the use of reference sires in insemination on the estimation of breeding value and its reliability by means of stochastic simulation based on a single addition of calves to the basic set. Simulation was divided into three variants according to the connectedness calves through sires (variant 1 – unrelated calves, variant 2 calves related between HYS but unrelated within HYS, variant 3 – calves related within and between HYS). The degree of connectedness was determined by computation of genetic drift variance (GDV). The average value of GDV in the basic set was 0.71. In our study the highest values of GDV were reached in simulated variant 3, in which the relationship increased not only between HYS but also within HYS. The lowest values of GDV were in variant 2, when the relationship increased only between HYS (simulated calves after reference sires did not have any half-sibs in HYS). The single use of reference sires in one generation to make herds connected slightly increased the average coefficient of reliability from 0.121 to 0.145 (by 2.4%) in the whole set. But this increase from 0.24 to 0.33 (by 8.9%) was observed only in animals that were directly connected through reference sires. The increase in reliability was mainly due to an increase in the number of contemporaries. A decrease in the effective number of sires’ offspring was an indirect consequence of the increase in the connectedness of the set and higher use of reference sires in insemination. This is the reason why the increase in the connectedness of the set influenced the reliability of breeding value of the whole set less than we would expect. The use of reference sires influenced the fluctuation of breeding values. The use of a higher number of reference sires in insemination with only one offspring in each of the connected herds appeared as the most suitable approach from the aspect of the connectedness of the set and reliability of breeding value estimation. A marked influence of herd connectedness on the estimation of breeding value and its reliability, and on the result of breeding, is to be expected after reference sires have been used in several successive generations.
Keywords: beef cattle; breeding value; connectedness; reference sires; reliability; stochastic simulation
animal model with maternal effect. Fixed effects included in the model are herd-year-season, sex, age of dam and regressions on calf and maternal heterosis. Random effects are direct and maternal genetic and maternal environmental effects (Přibyl et al., 2003). The importance of maternal effects in beef cattle has been widely reported (Robison, 1981; Meyer, 1992; Meyer, 2001). Multi-trait mod-els are applied, increasing the reliability of estima-tion of breeding values for the particular traits and coping with problems due to missing data (Přibyl et al., 2003).
In the population of beef cattle artificial insemi-nation is used less commonly than in dairy cat-tle. Therefore the particular herds are genetically isolated and their mutual comparison is difficult (Kennedy and Trus, 1993). A part of the optimum organisation of breeding is such a structure of the mating of sires that creates conditions for reliable estimation of breeding value and subsequent high genetic gain. One of the possibilities is the insemi-nation of reference sires making up a genetic link among the herds. In this context it is possible to study changes in the estimation of breeding value and coefficient of reliability of breeding value es-timation and the degree of connectedness of the particular herds.
Minimisation of prediction error variance (PEV) and maximisation of the coefficient of reliability
(r2) of breeding values is often thought to be the
goal of genetic evaluation. But deviations of esti-mated breeding values also participate in the total
mean square error (MSE): MSE = (Bias)2 + PEV.
For genetic evaluation of animal i:
MSEi = (E(ûi – ui))2 + V(û
i – ui)
where:
(E(ûi – ui) = bias of estimated and true breeding value of
animal i;
V(ûi – ui) = prediction error variance of animal i.
In practice, true parameter values for the true model are required to evaluate bias. Limits for bias, however, might be approximated for some models for a comparison with PEV (Van Vleck, 1987).
Van Vleck (1987) reported the influence of the ef-fective number of daughters on the size of PEV. The effective number of daughters is often a term ap-plied to the diagonal elements of the least-squares matrix corresponding for example to a sire after the absorption of HYS equations. In fact, the inverse of the diagonal elements is often used to approxi-mate the prediction error variance. If the
coeffi-cient matrix after absorption is inverted, the diagonal term corresponds to PEV. Because off-diagonal ele-ments also affect the inverse, and are also generated by absorption, the inverse of the effective number of daughters can be considered only as an approximation of PEV. As an example of the effect of the number of contemporaries on the effective number of daughters, assume HYS are treated as fixed effect. Assume a bull has n daughters in HYS with m daughters of other bulls. The daughters of the bull in HYS contribute n* to the diagonal of the bull equation after the absorp-tion of HYS equaabsorp-tion with:
n2 m
n* = n – ––––– = –––––
n + m n + m
Because PEV is related to the accuracy of evalu-ation and therefore to the genetic gain from
selec-tion, i.e. PEV = (1 – r2) σ
G2 (σG – standard deviation
for genetic effect), the importance of the effective number of daughters by each HYS comparison de-pends on whether
Σ
n*i iis large or small (Van Vleck, 1987).
To evaluate the stability of breeding values at repeated evaluations in time it is possible to use relations between the breeding values of related individuals and Mendelian sampling. The evaluated databases usually comprise several generations of individuals, therefore the breeding values of par-ents and offspring are known. The breeding value of an offspring should approximate the mid-parent breeding value as much as possible. Differences in the expected and estimated breeding value are caused by Mendelian sampling with variance
(0.5 σ2
G) and error of breeding value evaluation.
Mendelian sampling (MS) may be determined for each individual on the basis of direct parents:
BVs – BVD
MsP = BVP –
(
–––––––––)
2
where:
Msp = Mendelian sampling of progeny BVP = breeding value of progeny
BVs = breeding value of sire
BVD = breeding value of dam
In connection with the use of reference sires some papers dealt with the connectedness of a set. Searle (1987) presented a simple geometric method to determine whether data were connected or not. This method is based on the multiplication of ma-trices X’Z, where X and Z are incidence mama-trices for management units (herd) and sire. The results of this method document only whether the set is connected but they do not provide any information on the degree of connectedness.
The degree of connectedness is determined by means of genetic drift variance (Kennedy and Trus, 1993). The method is based on the mul-tiplication of matrices X’ZAZ’X, where X is the incidence matrix of management units (herd-year-season), Z is the incidence matrix for animals and A is the relationship matrix. The matrix X’ZAZ’X measures the sum of genetic relationships within and between management units. Average relation- ships between and within management units (including the relationship of animal to itself ) Ā are obtained by dividing diagonal elements of X’ZAZ’X by the square of the number of records in the unit and off-diagonal elements by the prod-uct of the number of records in each of the units. The elements of Ā can be interpreted as the ge-netic components of drift variance and covari-ance between the management units (Sorensen and Kennedy, 1983). A simple measure resulting from Ā is to compute the genetic drift variance between management units that is given by:
GDVij = Āii+ Ājj – 2∙Āij,
where:
Āii(and/or Ājj) = the diagonal element of matrix Ā Āij = the off-diagonal element of matrix Ā.
Hanocq et al. (1996) investigated the simulation of changes in genetic gain and reliability of breeding value estimation in relation to the connectedness of subpopulations through sires. If the populations were not connected, it was not possible to deter-mine genetic differences between them. Clement et al. (2001) stated that the missing connectedness between herds distorted the estimation of breeding value because the effect of genotype and the effect of environment could not be distinguished. Simm et al. (2001) accentuated that the use of reference sires allowed across-herd genetic evaluation, high-er intensity of selection and highhigh-er rate of genetic gain. Lewis et al. (1999) reported that the stability of mutual connectedness of herds influenced the reliability of selection decisions. Lewis and Simm
(2000) also stated that the connectedness of herds increased the reliability of breeding value estima-tion and provided a higher number of candidates for selection. Johnson et al. (2002) optimised by stochastic simulation the sire referencing scheme in Texel breed in New Zealand. They drew a con-clusion that the highest selection gain could be achieved by the use of reference sires for insemi-nation of the best breeding ewes in the flock. The use of reference sires increased the reliability of breeding value estimation. For economic reasons artificial insemination was the most suitable meth-od for the use of reference sires. Kennedy and Trus (1993) reported that in the estimation of breeding value by animal model the connectedness between herds is reflected in the relationship matrix (A). The impact of data structure on the reliability of breeding value estimation was examined by Tosh and Wilton (1994); Přibyl and Přibylová (2001). The influence of sire referencing scheme on the reli-ability of breeding value estimation in beef cattle was investigated in various categories of animals in herds by Veselá et al. (2004).
The objective of the present paper is to evaluate the influence of reference sires on the estimation of breeding value and its reliability.
MATeRiAl And MeThod
The basic set for simulation was selected from the database of performance testing of beef breeds of cattle in the Czech Republic. Charolais was a used breed, and live weight at 120 days of age was an evaluated trait. The set comprised individuals with performance records from the years 1999–2003. Nine herds (76 HYS) of medium size were selected from the national database for subsequent simula-tions. There were 666 individuals with own per-formance, 380 dams, 52 sires, and the total number of all individuals including three generations of an-cestors in their pedigree was 1 793.
[image:3.595.308.531.726.755.2]Table 1 shows statistical characteristics of the basic set selected for simulations. The measured performance was from 71 kg to 266 kg, the average value being 173.40 kg.
Table 1. Characteristics of the basic set (recorded trait – live weight in kg at 120 days of age)
n Mean s Min. Max.
The first step of our study was to evaluate the degree of connectedness of the set.
For graphical representation we used the method of the multiplication of matrices X´Z, where X and Z are incidence matrices for management units (herd) and sire, proposed by Searle (1987).
The degree of connectedness was determined by means of genetic drift variance (GDV) that was cal-culated as the mean of GDV between the particular HYS (Kennedy and Trus, 1993).
Breeding value was calculated by a single-trait an-imal model according to the model equation that is used for routine estimation of breeding values from a field test of beef breeds in the Czech Republic (Přibyl et al., 2003):
yijkl = μ + si + Poj + Vk + gpijkl + gmijkl + peijkl + eijkl (1)
where:
yijkl = measured performance (weight at 120 days of
age)
si = group of contemporaries (herd – year – season) Poj = calf sex (young bulls, heifers/singles, twins) Vk = dam’s age at calving (less than three years, four, five
to seven years old, more than seven years)
gpijkl = an individual, breeding value for direct effect gmijkl = an individual, dam’s breeding value for maternal
effect; direct and maternal effect are correlated with each other with the joint relationship matrix
peijkl = permanent maternal environment
eijkl = random deviation
Effects of an individual (direct and maternal ones) and permanent maternal environment were used as random effects.
Population-genetic parameters that were substi-tuted in the computation of breeding values are shown in Table 2. The values were taken over from literature (Přibyl et al., 2003).
Breeding value was computed by a system of ma-trices in the SAS Software.
Reliability of the estimation of breeding value was computed from diagonal elements of the inverse of the left side of the matrix system (Henderson, 1984; Mrode, 1996):
σe2
r2i = 1 – C
ii–––– (2)
σG2
where:
r2i = reliability of breeding value estimation for direct or
maternal effect
Cii = diagonal element of the left side of the matrix
system after the inverse for an individual i (Cii = PEV/σe2)
σe = standard deviation for random uncontrolled
environ-ment
σG = standard deviation for direct (or maternal) genetic
effect
In the next step we simulated a single use of in-semination simulation in a 5-year interval within one generation and we generated the performance of calves added to the basic set. Every year 1 to 5 calves were added to the particular herds.
The generating of calves was divided into 3 vari-ants. In variant 1 calves whose sires were unidenti-fied were added. So the number of animals in the set increased but the added calves were not connected through the sire. In variant 2 the added calves were connected through 1–5 sires in each year of the birth of calves in the basic set (only one calf af-ter the sire into each herd). In variant 3 all added calves were connected only through one sire each year (independently of the number of added calves). Each year different sires were generated, which cor-responds to routine methods of breeding. The total number of generated calves was 45 after the addi-tion of 1 calf, and 225 after the addiaddi-tion of 5 calves. The generating of calves avoids inbreeding.
The performance of added calves was calculated according to equation 1, where the values calcu-lated from the basic set were substituted as fixed effects. The level of the effect of sex and dam’s age was selected randomly on the basis of the repre-sentation of the particular levels of these effects in the basic set.
Random effects were generated by means of random numbers using the Monte Carlo method (Brascamp, 1978; Gibson, 1995) according to these equations:
gpi = 0.5 × ail × σGD + 0.5 × ai2 × σGD +ai3 ×
√0.5 × σGD (3)
Table 2. Population-genetic parameters
Standard deviations substituted to the computation (in kg)
σGD 12.2
σGM 9.75
σPE 6.24
σe 14.13
Correlation between direct and maternal effect
rG –0.18
σGD = standard deviation for direct genetic effect; σGM = stan-dard deviation for maternal genetic effect; σPE = standard
deviation for permanent maternal environment; σe = standard deviation for random uncontrolled environment; rG = genetic
gmi = ai2 × rG × σGM + ai4 × √1 – rG2 × σ
GM (4)
pei = ai5 × σPE (5)
ei = ai6 × σe (6)
where:
gpi = breeding value of the i-th individual for direct effect (the sum of breeding values for direct effect of sire and dam and Mendelian sampling)
gmi = breeding value of the i-th individual’s dam for mater-nal effect
pei = permanent environment of the i-th individual’s
dam
ei = random uncontrolled environment of the i-th
indi-vidual
σGD = standard deviation for direct genetic effect σGM = standard deviation for maternal genetic effect σPE = standard deviation for permanent maternal
environ-ment
σe = standard deviation for random uncontrolled environ-ment
rG = genetic correlation between direct and maternal effect
ai1, ai2, ai3, ai4, ai5, ai6 = random numbers from normal
dis-tribution N(0, 1) for the i-th individual
Each variant was generated ten times for fixed effects, and within these ten generations again ten times for random effects. In total, 100 repeated generations for each variant were performed. The generation of random numbers was done in the SAS programme.
Breeding value and its reliability were computed for each generation and each variant.
We also examined deviations of breeding val-ues from the variant with the highest reliability of breeding value estimation that were computed from the values standardised per mean 0 and stand-ard deviation 1. Mean square error was computed
on the basis of estimated deviations and PEV (and/ or reliability of breeding value estimation) (Van Vleck, 1987).
MsE = (Bias)2 + PEV (7)
Correlations of breeding values of an offspring with mid-parent breeding values were computed for each variant.
ReSulTS And diSCuSSion
Connectedness of the set
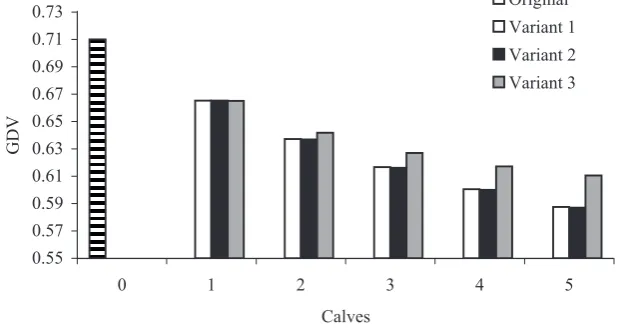
Graphical representation of herd connected-ness in the basic set through the particular sires is shown in Table 3. Numbers in the table represent the number of the offspring of a concrete sire in a concrete herd. This simple graphical method to rep-resent the connectedness of the set was proposed by Searle (1987). This method provides information whether the herds are or are not connected through sires, but it cannot be used for a quantitative ex-pression of the degree of connectedness. The table shows that the connectedness of herds is very low. Sires S1 to S48 contributed to the connectedness of herds H1 to H7. Herds H8 and H9 remain isolated from the aspect of genetic connectedness. A similar situation may be observed in the whole population. The aim of the use of reference sires was to improve herd connectedness.
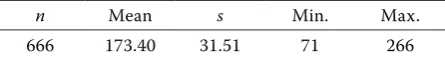
Figure 1 shows average genetic drift variance (GDV = 0.71) in the original set and in simulated sets according to the particular variants. Lower GDV values indicate higher connectedness of the set (Kennedy and Trus, 1993). At the same time, the higher the number of simulated added calves, the
0.55 0.57 0.59 0.61 0.63 0.65 0.67 0.69 0.71 0.73
0 1 2 3 4 5
Calves
G
D
V
Original Variant 1 Variant 2 Variant 3
[image:5.595.65.382.594.762.2]H1 H2 H3 H4 H5 H6 H7 H8 H9
S1 1 0 0 0 0 0 0 0 0
S2 3 0 0 0 0 0 0 0 0
S3 2 0 0 0 0 0 0 0 0
S4 33 0 0 0 0 0 0 0 0
S5 1 0 0 0 0 0 0 0 0
S6 1 0 0 0 0 0 0 0 0
S7 1 0 0 0 0 0 0 0 0
S8 16 0 0 0 0 0 0 0 0
S9 2 0 0 0 0 0 0 0 0
S10 2 2 1 0 0 0 3 0 0
S11 0 68 2 0 0 0 0 0 0
S12 0 2 0 0 0 0 0 0 0
S13 0 6 0 0 0 0 0 0 0
S14 0 2 0 0 0 0 0 0 0
S15 5 1 2 0 0 0 0 0 0
S16 1 0 1 0 21 12 0 0 0
S17 4 0 5 0 3 0 0 0 0
S18 1 0 2 0 0 0 0 0 0
S19 0 0 1 0 0 0 0 0 0
S20 0 0 17 0 0 0 0 0 0
S21 0 0 13 0 0 0 0 0 0
S22 0 0 12 0 0 0 0 0 0
S23 0 0 4 0 0 0 0 0 0
S24 0 0 1 0 0 15 0 0 0
S25 0 0 4 0 0 0 0 0 0
S26 0 0 2 0 0 0 0 0 0
S27 0 0 2 0 0 0 0 0 0
S28 0 0 3 0 0 0 0 0 0
H1 H2 H3 H4 H5 H6 H7 H8 H9
S29 0 0 5 0 0 0 5 0 0
S30 0 0 1 0 2 0 0 0 0
S31 0 0 4 0 2 0 0 0 0
S32 0 0 1 1 5 5 0 0 0
S33 0 0 0 69 0 0 0 0 0
S34 0 0 0 0 18 0 0 0 0
S35 0 0 0 0 16 0 0 0 0
S36 0 0 0 0 0 1 0 0 0
S37 0 0 0 0 0 46 0 0 0
S38 0 0 0 0 0 1 0 0 0
S39 0 0 0 0 0 2 0 0 0
S40 0 0 0 0 0 0 1 0 0
S41 0 0 0 0 0 0 1 0 0
S42 0 0 0 0 0 0 1 0 0
S43 0 0 0 0 0 0 8 0 0
S44 0 0 0 0 0 0 1 0 0
S45 0 0 0 0 0 0 1 0 0
S46 0 0 0 0 0 0 2 0 0
S47 0 0 0 0 0 0 12 0 0
S48 0 0 0 0 0 0 32 0 0
S49 0 0 0 0 0 0 0 33 0
S50 0 0 0 0 0 0 0 34 0
S51 0 0 0 0 0 0 0 11 0
S52 0 0 0 0 0 0 0 0 65
Graphical representation
H1–H9 = herd 1–9; S1–S52 = sire 1–52
[image:6.595.68.290.112.534.2]Number of the offspring of a concrete sire in a concrete herd
Table 3. Graphical representation of herd (H1–H9) connectedness across sires (S1–S52)
lower the GDV values, which increased the effec-tive number of sires’ offspring in the set. Kennedy and Trus (1993) reported that an increase in the relationship within HYS would cause an increase in
PEV (lower r2) while an increase in the relationship
between HYS would decrease PEV (higher r2). So
GDV is influenced by an increase in the relation-ship not only between HYS (decrease in GDV) but
also within HYS (increase in GDV). In our case, the highest values of GDV were reached in simulated variant 3, in which the relationship increased not only between HYS but also within HYS. The lowest values of GDV were in variant 2, where the relation-ship increased only between HYS (simulated calves after a reference sire did not have any half-sibs in HYS). From the aspect of the degree of
connected-Table 4. Reliability of breeding value estimation for direct effect in the basic set
n Mean s Min. Max.
Whole set 1 793 0.1107 0.1057 0.0000 0.5560
Calves with own performance 666 0.2244 0.0547 0.0494 0.3458
[image:6.595.62.532.684.756.2]ness the use of a higher number of reference sires with a lower number of offspring in herds seems the most suitable.
Reliability of breeding value estimation
The reliability of breeding value estimation for direct effect in the basic set (Table 4) ranged from
r2 = 0 to r2 = 0.556 with the mean r2 = 0.1107.
The reliability of breeding value estimation for maternal effect in the basic set (Table 5) was in
the range from r2 = 0 to r2 = 0.3899 with the mean
r2 = 0.0938.
A single-trait animal model was used because of computation simplicity. In the routine estimation of breeding value a multi-trait model is applied and the reliability of breeding values is therefore higher (Přibyl et al., 2003).
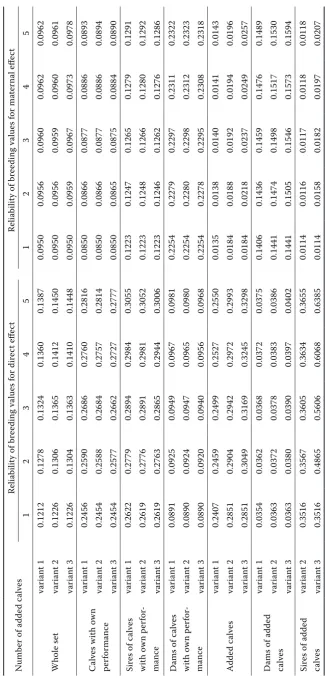
Table 4 shows the mean values of reliability of breeding value estimation for direct effect com-puted in the basic set. The whole set was divided into three parts (calves with own performance, sires of calves with own performance, dams of calves with own performance). The highest average reli-ability was found out in sires of calves with own
performance (r2 = 0.2382), somewhat lower was
the reliability in calves with own performance
(r2 = 0.2244) and dams of calves with own
perform-ance had the lowest reliability (r2 = 0.0836). The
highest amount of information for the estimation of breeding value was available for sires of calves with own performance and calves with own perform-ance. Only a limited amount of information on the performance of their offspring was available for dams of calves with own performance, therefore their reli-ability of breeding value estimation was the lowest. Presented coefficients of reliability of breeding values were calculated from the performance of one generation. For this reason parents are evalu-ated mainly according to their progeny. More gen-erations are evaluated in routine and parents have their breeding values estimated also according to own performance. Resulting reliability of parents’ breeding values is the combination of own and progeny performance. Therefore the reliability of breeding values of parents will be higher than that of calves with own performance in practice.
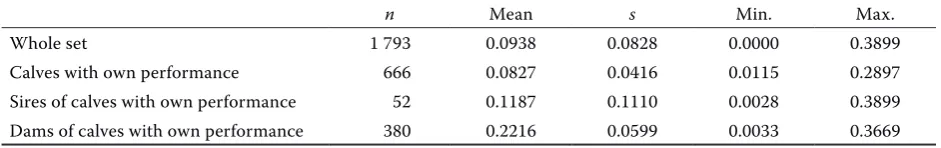
Table 5 shows the mean values of the reliability of breeding value estimation for maternal effect. The reliability of breeding value estimation is markedly higher for dams of calves with own performance
(r2 = 0.2216) where information on the
perform-ance of their offspring is available.
[image:7.595.63.534.103.177.2]Table 6 presents estimated coefficients of the reli-ability of breeding values for direct and maternal
Table 5. Reliability of breeding value estimation for maternal effect in the basic set
n Mean s Min. Max.
Whole set 1 793 0.0938 0.0828 0.0000 0.3899
Calves with own performance 666 0.0827 0.0416 0.0115 0.2897
Sires of calves with own performance 52 0.1187 0.1110 0.0028 0.3899 Dams of calves with own performance 380 0.2216 0.0599 0.0033 0.3669
0.000 0.001 0.002 0.003 0.004 0.005 0.006 0.007
1 2 3 4 5
Calves
D
ev
ia
tio
ns
o
f t
he
re
lia
bi
lit
y
[image:7.595.68.369.578.752.2]Variant 2 Variant 3
effect for different variants of simulation in the whole set and in selected subsets. The size of the set increased with the number of simulated and added calves, and it also led to an increase in the coefficient of reliability. This is the reason why the sets with the identical number of generated calves are always compared with each other in the fol-lowing analyses.
Figure 2 illustrates the deviation of the reliability of breeding value estimation in variant 2 and 3 from simulated unconnected variant 1 for direct effect in the whole set (basic set + generated ani-mals). Obviously, the increase in reliability was almost identical in variant 2 and 3 compared to variant 1, where the simulated calves were not connected through the sire. Figure 2 also docu-ments the slightly lower reliability of breeding value in variant 3 than in variant 2. It is explained by the lower effective number of sires’ offspring (Van Vleck, 1987) than in variant 3. These results
confirm the results obtained by GDV computa-tion (Figure 1).
Results will be different if we evaluate only calves with own performance from the basic set (Figu- re 3). The reliability of breeding value in connected variants 2 and 3 was slightly lower compared to un-connected variant 1, which can be explained again by a decrease in the effective number of offspring. Variations in the reliability of breeding value esti-mation for maternal effect documented the same tendency.
The absolute value of the reliability of breeding value estimation increased with the increasing number of individuals included in the evaluation. Figure 3 shows that the reliability of breeding values for individuals that were not directly connected through the sire (basic set) was more markedly in-fluenced by the effective number of sires’ offspring than by the own higher connectedness of herds. The addition of unrelated individuals into the basic -0.0045
-0.0040 -0.0035 -0.0030 -0.0025 -0.0020 -0.0015 -0.0010 -0.0005 0.0000
1 2 3 4 5
Calves
D
ev
ia
tio
ns
o
f t
he
re
lia
bi
lit
y
Variant 2 Variant 3
Figure 3. Deviations of the reliability of breeding value estimation for direct effect from variant 1 (basic set – cal-ves with own performance) in relation to the number of added calves
0.000 0.010 0.020 0.030 0.040 0.050 0.060 0.070 0.080
1 2 3 4 5
Calves
D
ev
ia
tio
ns
o
f t
he
re
lia
bi
lit
y
[image:8.595.64.426.84.257.2]Variant 2 Variant 3
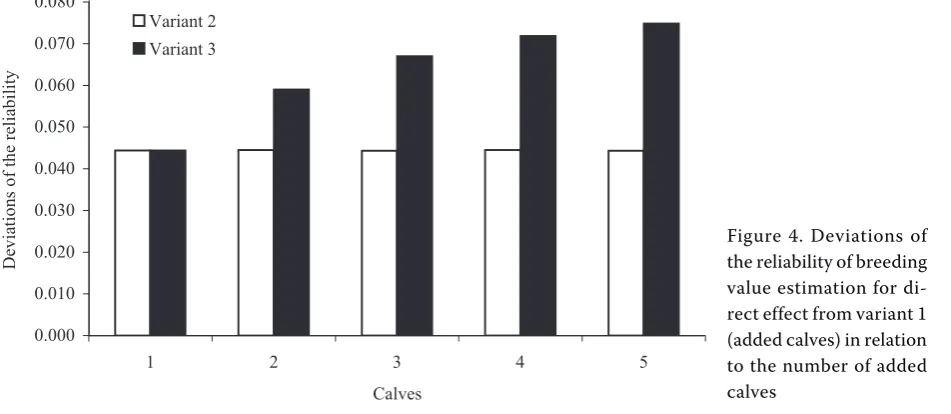
Figure 4. Deviations of the reliability of breeding value estimation for di-rect effect from variant 1 (added calves) in relation to the number of added calves
[image:8.595.67.543.557.764.2]set (variant 1) leads to a more marked increase in the effective number of offspring than the addition of individuals into the basic set that are mutually related through the sire.
On the contrary, in added individuals the result-ant reliability of breeding value estimation was nec-essarily influenced substantially by an increase in the connectedness of herds through the sire and by an increase in the number of half-sibs (Figu- re 4). The highest reliability of breeding value es-timation for direct effect was determined in calves with four half-sibs through the sire in the herd (variant 3 with five added calves). Their value of reliability coefficient was 0.33, i.e. much higher than in calves of the basic set. Similarly, the sires of added calves have the markedly higher reliability of breeding value estimation for direct effect than the sires of calves of the basic set.
deviation in breeding values estimation
Another consequence of the use of reference sires we observed was the fluctuation of estimated breeding values. As the simulation was done on data from performance testing, we do not know the real breeding values of animals. The fluctuation of breeding values may be assessed only in relative terms on the basis of estimated values.
Tables 7 and 8 show the mean values of breeding value estimation for direct or maternal effect com-puted in the basic set for the particular subsets.
The correlations of breeding values of the basic set estimated for the particular variants were high (0.99 and more).
[image:10.595.67.531.102.162.2]We examined deviations of breeding values from the variant with highest reliability of breeding value estimation – variant 2 with 5 added calves. Breeding
Table 7. Breeding value for direct effect in the basic set
n Mean s Min. Max.
Calves with own performance 666 –0.20 7.28 –28.23 19.73
[image:10.595.65.534.194.254.2]Sires of calves with own performance 52 0.49 6.72 –21.74 16.94 Dams of calves with own performance 380 –0.32 4.34 –18.72 10.26
Table 8. Breeding value for maternal effect in the basic set
n Mean s Min. Max.
Calves with own performance 666 0.03 3.32 –11.48 9.59
Sires of calves with own performance 52 0.25 4.30 –11.86 13.40 Dams of calves with own performance 380 0.36 5.61 –18.26 16.33
0.0 0.5 1.0 1.5 2.0 2.5
0 1 2 3 4 5
Calves
%
S
D
Original Variant 1 Variant 2 Variant 3
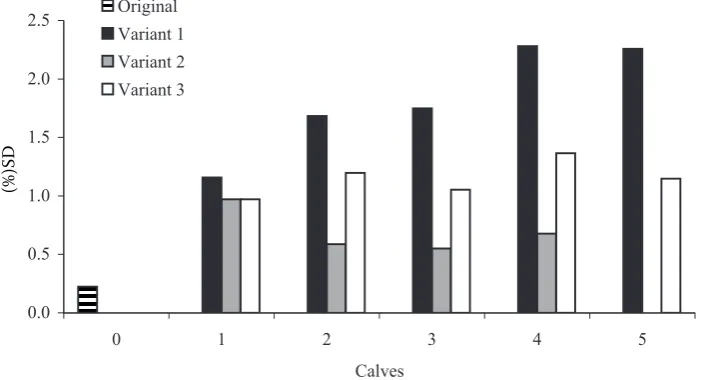
Figure 5. Deviations of standardised breeding values for direct effect from the variant with the highest reliability of breeding value estimation (variant 2 with 5 added calves) in the set of calves with own performance related to the standard deviation of breeding value for direct effect
(%
)S
[image:10.595.68.421.518.708.2]values were standardized per mean 0 and standard deviation 1. Figure 5 illustrates the mean absolute deviations of standardised breeding values for di-rect effect of the particular variants from variant 2 with five added calves in the set of calves with own performance. Each value was calculated as the mean of 100 repeated generations, which should eliminate random fluctuations to a large extent. The largest deviations were in variant 1. The deviations ranged from 1.15 to 2.28%. Deviations increased with the number of added calves. Deviations of variant 3 were lower (0.97–1.36%). The deviations of breeding value estimation for maternal effect had a similar pattern like the deviations of breed-ing value estimation for direct effect. The addition of unrelated calves (variant 1) relatively decreased the connectedness of the whole set, which led to a distortion of the estimation of breeding values, and
consequently, to a larger fluctuation of estimated breeding values.
In Figure 6 the deviations of breeding values and reliability of breeding value estimation in the set of calves with own performance are summarised by means of MSE estimation (Van Vleck, 1987). As in our case the data are derived from a real set, we do not know the real breeding values, and so the devia-tions of breeding values and also MSE are related to the variant with the highest reliability of breed-ing value (variant 2 with five added calves) only in relative terms. The deviation of breeding values and MSE may be caused by many influences. In our case, when we use the same model equation for all vari-ants and random variations in breeding values of generated added calves are minimised by a multiple replication, MSE may be induced mainly by a change in the structure of the set. The highest MSE was 0
0.01 0.02 0.03 0.04 0.05 0.06
0 1 2 3 4 5
Calves
M
SE
Original Variant 1 Variant 2 Variant 3
0.0 0.1 0.2 0.3 0.4 0.5 0.6 0.7 0.8 0.9 1.0
0 1 2 3 4 5
Calves
C
or
re
la
tio
n
[image:11.595.67.441.87.273.2]Original Variant 1 Variant 2 Variant 3
[image:11.595.75.481.544.757.2]determined in variant 1, when only the number of individuals increased, without any connectedness.
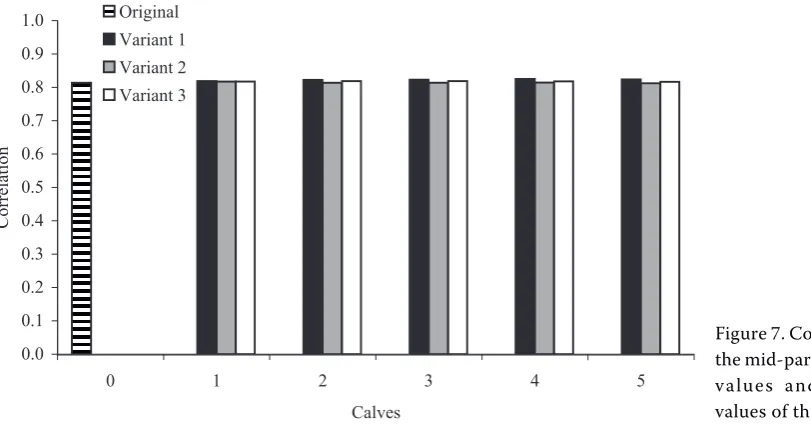
Figure 7 illustrates the correlations of mid-par-ent breeding values with the breeding value of off-spring in the set of calves with own performance as an alternative expression of standard deviations of Mendelian sampling that are represented in Figure 8 (Miglior and Van Doormaal, 2000). The breeding val-ue of an offspring should approximate the mid-par-ent breeding value as much as possible. Differences between the expected and estimated breeding value are caused by Mendelian sampling with variance (
0.5 × σ2
G) and by the error of breeding value
estima-tion. The graphs do not document any significant differences between the variants. The correlations ranged from the value (0.81) for the original set to the value (0.82) for variant 1 with the addition of five calves. These values indicate that the model used in practice for the estimation of breeding value of a field test makes it possible to predict the breeding value of an offspring from the parents’ breeding value with reliability approximately 0.66.
In our study we simulated a single use of reference sires within a five-year period of one generation. So reference sires connected the particular herds in one generation only, not in the succession of several generations. On the contrary, the majority of the papers dealing with this subject simulated insemination by reference sires in the succession of several generations. Hanocq et al. (1996) simulated insemination across 7 generations. The reliability of breeding value estimation increased as a result of high connectedness through reference sires in the successive generations.
ConCluSion
A single use of reference sires in one generation aimed at the connectedness of herds led to a slight increase in the average reliability of breeding value from 0.121 to 0.145 (by 2.4%) in the whole set. This increase from 0.241 to 0.33 (by 8.9%) was recorded only in animals that were directly con-nected through reference sires. Higher reliability was mainly a result of the increased number of contemporaries. An indirect consequence of the increased connectedness of the set and higher use of reference sires in insemination was a decrease in the effective number of sires’ offspring. This is the reason why an increase in the connectedness of the set influenced the reliability of breeding value of the whole set less than we would expect. The use of reference sires had an explicit influence on the fluctuation of breeding values. Complete evaluation of the impact of reference sires on estimated breeding value could be done only if we knew real breeding values of animals in the simulated set.
The use of a higher number of reference sires in insemination with only one offspring in each of the connected herds appeared as the most suitable ap-proach from the aspect of the connectedness of the set and reliability of breeding value estimation.
The use of insemination to make herds connected only in one generation is insufficient. A marked in-fluence of herd connectedness on the estimation of breeding value and its reliability, and on the result of breeding, is to be expected after reference sires have been used in several successive generations. 0.0
0.1 0.2 0.3 0.4 0.5 0.6 0.7 0.8 0.9 1.0
0 1 2 3 4 5
Calves
SD
(k
g)
[image:12.595.68.421.84.291.2]Original Variant 1 Variant 2 Variant 3
RefeRenCeS
Brascamp E.W. (1978): Methods of economic optimization of animal breeding plans. Research Institute for Animal Husbandry Schoonoord. Zeist, Raport B-134, 117 pp. Clement V., Bibe B., Verrier E., Elsen J.M., Manfredi E.,
Bouix J., Hanocq E. (2001): Simulation of model ade-quacy and data structure on the estimation of genetic parameters for traits with direct and maternal effect. Genet. Sel. Evol., 33, 369–395.
Gibson J.P. (1995): An introduction to the design and economics of animal breeding strategies. University of Guelph, Canada, 224 pp.
Hanocq E., Boichard D., Foulley J.L. (1996): A simulation study of the effect of connectedness on genetic trend. Genet. Sel. Evol., 28, 67–82.
Henderson C.R. (1984): Application of linear models in animal breeding. University of Guelph, Press, 462 pp. Johnson P.L., Sherlock R.G., Lopez-Villalobos N., Garrick
D.J., Blair H.T. (2002): Optimisation of breeding scheme design for the New Zealand texel sire referencing scheme. 7th WCGALP Montpellier, Communication, 02–08.
Kennedy B.W., Trus D. (1993): Considerations on genetic connectedness between management units under an-imal model. J. Anim. Sci., 71, 2341–2352.
Lewis R.M., Simm G. (2000): Selection in sire referencing scheme in sheep. Livest. Prod. Sci., 67, 129–141. Lewis R.M., Crump R.E., Simm G., Thomson R. (1999):
Assessing connectedness in across-flock genetic evalu-ation. In: Proc. Brit. Society of Animal Science, 121 pp. Meyer K. (1992): Variance components due to direct and
maternal effects for growth traits of Australian beef cattle. Livest. Prod. Sci., 31, 179–204.
Meyer K. (2001): Estimates of direct and maternal cov-ariance functions for growth of Australian beef calves from birth to weaning, Genet. Sel. Evol., 33, 487–514. Miglior F., Van Doormaal B.J. (2000): Impact of Second
Country Proofs on Genetic Evaluations. Interbull Bul-letin, 25, 57–59.
Mrode R.A. (1996): Linear models for the prediction of animal breeding value. CAB International, Wallingford, 187 pp.
Přibyl J., Přibylová J. (2001): Expected reliability of cow’s breeding value for average life-time milk production. Czech J. Anim. Sci., 46, 523–532.
Přibyl J., Misztal I., Přibylová J., Šeba K. (2003): Multiple-breed, multiple-traits evaluation of beef cattle in the Czech Republic. Czech J. Anim. Sci., 48, 519–532. Přibylová J., Vostrý L., Veselá Z., Přibyl J., Bohmanová J. (2004):
Breeding value for own growth of beef bulls in perform-ance-test station. Anim. Sci. Paper Rep., 22, 97–103. Robinson O.W. (1981): The influence of maternal effects
on the efficiency of selection: a review. Livest. Prod. Sci., 8, 212–137.
Searle S.R. (1987): Linear model for unbalanced data. John Wiley and Sons, New York. 560 pp.
Simm G., Lewis R.M., Collins J.E., Nieuwhof G.J. (2001): Use of sire referencing scheme to select for improved carcass composition in sheep. J. Anim. Sci., 79, 255–259. Sorensen D.A., Kennedy B.W. (1983): The use of the
re-lationship matrix to account for genetic drift variance in the analysis of genetic experiments. Theor. Appl. Genet., 66, 217.
Šafus P., Přibyl J., Veselá Z., Vostrý L., Štípková M., Stád-ník L. (2006): Selection indexes for bulls of beef cattle. Czech J. Anim. Sci., 51, 285–298.
Tosh J.J., Wilton J.W. (1994): Effect of data structure on variance of prediction error and accuracy of genetic evaluation. J. Anim. Sci., 72, 2568–2577.
Van Vleck L.D. (1987): Contemporary groups for genetic evaluations. J. Dairy Sci., 70, 2456–2464.
Veselá Z., Přibyl J., Vostrý L., Štolc L. (2004): Effect of sire referencing scheme on reliability of the breeding value estimation in beef cattle. Anim. Sci. Paper Rep., 22, 151–157.
Veselá Z., Přibyl J., Šafus P., Vostrý L., Šeba K., Štolc L. (2005): Breeding value for type traits in beef cattle in the Czech Republic. Czech J. Anim. Sci., 50, 385–393.
Received: 2007–01–02 Accepted after corrections: 2007–05–25
Corresponding Author