One of the basic conditions for the profitable breeding of dairy cows is their high and periodic fertility. Over the last 20 years, the dairy industry has witnessed severe phenotypic declines in fertil-ity. In addition to this phenotypic decline, fertility has declined genetically. Selection for increased milk production, which is unfavourably correlated with fertility, has resulted in unfavourable genetic trends of fertility (Royal et al., 2002).
The milk production of cows correlates with their body condition and body condition scoring is a widely recommended method of evaluating the nutritional management of dairy cows. When the milk production peaks and the energy requirements exceed its intake, the cows go into the negative en-ergy balance (NEB) when they mobilize their lipid reserves, getting thinner, and lose their body condi-tion score (BCS) (Aeberhard et al., 2001a; Coffey
Supported by the National Agency for Agricultural Research (1G 46 086) and by the Grant Agency of the Ministry of Education, Youth and Sports of the Czech Republic (MSM 6046070901 and MSM 6007665806).
Relationships among body condition score, milk yield
and reproduction in Czech Fleckvieh cows
F. Jílek
1, P. Pytloun
2, M. Kubešová
2,3, M. Štípková
2, J. Bouška
2, J. Volek
2,
J. Frelich
3, R. Rajmon
11Department of Veterinary Sciences,Faculty of Agrobiology, Food and Natural Resources,
Czech University of Life Sciences in Prague, Prague, Czech Republic
2Institute of Animal Science, Prague-Uhříněves, Czech Republic
3Department of Special Livestock Breeding, Faculty of Agriculture, University of South Bohemia in České Budějovice, České Budějovice, Czech Republic
ABSTRACT: The objective of this study was to confirm the relationship among body condition score at the time around parturition, milk yield in subsequent lactation, reproductive efficiency and BCS development in Czech Fleckvieh dairy cows. The BCS and milk yield were measured once a month and the cows were divided into groups according to their BCS before and after calving. Next, data from the database of cattle reproduction of the Czech Fleckvieh herd book were used. The dataset was analyzed by multifactorial analysis of variance using procedures COOR and GLM of the statistical program SAS. Cows with lower BCS in the 1st month after calving showed an increase in both milk yield and fat and protein corrected milk (FPCM) yield. No significant relationship was found between the BCS level before calving and subsequent milk yield. The body condition level in the last month before parturition influenced its subsequent decrease in the first phase of lactation. The group of cows with the highest BCS level before calving retained a high BCS level in the first five months of lactation. Adequately, the group of cows with the lowest BCS in the first month of lactation had the lowest BCS in the next four months. BCS before calving was not related to reproduction indicators, but the significant effect of BCS in the 1st month after calving on the length of calving to the first service interval was confirmed. The group of cows with BCS > 3.5 in the 1st month after calving had the most favourable reproduction indicators, also when the milk yield level was taken into account.
et al., 2002; Agenäs et al., 2003). Not all the cows reduce their BCS equally. The high genetic merit dairy cattle have a higher predisposition for mobili-zation of body fat reserves to cover milk production demands (Veerkamp, 1998; Pryce et al., 2002). This was demonstrated in cows selected for higher milk yield (Berry et al., 2003). These cows had lower BCS during lactation and their BCS changes af-ter calving were higher than in cows with lower genetic merit (Buckley et al., 2000; Horan et al., 2005). Thus, mobilization of body fat reserves and milk production are closely related (Pryce et al., 2002). These findings were confirmed by a study by Gallo et al. (1996), who observed a higher and more prolonged BCS loss in cows with higher milk yield. Therefore, BCS and milk yield are in a negative correlation (Veerkamp and Brotherstone, 1997), and high-yielding dairy cows generally have a lower BCS (Pryce et al., 2001).
A decrease in BCS post partum depends not only on the milk yield level but also on the BCS level at calving. Cows probably have a physiologi-cal target level for body reserves in early lacta-tion (Garnsworthy and Topps, 1982). Therefore Garnsworthy (2007) presumed that cows fatter at calving would tend to lose more body fat than thin-ner cows. This process is related to the daily milk yield curve, which is almost exactly opposite to the energy balance (Banos et al., 2004). The shape of the BCS profile depends on the animal’s genetic target BCS, its predisposition to partition nutri-ents between milk production and nutrition and differences between animals in feed conversion efficiency (Garnsworthy, 2007).
Both the duration and severity of NEB were re-ported to influence reproduction (Beam and Butler, 1999). Other authors also observed these relation-ships at the level of different reproduction indica-tors. Rhodes et al. (2003) and Roche et al. (2007) examined the relationships between BCS at the time of calving and mating, negative energy bal-ance duration and reproduction. A higher BCS level before calving, at calving and during early lactation was associated with a higher probability of being detected in oestrus before the planned start of mat-ing and higher probability of bemat-ing mated after the first insemination. An inverse relationship between energy balance and days to resumption of ovarian activity was reported by Butler and Smith (1989) and DeVries et al. (1999). Roche et al. (2007) identi-fied relationships between body condition and re-production variables in pasture-based dairy herds.
In their study, reproductive performance was found to be significantly affected by BCS and its changes during lactation. Buckley et al. (2003) recorded only the effect of a very low nadir BCS (< 2.5) on the likelihood of pregnancy at first service. A number of other studies demonstrated a relationship be-tween body condition at calving and reproductive performance (Gearhart et al., 1990; Ruegg et al., 1992). The amount of energy reserves during late gestation, parturition and early lactation influences the length of postpartal anoestrus and the prob-ability of successful mating (Beam and Butler, 1999; Chagas et al., 2006). Generally, low BCS at any time during early lactation is associated with prolonga-tion of ovarian activity, low frequency of LH pulses, poor follicular response to gonadotropin stimula-tion, and with a decrease in the functional compe-tence of oocytes (Gearhart et al., 1990; Diskin et al., 2003). Ruegg et al. (1992) demonstrated increased reproductive problems in very fat or very thin high-yielding cows. Suriyasathaporn et al. (1998) found that cows with BCS < 3 required more time for conception than cows with higher BCS at calving. Markusfeld (1997) showed that primiparous cows with high BCS at calving experienced fewer days open.
Furthermore, in studies in which BCS has been reported to affect reproduction, there have been inconsistencies in the reported effect. For exam-ple, Waltner et al. (1993), Gillund et al. (2001) and Buckley et al. (2003) reported the absence of the ef-fect of BCS at calving on reproductive performance, whereas others (Markusfeld et al., 1997; Titterton and Weaver, 1999) reported a significant effect. Certain other studies did not confirm these rela-tionships. For example, Ruegg and Milton (1995) reported no effect of BCS on reproduction indica-tors. Other investigators also failed to verify this re-lationship (Waltner et al., 1993; Ruegg and Milton, 1995). Gillund et al. (2001) reported no effect of BCS at calving on reproduction, either. In their study, BCS at calving was not related to the repro-duction indexes (conception to first service, calving to 1st insemination interval, calving to conception interval and number of AI per conception).
the frequency of BCS measurement, the model of analysis, the definitions of both the BCS and re-productive parameters investigated, and variation in the parameters within the sample population (Roche et al., 2007).
The above-mentioned findings were obtained mostly in Holstein cattle, but a few studies exist in dual-purpose cattle, for example Gillund et al. (2001) in Norwegian cattle under conditions of Norway and Aeberhard et al. (2001a) in Brown Swiss and Simmental × Red Holstein under Swiss conditions. It is necessary to verify these obser-vations in order to recommend body condition scoring as a method of evaluating nutritional and reproduction management of dairy cows in dual-purpose cattle.
The objective of this study was to determine the relationship between body condition score at the time around parturition and milk yield in sub-sequent lactation – whether higher BCS before calving is associated with higher BCS loss during lactation, whether high-yielding cows lose more BCS and whether BCS around the time of parturi-tion influences reproductive efficiency.
MATERIAL AND METHODS
The experiment was performed in 2002–2004 in two herds of Czech Fleckvieh cattle, both regis-tered in the Czech Fleckvieh herd book. More than 1 000 cows were included in the study and the aver-age milk yield in both herds was more than 6 500 kg of milk with 4.1% of fat and 3.35% of protein per cow and year.
During the experiment, the milk performance control was performed by a technician of the Czech Breeders’ Association at monthly inter-vals. In the same week (control period), the body condition score was measured (by the same asses-sor) according to a five-point scale (1 = thin cow, 5 = overconditioned cow). This methodology has been recommended by the European Association of Fleckvieh Cattle Breeders. Next, data from the milk and reproduction performance database of the Czech Fleckvieh herd book were used. The milk yield for each cow was adjusted to kilograms of 3.8% fat and 3.2% protein – Fat and Protein Corrected Milk (FPCM) for more accurate representation.
The basic dataset created from the obtained data contained 1 085 Czech Fleckvieh cows. The main hypothesis was tested: whether the body condition
or its changes during lactation influence the repro-duction performance of animals. During the experi-ment, the following traits were investigated: – BCS 1 month before calving
– BCS from the 1st month after calving, then regu-larly in monthly intervals until the 5th month of lactation
– calving to first service interval in days – calving to conception interval in days – number of services per conception – first service to conception interval in days – interval between services in days
– milk yield in the first five months of lactation – FCPM yield in the first five months of
lacta-tion
On the basis of the analysis of relationships between BCS in different lactation periods and reproduction indicators, 2 datasets were created according to BCS 1 month before and 1 month after calving. These datasets were subsequently sorted into groups according to the level of BCS. Only those cows which had all the observed traits were included in these groups. Therefore, the number of animals in these groups is considerably lower than in the basic dataset.
Groups of cows according to BCS before calving: A group: BCS < 4
B group: BCS = 4 C group: BCS > 4
Groups of cows according to BCS after calving: AA group: BCS < 3.5
BB group: BCS = 3.5 CC group: BCS > 3.5
The dataset was analyzed by multifactorial analy-sis of variance (Rasch and Mašata, 2006) using the procedures COOR and GLM through the statistical program SAS, version 8.1. (SAS, 2001). The follow-ing basic models with fixed effects were used for subsequent estimation:
yijk = μ + HYSi + Aj + Bk + α (x – –x) + eijk
where:
μ = average value of dependent variable
HYSi = fixed effect of i-herd – year – season of calving
Aj = fixed effect alternatively: (a) BCS level 1 month before calving; (b) BCS level 1 month after calv-ing
Bk = effect of lactation number
yijk = μ + HYSi + Aj + Bk + α(x – –x) + β(x – –x) + eijk
where:
μ = average value of dependent variable
HYSi = fixed effect of i-herd – year – season of calving
Aj = fixed effect of BCS level 1 month after calving Bk = fixed effect of lactation number
α(x – –x) = regression on the age at the first calving
β(x ––x) = regression on milk yield 1 month after calving eijk = residual effect (random error)
Residual Pearson’s correlation coefficients were used to estimate the closeness of the relationship – r.
RESULTS AND DISCUSSION
Population and herd characteristics
The experiment was conducted as an investiga-tion on two farms with Czech Fleckvieh cow herds.
Free box housing was used on both farms, and the animals were fed a total mixed feed ration. The characteristics of basic indicators of milk and re-production performance for both herds are shown in Table 1.
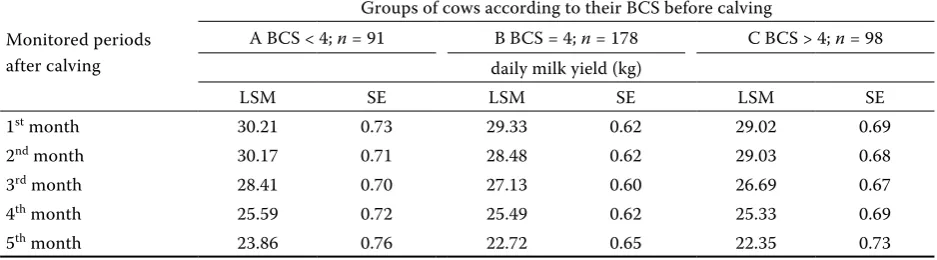
The objective of the first part of this study was to determine the relationships between the BCS level 1 month before calving and the level of milk yield in subsequent lactation. The results are shown in Table 2. The highest milk performance was re-corded in group A (cows with the lowest BCS before calving: BCS < 4) in each of the monitored periods. However, the differences were not statistically sig-nificant.
[image:4.595.67.531.408.542.2]For a more accurate description of energy output via milk, the milk yield was adjusted to the standard amount of fat and protein (FPCM). The results with the use of FPCM are similar and are shown in Ta-ble 3. Again, the highest milk yield was recorded in the cows with the lowest BCS, but these results were not statistically significant, either.
Table 1. Basic characteristics of herds
Indicator Herd I Herd II
Meantime (days) 397.00 399.00
Average milk yield (kg) 7 651.00 6 003.00
Average milk fat (%) 4.28 3.86
Average milk protein (%) 3.45 3.24
Calving to first service interval (days) 72.10 72.20
Calving to conception interval (days) 91.80 109.80
First service to conception interval (days) 39.60 37.00
Number of inseminations per conception 1.50 2.02
Table 2. Relationships between the BCS level in the last month of gestation and average daily milk yield in the particular monitored periods of lactation
Monitored periods after calving
Groups of cows according to their BCS before calving
ABCS < 4; n = 91 BBCS = 4; n = 178 CBCS > 4; n = 98 daily milk yield (kg)
LSM SE LSM SE LSM SE
1st month 30.21 0.73 29.33 0.62 29.02 0.69
2nd month 30.17 0.71 28.48 0.62 29.03 0.68
3rd month 28.41 0.70 27.13 0.60 26.69 0.67
4th month 25.59 0.72 25.49 0.62 25.33 0.69
5th month 23.86 0.76 22.72 0.65 22.35 0.73
[image:4.595.63.532.600.730.2]Table 3. Relationships between the BCS level in the last month of gestation and average daily FPCM yield in the particular monitored periods of lactation
Monitored periods after calving
Groups of cows according to their BCS before calving
A BCS < 4; n = 91 B BCS = 4; n = 178 C BCS > 4; n = 98 daily FPCM yield (kg)
LSM SE LSM SE LSM SE
1st month 31.23 0.88 31.09 0.76 30.50 0.84
2nd month 31.91 0.87 30.18 0.74 31.17 0.83
3rd month 29.89 0.83 28.51 0.71 28.98 0.79
4th month 27.13 0.81 27.56 0.69 27.63 0.77
5th month 26.11 0.88 24.47 0.76 24.31 0.84
[image:5.595.71.534.393.519.2]no significant differences between LSM in rows (P > 0.01)
Table 4. Relationships between the BCS level in the 1st month of lactation and average daily milk yield in the
par-ticular monitored periods of lactation
Monitored periods during lactation
Groups of cows according to their BCS 1st month after calving
AA BCS < 3.5; n = 134 BB BCS = 3.5; n = 236 CC BCS > 3.5; n = 159 daily milk yield (kg)
LSM SE LSM SE LSM SE
1st month before c. 30.86a 0.56 29.05b 0.51 28.34b 0.55
2nd month after c. 29.98a 0.55 28.45b 0.50 27.91b 0.54
3rd month after c. 28.48a 0.54 26.49b 0.49 25.43b 0.53
4th month after c. 26.20a 0.55 24.87b 0.50 23.80b 0.54
5th month after c. 23.80a 0.59 22.32b 0.54 21.92b 0.58
a,bfigures with the same superscripts in rows do not differ significantly (P < 0.01)
Table 5. Relationships between the BCS level in the 1st month of lactation and average daily FPCM yield in the
particular monitored periods of lactation
Monitored periods during lactation
Groups of cows according to their BCS 1st month after calving
AA BCS < 3.5; n = 134 BB BCS = 3.5; n = 236 CC BCS > 3.5; n = 159 daily FPCM yield (kg)
LSM SE LSM SE LSM SE
1st month before c. 32.33a 0.67 30.64ab 0.61 30.04b 0.66
2nd month after c. 31.48a 0.65 30.00a 0.59 29.82a 0.64
3rd month after c. 30.05a 0.63 28.34b 0.57 27.25b 0.62
4th month after c. 27.71a 0.62 27.13ab 0.56 26.03b 0.61
5th month after c. 25.48a 0.65 23.81b 0.60 22.81b 0.65
a,bfigures with the same superscripts in rows do not differ significantly (P < 0.01)
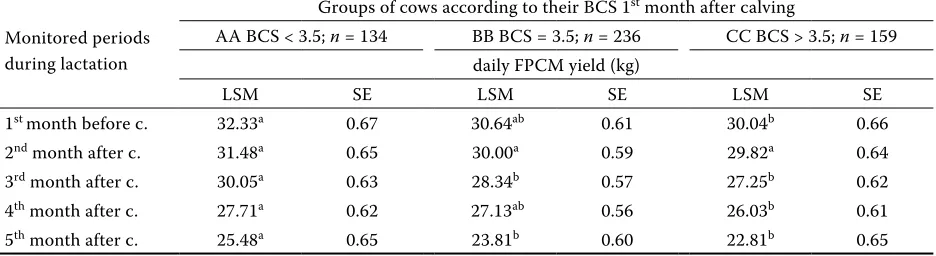
On the other hand, at evaluation according to the BCS level in the 1st month after calving, the effect of BCS was significant (Tables 4 and 5). At milk yield
[image:5.595.65.533.602.730.2]1.99 to 1.33 kg of milk, and from 3.05 to 1.88 kg of milk between groups AA and CC (BCS higher than 3.5 points). The differences between groups BB and CC were not statistically significant. At FPCM yield evaluation, the differences among the particular groups were not as distinct as in the previous case (Table 5). The AA group with the lowest BCS in the 1st month after calving showed the highest FPCM yield during the entire 5-month monitored period. Both the body condition and milk yield levels re-flect the energy state of the organism, which is con-nected with other factors (Domecq et al., 1997). In animals that are unilaterally selected for high milk performance, reduced BCS and higher BCS loss are assumed, because the correlated response in feed intake in early lactation can cover only 40–48% of the extra requirement (Buckley et al., 2003). Preferential re-partitioning of stored energy and substrates for milk synthesis is one of the most important characteristics of high-yielding cows
(Aeberhard et al., 2001b). The situation is similar in dual-purpose Czech Fleckvieh, although it is not so marked. Furthermore, Aeberhard et al. (2001a) did not record any differences in the BCS level between animals with lower or higher milk yield. On the contrary, Horan et al. (2005) reported that cows with lower milk yield had shown a higher BCS level during the entire monitored period (calving to BCS nadir). At BCS evaluation during early lactation it is primarily necessary to observe the changes which occur in this period (Christiaens et al., 2000). Cows that are genetically inclined to lose more BCS in early lactation tend to have higher yields of milk, fat and protein (Dechow et al., 2002). In their study, phenotypic correlations between the body condition loss and production traits (milk fat, protein, and yield) ranged from 0.06 to 0.1. Domecq et al. (1997) also referred to the effect of BCS loss during the first month of lactation on increased milk yield and this
relation-Table 6. Relationships between the BCS level in the last month of gestation and subsequent BCS development
Monitored periods after calving
Groups of cows according to their BCS before calving
A BCS < 4; n = 91 B BCS = 4; n = 178 C BCS > 4; n = 98 BCS after calving (points)
LSM SE LSM SE LSM SE
1st month 3.48a 0.07 3.56a 0.06 3.90b 0.07
2nd month 3.39a 0.08 3.49a 0.07 3.83b 0.08
3rd month 3.42a 0.09 3.49a 0.07 3.86b 0.08
4th month 3.50a 0.09 3.50a 0.07 3.88b 0.08
5th month 3.58a 0.09 3.64a 0.08 3.98b 0.09
[image:6.595.66.533.391.524.2]a,bfigures with the same superscripts in rows do not differ significantly (P < 0.01)
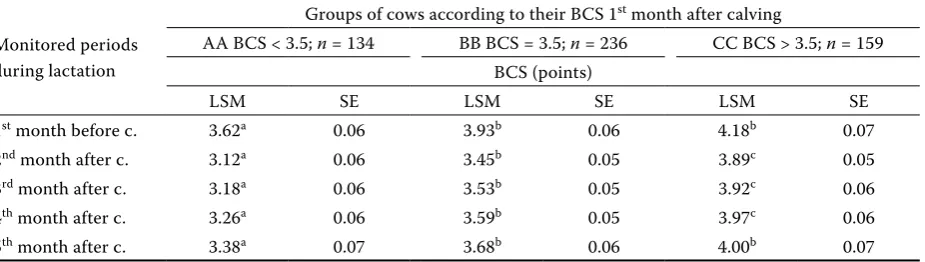
Table 7. Relationships between the BCS level in the 1st month of lactation and BCS development
Monitored periods during lactation
Groups of cows according to their BCS 1st month after calving
AA BCS < 3.5; n = 134 BB BCS = 3.5; n = 236 CC BCS > 3.5; n = 159 BCS (points)
LSM SE LSM SE LSM SE
1st month before c. 3.62a 0.06 3.93b 0.06 4.18b 0.07
2nd month after c. 3.12a 0.06 3.45b 0.05 3.89c 0.05
3rd month after c. 3.18a 0.06 3.53b 0.05 3.92c 0.06
4th month after c. 3.26a 0.06 3.59b 0.05 3.97c 0.06
5th month after c. 3.38a 0.07 3.68b 0.06 4.00b 0.07
[image:6.595.71.534.600.731.2]ship had a stronger association with milk yield than did prepartal BCS.
BCS development in the first 5 months of lac-tation in particular groups constructed according to the BCS level 1 month before calving, 1 month after calving, and 1 month after calving including the regression on the milk yield level is given in Tables 6, 7 and 8 respectively. The lowest values were recorded in the 2nd month of lactation and the cows with higher BCS around the time of calving were found to maintain this high BCS for the next 5 months at least.
It was not demonstrated in the present inves-tigation that the higher BCS before calving was associated with the greater BCS loss after calving or that the time to the BCS nadir occurrence was longer than in thinner cows. This may be the same situation as in the study by Gillund et al. (1999), who found considerably less subcutaneous fat in
dual-purpose Norwegian Cattle compared to fat deposits in Holstein dairy cows. Hence, the effect described by Garnsworthy (2007) has not been proved – cows fatter at calving tend to lose more body fat than thinner cows.
[image:7.595.69.534.119.259.2]Higher BCS after calving indicates a lower amount of its loss and this tendency is also evi-dent in subsequent months of lactation. Roche et al. (2007) stated that the BCS nadir was positively correlated with BCS at calving. Therefore cows with higher BCS after calving showed the lowest BCS loss. Identically, Kim and Suh (2003) reported that the recovery of BCS in cows with a marked condition loss was more delayed. Aeberhard et al. (2001a) stated that lower BCS loss and body condi-tion returned by week 40 to the values that were not significantly lower than those before parturi-tion in lower-yielding Swiss Brown cows than in Holsteins.
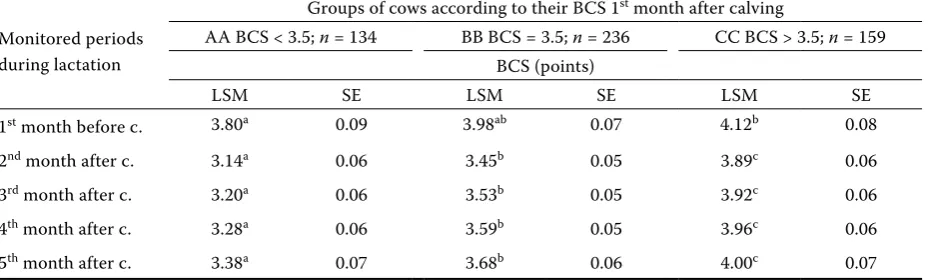
Table 8. Relationships between the BCS level in the 1st month of lactation and BCS development (regression on
milk yield 1 month after calving)
Monitored periods during lactation
Groups of cows according to their BCS 1st month after calving
AA BCS < 3.5; n = 134 BB BCS = 3.5; n = 236 CC BCS > 3.5; n = 159 BCS (points)
LSM SE LSM SE LSM SE
1st month before c. 3.80a 0.09 3.98ab 0.07 4.12b 0.08
2nd month after c. 3.14a 0.06 3.45b 0.05 3.89c 0.06
3rd month after c. 3.20a 0.06 3.53b 0.05 3.92c 0.06
4th month after c. 3.28a 0.06 3.59b 0.05 3.96c 0.06
5th month after c. 3.38a 0.07 3.68b 0.06 4.00c 0.07
[image:7.595.63.531.598.719.2]a,b,cfigures with the same superscripts in rows do not differ significantly (P < 0.01)
Table 9. Effect of BCS in the 1st month before and after calving on reproduction (F test)
BCS 1 month
before calving BCS 1 month after calving BCS 1
st month after calving + regression
on daily milk yield 1st month after calving
Calving to first service interval 0.45 5.46++ 4.61
Calving to conception interval 0.62 2.33 2.54
Number of services per conception 1.56 0.79 0.99
First service to conception interval 0.73 1.44 1.44
Interval between services 1.44 0.01 0.02
During the observation of relationships between the body condition of cows and their reproductive efficiency a significant effect of BCS on the length of calving to first service interval was determined (Table 9). However, BCS before calving had no sig-nificant effect on any of the observed reproduction indicators – calving to first service interval, calving to conception interval, number of artificial insemi-nations per conception, first service to conception interval and interval between services. It is obvious that the body condition score influences only the resumption of the oestrous cycle in dual-purpose cattle.
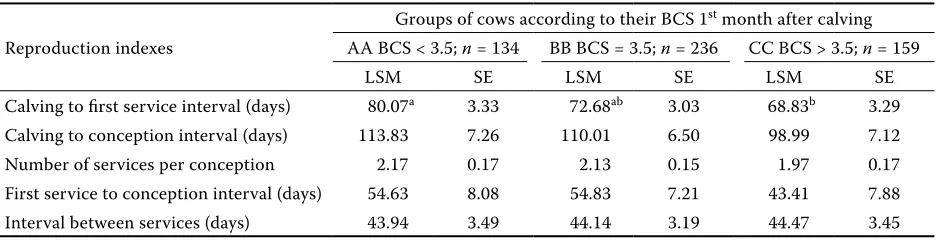
[image:8.595.66.534.101.222.2]No significant relationship was found between the body condition score 1 month before calving and reproduction indexes (Table 10). The most fa-vourable reproduction indicators were recorded in cows with BCS after calving higher than 3.5 points (Table 11). Their average length of calving to first service interval, calving to conception interval, and first service to conception interval was 68.83, 98.99 and 43.41 days, respectively. The average number of services per conception was 1.97. With a decreasing
BCS level, these indicators declined, the differences were 3.85 and 11.24 days; 11.02 and 14.84 days; 11.42 and 11.22 days for the length of calving to first service interval, calving to conception interval, and first service to conception interval in the BB and AA groups, respectively.
[image:8.595.65.536.289.409.2]Similarly, Gillund et al. (2001) reported that re-productive performance was not associated with BCS at calving in Norwegian Cattle. Nevertheless, the effect of BCS 1 month after calving should be considered as important because it indicates the BCS loss. In our study, the higher the BCS in this period (and thus the BCS loss post partum was low-er), the shorter the calving to first service interval and, with correction for milk production, the length of calving to conception interval as well (Table 9). The same results were reported by Refsdal (1989) and Suriyasathaporn et al. (1998). On the contrary, Gillund et al. (2001) did not demonstrate any re-lationship between the prolongation of calving to first service interval and higher BCS loss. However, they observed a longer calving to conception in-terval, decrease in the probability of conception at
Table 10. Relationships between the BCS level in the last month of gestation and reproduction indicators
Reproduction indexes
Groups of cows according to their BCS before calving A BCS < 4; n = 91 B BCS = 4; n = 178 C BCS > 4; n = 98
LSM SE LSM SE LSM SE
Calving to first service interval (days) 74.15 3.67 74.49 3.15 71.50 3.51 Calving to conception interval (days) 99.71 8.67 103.79 7.47 109.91 8.47 Number of services per conception 2.11 0.21 1.91 0.18 2.21 0.20 First service to conception interval (days) 41.41 9.23 45.33 8.06 52.96 8.82 Interval between services (days) 35.94 3.99 40.52 3.54 35.35 3.68
no significant differences between LSM in rows (P > 0.01)
Table 11. Relationships between the BCS level in the 1st month of lactation and reproduction indicators
Reproduction indexes
Groups of cows according to their BCS 1st month after calving
AA BCS < 3.5; n = 134 BB BCS = 3.5; n = 236 CC BCS > 3.5; n = 159
LSM SE LSM SE LSM SE
Calving to first service interval (days) 80.07a 3.33 72.68ab 3.03 68.83b 3.29
Calving to conception interval (days) 113.83 7.26 110.01 6.50 98.99 7.12 Number of services per conception 2.17 0.17 2.13 0.15 1.97 0.17 First service to conception interval (days) 54.63 8.08 54.83 7.21 43.41 7.88 Interval between services (days) 43.94 3.49 44.14 3.19 44.47 3.45
first service and an increased number of artificial inseminations per conception. These relationships were not confirmed in our study. Waltner et al. (1993) and Ruegg and Milton (1995) failed to dem-onstrate an association between BCS at calving and reproduction.
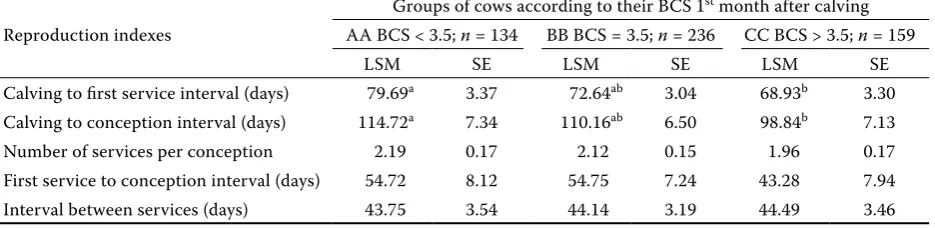
Because the differences in milk production among the groups of cows with different BCS were statistically significant and both BCS and reproduc-tion evaluareproduc-tion might be influenced by the level of milk yield, regression on the level of milk yield 1 month after calving was added. The results of this analysis are shown in Table 12. The trends be-tween BCS 1 month after calving and reproduction efficiency were sustained, even after taking into account the level of milk yield. The group of cows with BCS higher than 3.5 points showed the most favourable results again. This group had signifi-cantly shorter calving to first service and calving to conception intervals.
CONCLUSION
The objective of this study was to demonstrate the relationships among body condition score at the time around parturition, milk yield in subse-quent lactation, reproductive efficiency and BCS development in Czech Fleckvieh dairy cows. The relationship between BCS before calving and milk yield in the first 5 months of lactation was not demonstrated. On the contrary, cows with BCS lower than 3.5 points in the first month of lacta-tion showed the highest milk yield during the first 5 months of lactation. It could be caused by high-er mobilization of body reshigh-erves in high-yielding
cows. The body condition level in the last month before parturition influenced its subsequent de-crease in the first phase of lactation. The group of cows with the highest BCS level before calving retained a high BCS level in the first five months of lactation. The group of cows with the lowest BCS in the first month of lactation had the lowest BCS in the next four months. BCS before calving had no significant effect on reproduction indicators (calv-ing to conception interval, the number of services per conception, first service to conception interval, days between services). However, the significant effect of BCS in the 1st month after calving on the length of calving to first service interval was dem-onstrated. The cows with BCS higher than 3.5 had the shortest length of this indicator. Obviously, it is important to attend to the deposition of adequate prepartal body reserves in terms of the most fa-vourable reproduction indicators in dual-purpose cows. In this study, the higher BCS before calv-ing was associated with higher BCS after calvcalv-ing and those cows showed the shortest calving to first service interval.
Acknowledgement
The authors thank Mrs. Lois Russell for the lan-guage revision of this manuscript.
REFERENCES
[image:9.595.65.533.120.234.2]Aeberhard K., Bruckmaier R.M., Kuepfer U., Blum J.W. (2001a): Milk yield and composition, nutrition, body conformation traits, body condition scores, fertility Table 12. Relationships between the BCS level in the 1st month of lactation and reproduction indicators
(regressi-on (regressi-on milk yield 1 m(regressi-onth after calving)
Reproduction indexes
Groups of cows according to their BCS 1st month after calving
AA BCS < 3.5; n = 134 BB BCS = 3.5; n = 236 CC BCS > 3.5; n = 159
LSM SE LSM SE LSM SE
Calving to first service interval (days) 79.69a 3.37 72.64ab 3.04 68.93b 3.30
Calving to conception interval (days) 114.72a 7.34 110.16ab 6.50 98.84b 7.13
Number of services per conception 2.19 0.17 2.12 0.15 1.96 0.17 First service to conception interval (days) 54.72 8.12 54.75 7.24 43.28 7.94 Interval between services (days) 43.75 3.54 44.14 3.19 44.49 3.46
and diseases in high-yielding dairy cows – part 1. Jour-nal of Veterinary Medicine Series A, 48, 97–110. Aeberhard K., Bruckmaier R.M., Blum J.W. (2001b):
Metabolic, enzymatic and endocrine status in high-yielding dairy cows – part 2. Journal of Veterinary Medicine Series A, 48, 111–127.
Agenäs S., Burstedt E., Holtenius K. (2003): Effects of feeding Intensity during the dry period. 1. Feed intake, body weight, and milk production. Journal of Dairy Science, 86, 870–882.
Banos G., Brotherstone S., Coffey M.P. (2004): Evaluation of body condition score measured throughout lactation as an indicator of fertility in dairy cattle. Journal of Dairy Science, 87, 2669–2676.
Beam S.W., Butler W.R. (1999): Effects of energy balance on follicular development and first ovulation in post-partum dairy cows. Journal of Reproduction and Fer-tility, 54, 411–424.
Berry D.P., Buckley F., Dillon P., Evans R.D., Rath M., Veerkamp R.F. (2003): Genetic relationships among body condition score, body weight, milk yield, and fertility in dairy cows. Journal of Dairy Science, 86, 2193–2204.
Buckley F., Dillon P., Rath M., Veerkamp R.F. (2000): The relationship between genetic merit for yield and live weight, condition score, and energy balance of spring calving Holstein Friesian dairy cows on grass based systems of milk production. Journal of Dairy Science, 83, 1878–1886.
Buckley F., O’Sullivan K., Mee J.F., Evans R.D., Dillon P. (2003): Relationships among milk yield, body con-dition, cow weight, and reproduction in Spring-Calved Holstein-Friesians.Journal of Dairy Science, 86, 2308–2319.
Butler W.R., Smith R.D. (1989): Interrelationships be-tween energy balance and post partum reproductive function in dairy cattle. Journal of Dairy Science, 72, 767–783.
Coffey M.P., Simm G., Brotherstone S. (2002): Energy balance profiles for the first three lactations of dairy cows estimated using random regression. Journal of Dairy Science, 85, 2669–2678.
Dechow C.D., Rogers G.W., Clay J.S. (2002): Heritability and correlations among body condition score loss, body condition score, production and reproductive perform-ance. Journal of Dairy Science, 85, 3062–3070. De Vries M.J., Van Der Beek S., Kaal-Lansbergen L.
M.T.E., Ouweltjes W., Wilmink J.B.M. (1999): Modeling of energy balance in early lactation and the effect of energy deficits in early lactation on first detected estrus
post partum in dairy cows.Journal of Dairy Science, 82, 1927–1934.
Diskin M.G., Mackey D.R., Roche J.F., Sreenan J.M. (2003): Effects of nutrition and metabolic status on circulating hormones and ovarian follicle development in cattle. Animal Reproduction Science, 78, 345–370. Domecq J.J., Skidmore A.L., Lloyd J.W., Kaneene J.B.
(1997): Relationship between body condition sco- res and milk yield in a large dairy herd of high yield-ing Holstein cows. Journal of Dairy Science, 80, 101–112.
Gallo L., Carnier P., Cassandro M., Mantovani R., Bailoni L., Contiero B., Bittante G. (1996): Change in body condition score of Holstein cows as affected by parity and mature equivalent milk yield. Journal of Dairy Sci-ence, 79, 1009–1015.
Garnsworthy P.C. (2007): Body condition score in dairy cows: (eds.): Garnsworthy P.C., Wiseman J.. Targets for production and fertility, in recent advances in animal nutrition 2006. Nottingham University Press, Notting-ham, UK, 61–86.
Garnsworthy P.C., Topps J.H. (1982): The effect of body condition score at calving on their food intake and performance when given complete diets. Animal Pro-duction, 35, 113–119.
Gearhart M.A., Curtis C.R., Erb H.N., Smith R.D., Sniffen C.J., Chase L.E., Cooper M.D. (1990): Relationship of changes in condition score to cow health in Holsteins. Journal of Dairy Science, 73, 3132–3140.
Gillund P., Reksen O., Karlberg K., Randby A., Engeland I., Lutnaes B. (1999): Evaluation of a method for body condition scoring of Norwegian cattle. Norsk Veteri-naer Tidsskrift, 111, 623–532.
Gillund P., Reksen O., Grhn Y.T., Karlberg K. (2001): Body condition related to ketosis and reproductive perform-ance in Norwegian dairy cows. Journal of Dairy Sci-ence, 84, 1390–1396.
Horan B., Dillon P., Faverdin P., Delaby L., Buckley F., Rath M. (2005): The interaction of strain of Holstein-Friesian cows and pasture-based feed systems on milk yield, body weight, and body condition score. Journal of Dairy Science, 88, 1231–1243.
Chagas L.M., Rhodes F.M., Blache D., Gore P.J.S., Mac-Donald K.A., Verkerk G.A. (2006): Precalving effects on metabolic responses and post partum anestrus in grazing Primiparous dairy cows. Journal of Dairy Sci-ence, 89, 1981–1989.
Christiaens A., Alvarez A., Marcine C., De Behr V., Hor-nick J.L., Istasse L. (2000): Dietary supplementation with protection factors during the dry period in dairy cows. In: 51 – the Annual Meeting of EAAP, 21–24. August, Hague. Book of the Abstracts, 6, 138 pp. Kim I., Suh G. (2003): Effect of the amount of body
subsequent body condition change, occurrence of post partum diseases, metabolic parameters and reproduc-tive performance in Holstein dairy cows. Therio- genology, 60, 1445–1456.
Markusfeld O., Galon N., Ezra E. (1997): Body condition score, health, yield and fertility in dairy cows. Veteri-nary Records, 141, 67–72.
Pryce J.E., Coffey M.P., Simm G. (2001): The relationship between body condition score and reproductive per-formance. Journal of Dairy Science, 84, 1508–1515. Pryce J.E., Coffey M.P., Brotherstone S.H., Woolliams J.A
(2002): Genetic relationship between calving interval and body condition score conditional on milk yield. Journal of Dairy Science, 85, 1590–1595.
Rasch D., Mašata O. (2006): Methods of variance com-ponent estimation. Czech Journal of Animal Science, 41, 227–235.
Refsdal A.O. (1989): Animal health service and reproduc-tive problems in Norwegian cattle. Reproduction in Domestic Animals, 33, 223–226.
Rhodes F.M., Chagas L.M., Clark B.A., Verkerk G.A. (2003): Effect of dietary intake on steroid feedback on release of luteinising hormone in ovariectomized cows. Reproduction, Fertility and Development, 15, 11–17. Roche J.R., MacDonald K.A., Burke C.R., Lee J.M., Berry
D.P. (2007): Associations among body condition score, body weight, and reproductive performance in Sea-sonal-Calving dairy cattle. Journal of Dairy Science, 90, 376–391.
Royal M.D., Pryce J.E., Woolliams J.A., Flint A.P.F. (2002): The genetic relationship between commencement of luteal activity and calving interval, body condition score, production, and linear type traits in Holstein-Friesian dairy cattle. Journal of Dairy Science, 85, 3071–3080.
Ruegg P.L., Goodger W.J., Holmberg C.A., Weaver L.D., Huffman M.E. (1992): Relation among body condition score, serum urea nitrogen and cholesterol concentra-tions, and reproductive performance in high producing
Holstein dairy cows in early lactation. American Jour-nal of Veterinary Research, 53, 10–14.
Ruegg P.L., Milton R.L. (1995): Body condition scores of Holstein cows on Prince Edward Island, Canada: rela-tionships with yield, reproductive performance, and disease. Journal of Dairy Science, 78, 552–564. SAS (2001): Retease 8.2. (TS2MO) of the SAS Sys-
tem for Microsoft Windows. SAS Institute Inc.,
Cary, NC.
Suriyasathaporn W., Nielen M., Dieleman S.J., Brand A., Noordhuizen-Stassen E.N., Schukken Y.H. (1998): A Cox proportional-hazards model time dependent co-variates to evaluate the relationship between body condition score and risk of first insemination and preg-nancy in high – producing dairy herd. Preventive Vet-erinary Medicine, 37, 159–172.
Titterton M., Weaver L.D. (1999): The relationship be-tween body condition at calving, uterine performance
post partum and trends in selected blood metabolites
post partum in high yielding Californian dairy cows. In: Fertility in the High-Producing Dairy Cow, Occa-sional Publication, British Society of Animal Science No. 26. M.G. Diskin, ed. British Soc. Animal Science, Edinburgh, UK, 335–339.
Veerkamp R.F., Brotherstone S. (1997): Genetic correla-tions between linear type traits, food intake, liveweight and condition score in Holstein Friesian cattle. Animal Science, 64, 385–392.
Veerkamp R.F. (1998): Selection for economic efficiency of dairy cattle using information on live weight and feed intake: A review. Journal of Dairy Science, 81, 1109–1119.
Waltner S.S., McNamara J.P., Hillers J.K. (1993): Relation-ships of body condition score to production variables in high producing Holstein dairy cattle. Journal of Dairy Science, 76, 3410–3419.
Received: 2008–04–10 Accepted after corrections: 2008–06–18
Corresponding Author