generally, it is possible to state that the objective of the rational owner, respectively management is the profit maximization with minimal inputs applying, that means costs. This objective can be defined as an op-timizing task the solution of which could be achieved by applying the linear programming methods, that means the non-parametric approach or by econometric methodology – parametric approach. common sign for both mentioned approaches is production frontier quantification. While parametric approach assume that we know explicit estimation of production
func-tion but we do not know its parameters, results of non-parametric approach are estimated measures of technical efficiency which reflect on the company’s position either on the production frontier in case of an effective company, or under the frontier in case of an inefficient company.
We focused our research on the non-parametric approach application to estimate the companies’ efficiency which is known as the Data Envelopment Analysis (DEA). The DEA reaches good results on small extents of the analysed companies and in case
The returns to scale analysis in the basic industry
enterprises in the Slovak Republic
Analýza výnosov z rozsahu v podnikoch poľnohospodárskej
prvovýroby v Slovenskej republike
Peter BIELIK, Daniela HUPKOVÁ, Matúš VADOVIČ, Natália TURČEKOVÁ
Department of Economics, Faculty of Economics and Management, Slovak
University of Agriculture in Nitra, Nitra, Slovakia
Abstract: The analysis in field of the returns of scale is an important indicator which denotes if it is effective for the ana-lyzed companies to increase the input exploitation to expand the production program with the aim to reach higher profits than invested inputs. According to this reason, the objective of the research is the analysis of return to scale in the basic in-dustry enterprises in the Slovak republic. During the whole analysed period, there was estimated the most numerous group of companies which occurred in the area of decreasing returns to scale. This fact confirmed that the total input exploitation in agricultural companies is in a higher measure not profitable, because in comparison with production inputs, lower prof-its were reached. on the basis of these results, it is not possible to exactly estimate which inputs are indispensable to opti-mize (for a more specific estimation, it is necessary to apply the non-radial DEA methods), despite the fact that there was evidently confirmed the low measure of input profitability.
Key words: Data Envelopment Analysis (DEA), returns to scale, agricultural enterprises, basic industry
Abstrakt: Analýza oblasti výnosov z rozsahu je dôležitým ukazovateľom, ktorý vypovedá o tom, či je pre súbor analyzova-ných podnikov výhodné rozširovať využívanie vstupov na rozšírenie výrobného programu s cieľom dosiahnuť vyššie výnosy ako vložené vstupy. z uvedeného dôvodu bola cieľom príspevku analýza výnosov z rozsahu v podnikoch poľnohospodárskej prvovýroby v Sr. Počas celého skúmaného obdobia bola odhadnutá najpočetnejšia skupina podnikov, ktoré sa nachádzali v oblasti klesajúcich výnosov z rozsahu. Tento odhad potvrdil, že celkové využívanie vstupov v poľnohospodárskych pod-nikoch je v značnej miere nerentabilné, pretože v porovnaní so vstupmi do výrobného procesu sa dosahovali nižšie výnosy. na základe týchto výsledkov nie je možné presne odhadnúť, ktoré vstupy je nevyhnutné optimalizovať (pre presnejší odhad by bolo nevyhnutné použiť neradiálne metódy DEA), napriek tomu bola evidentne potvrdená nízka rentabilita vkladaných vstupov.
of the combination with proper statistical tools; it can answer the questions dealing with the compa-nies’ efficiency.
The theoretical background of technical efficiency analysis was set by Koopmans (1951) who defined technical efficiency as the permissible variation in-put/output vector in which it is technically not pos-sible to increase any output (or to reduce any input) without the simultaneous reduction of other output or increasing other input. Later Farrell (1957) derived input oriented indexes of technical efficiency expressed by the radial reduction of all inputs at the given level of outputs. These indexes were later the inspiration for charnes et al. (1978), Banker et al. (1984) and Fähre et al. (1985, 1994) who established the DEA. The DEA is the technique of the estimation of the convex data envelope of the analysed producers, which means the production possibility frontier allowed the relative efficiency calculation of all analysed producers. This technique became very popular for the technical ef-ficiency estimation because it allowed with a simple method to consider the transformation of more inputs into more outputs. it is a non-parametric approach and it does not require input prices and is does not need to define the type of producer’s behaviour.
The period of the last years is in the field of the efficiency analysis characterised by new models and methods development as well as by many applica-tions in different branches of economy. With regard to the solved issues, a major attention was paid to the empiric applications based on the radial and ad-ditive models which examine technical efficiency at the companies’ level in the conditions of the Slovak agriculture. The mentioned approach was applied by Mathijs et al. (1999), Sojková (2001), Bielik and rajčániová (2004) and others.
There exist many opinions on the relation between productivity development (efficiency) and legal forms in transition economies. Petrick and Weingarten (2004) maintain a position that the countries in which there remain sustainable companies with a large area of cultivated land from the centrally planed economy period, but which simultaneously adapted their organizational structure to the new system and optimized the number of employees, reach a higher efficiency measure.
The process of the stabilisation and production and productivity growth started in the year 2004 after the accession of the new member states into the EU by reduction of the number employees in agriculture, the creation of new institutions and the market relations stabilisation (Swinnen and Vranken 2005).
With the aim to prove that private farms are more efficient than cooperatives, Mathijs and Vranken
(2001) estimated the technical efficiency measure of the analysed companies in Bulgaria and hungary based on the DEA. They stated that there is a gradual increase of the technical efficiency of cooperatives which are adapting to the market economy condi-tions. Private farms reached lower levels of technical efficiency in the fields which had a higher measure of production uncertainty.
Bielik and rajčaniová (2004) analysed technical efficiency of Slovak agricultural companies with the non-parametric methodology DEA. The objective of research was to estimate the reached measure of technical efficiency and returns to scale for the indi-vidual companies as well as for the selected groups of companies. The results show that the highest number of technically efficient firms according to the constant and variable returns to scale was located in the group of companies with the land area 500 hectares and less. Similar results were reached also by curtiss (2000) on the sample of the czech agricultural companies.
Thiele and Brodersen (1999) analysed on the basis of the DEA the differences between farm productivity in the East and West germany. Farms in the West germany reached a higher average technical efficiency measure comparing with the East german farms. The East german farms were characterized by a higher variability of the TE what can be explained by the differences in the managerial skills achieved during the transformation process.
A fast new technologies introduction into the pro-duction process is important mainly from the reason of cost reduction per unit of production what is in-creasing the short-term profit of the company which is realizing this process (hanzell and haddad 2001). But the empirical evidences indicate that the regions or countries which did not utilize the production growth possibilities by adopting new technologies are loosing the competitiveness on the global level. on the country level that means that the increase of the agriculture productivity impacts positively the decline of food prices and that is establishing the place for industrial goods and services consumption which will be exhibited by the economic growth increase.
MATERIAL AND METHODS
The base file comprised subjects active in the agri-cultural basic industry and the file was divided into two sub-files due to the different accountancy. in the year 2007, there were in sub-file Legal Entities (LE) integrated 1 365 companies, in the proportion: 539 agricultural cooperatives (Ac), 820 business com-panies (Tc) and 6 state enterprises. Legal Entities farmed 1 422 360 hectares of agricultural land (the average per one company is 1 042 ha of agricultural land, for Ac it is 1 363 ha, for Tc it is 835 ha, for state enterprises 490 ha).
into sub-file independently operating Farmers, there were included 1 144 farmers which farmed 146 493 ha of agricultural land. The average area of cultivated land is 128 ha per one independently operating Farmer.
into the analysed file, there were included all legal entities and independently operating farmers which farmed more than 40 ha of agricultural land, declared more than 20 head of cattle or the combination of cattle breeding and farming on agricultural land, as well as the companies farming without land or with a small area of land, but in the sector of intensive animal breeding.
independently operating farmers incorporated in the analysed data file represented 7.45% from the subjects which received payments in 2007 (15 532 subjects). The share of legal entities in the total number of subjects receiving payments in the year 2007 was 8.89%, but they are farming more than three quarters of the authorized area for all agricultural subjects in Slovakia.
From the fundamental data file, there was in the next step by the random choice drawn up the panel data for the period 1999–2007 which comprised 338 legal entities and 83 independently operating farmers, so that it incorporates the proportional representation of subjects farming in all regions in Slovakia, the frequency of subjects in the individual regions was also considered. The analysed data file was redeemed from the subjects counting extreme values of variables applied in the analysis which will affect the total results.
Radial models of the DEA
The technical efficiency is a convenient measure to compare the production efficiency of group of companies. The advantage of this measure compared to the partial efficiency indicators is the possibility of more input and output application by the companies measurement.
Koopmans (1951) defined the input-output vector technical efficient only in case if an increase of any
output or a decline of any input is possible only under the conditions of the decline of other output or the increase of other input.
Farrell (1957) developed the radial technical effi-ciency which is comparing the vector of the concrete firms’ inputs with the production function on which there are placed the efficient companies. The final value of technical efficiency is in the interval (0, 1) and interprets as the efficiency of input utilization of the concrete company. A firm will be efficient if it reduces inputs by 1 with fixed outputs.
The technical efficiency estimation could be done on the basis of the parametric methods of the Stochastic Production Functions (SFA) which were presented by Aiger et al. (1977) and the non-parametric methods of the Data Envelope Analysis (DEA) which were worked out by charnes et al. (1978). The advantage of the DEA comparing with the SFA is the independ-ence of the functional form of production function. The basis of the DEA models is the production func-tion estimafunc-tion with linear programming. The basic DEA model assuming constant returns to scale (DEA crS) is solving the subsequent tasks of mathematical programming
minθ, λθ –yi + Yλ3 0 θxi + Xλ3 0
λ3 0 (1)
where yi and yi are values of outputs and inputs, Y and X are matrixes of outputs and inputs, Θ scalar and λ vector of constants N × 1.
Subsequently Banker et al. (1984) developed the DEA model which was adjusted to the technical efficiency estimation (DEA VrS). With this model, there was reached the possibility to compare companies operat-ing in different areas of return to scale and from this reason, the model was modified to this equation minθ, λθ
–yi + Yλ ≥ 0 θxi + Xλ ≥ 0 N1’λ = 1
λ ≥ 0 (2)
where yi and yi are values of outputs and inputs, Y and X are matrixes of outputs and inputs, Θ scalar and λ vector of constants N × 1.
The condition N1’λ = 1 assigns the comparison of companies’ efficiency only with those groups of com-panies which have a similar input vector structure.
interprets the relative company efficiency. Another advantage of the radial DEA model is its independence of the used measure units. on the other hand, the biggest disadvantage is the principle of the individual input reduction to reach the efficiency.
relative efficiency of the radial DEA model is in the interval <0, 1>, where the coefficient value 1 means that company is identified as efficient. The difference (1 – coefficient of efficiency) means the value of how much the company has to reduce inputs to be efficient.
RESULTS AND DISCUSSION
According to the fact, that in data file there are, besides legal entities, also represented the independ-ently operating farmers, there was ere selected for the reason of a limited monitoring of the individual variables in accounting statements of the primary producers group, just one output for the technical efficiency estimation – the total revenues (incomes), and three inputs – total assets, cultivated land ac-cording LPiS and total costs (expenditures). By
se-lecting inputs and outputs, there were, besides the data availability, also considered the approaches of other authors who examined technical efficiency in the group of agricultural companies (Mathijs and Vranken 2001; Swinnen and Vranken 2005).
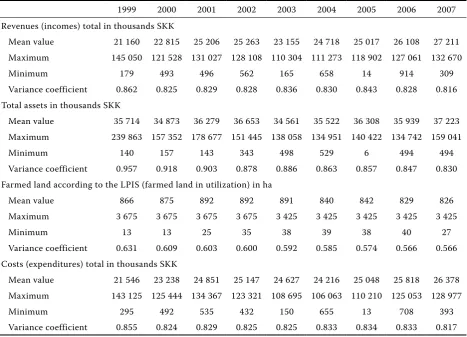
The development of individual variables which were used for the technical efficiency measures as well as of their individual components, as inputs and outputs, is reported in Table 1.
Significant changes, which had finally influenced the total production process efficiency, were recorded in the event of total revenues/incomes, which as the output were significantly influenced by external fac-tors, mainly weather conditions during the individual years of the analysed period. The increase of the total assets was during the period after the accession the Slovak republic into the EU connected with the investment increase which rose during the analysed period due to the realized projects co-financed by the EU funds.
[image:4.595.64.532.411.748.2]During the analysed period, there continued an increase of input prices into agriculture mostly due to the increase of the prices of feeds, seeds, fertilizers and agents to protect crops. The new technologies
Table 1. Descriptive statistics of output and inputs for the whole analysed data file during the period 1999–2007
1999 2000 2001 2002 2003 2004 2005 2006 2007
revenues (incomes) total in thousands SKK
Mean value 21 160 22 815 25 206 25 263 23 155 24 718 25 017 26 108 27 211 Maximum 145 050 121 528 131 027 128 108 110 304 111 273 118 902 127 061 132 670
Minimum 179 493 496 562 165 658 14 914 309
Variance coefficient 0.862 0.825 0.829 0.828 0.836 0.830 0.843 0.828 0.816 Total assets in thousands SKK
Mean value 35 714 34 873 36 279 36 653 34 561 35 522 36 308 35 939 37 223 Maximum 239 863 157 352 178 677 151 445 138 058 134 951 140 422 134 742 159 041
Minimum 140 157 143 343 498 529 6 494 494
Variance coefficient 0.957 0.918 0.903 0.878 0.886 0.863 0.857 0.847 0.830 Farmed land according to the LPiS (farmed land in utilization) in ha
Mean value 866 875 892 892 891 840 842 829 826
Maximum 3 675 3 675 3 675 3 675 3 425 3 425 3 425 3 425 3 425
Minimum 13 13 25 35 38 39 38 40 27
Variance coefficient 0.631 0.609 0.603 0.600 0.592 0.585 0.574 0.566 0.566 costs (expenditures) total in thousands SKK
Mean value 21 546 23 238 24 851 25 147 24 627 24 216 25 048 25 818 26 378 Maximum 143 125 125 444 134 367 123 321 108 695 106 063 110 210 125 053 128 977
Minimum 295 492 535 432 150 655 13 708 393
Variance coefficient 0.855 0.824 0.829 0.825 0.825 0.833 0.834 0.833 0.817
introduction (in crop production) was, on the other hand, connected with the declining usage of propel-lants as well as in savings of operating costs. general, there was not reached any significant decrease of operating costs and according to these facts, the total costs/expenditures increased during the whole analysed period.
Returns to scale analysis of the examined companies file
As it was mentioned, the analysis in the field of economies of scale is an important indicator which denotes if it is effective for the analyzed companies to increase the input exploitation to expand the pro-duction program with the aim to reach higher profits than the invested inputs.
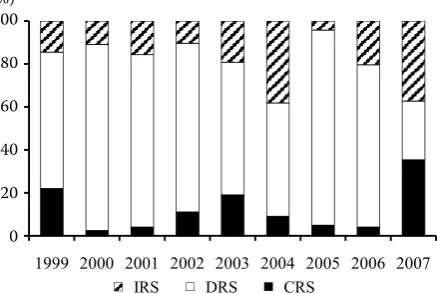
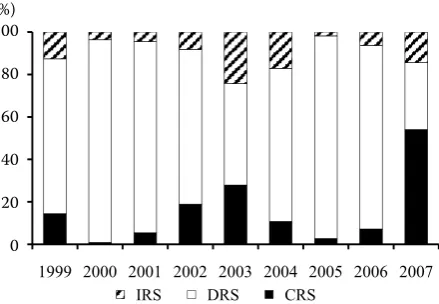
in the Figure 1, there are represented percentage differentiations of companies in the individual groups according to the returns to scale during the analysed period 1999–2007.
During the analysed period, there was estimated the most numerous group of companies which were located in the area of decreasing returns to Scale (DrS). This estimation confirmed that the total input utilization in agricultural companies is considerably inefficient because by the increased inputs, there were reached lower revenues. According to these results, it is not possible to exactly estimate which inputs are indispensable to optimize (for a more exact estimation, it is necessary to apply the non- radial DEA methods). in spite of it, there was confirmed the low profitability of inputs.
The exception was the years 2004 and 2007, dur-ing which the percentage share of companies with increasing returns to scale (irS) increased. This fact can be explained by increasing realization prices of
agricultural products and by the increase of produc-tion profitability (particularly in the year 2007).
According to this fact, we can assume that the majority of agricultural producers are realizing own production under the level of producing costs.
Returns to scale analysis of the individual companies groups
To apply a more detailed analysis, the data file was examined according to the criteria which are based on the individual authors’ researches dealing with differentiation of agricultural companies.
The first criterion was the legal form of company. According to this criterion, the companies were di-vided into individually operating farmers, agricultural cooperatives and business companies. The second criterion was the production orientation. The data file was divided into three groups: companies oriented on crop production, animal breeding and combined production. The companies were divided according to the share of the revenues from crop and animal production in the total revenues. into the group oriented on crop production, there were included the companies with minimally 75% revenues from crop production, into the group oriented on animal breeding, there were included companies with more than 75% revenues from animal production. The remaining companies were included into the group with combined production.
other criteria were the companies’ size according to the cultivated arable land area and the number of employees. The last criterion was the firms’ catego-rization into groups according to the climatic and natural conditions into the companies operating in the LFA and non-LFA areas.
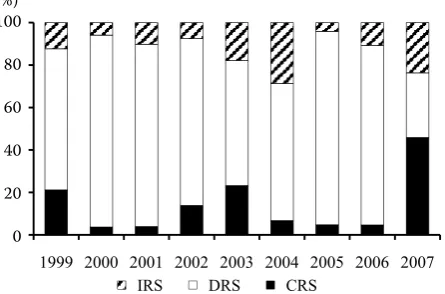
in the research, we analysed the percentage dif-ferentiation of companies into the individual groups according to the returns to scale during the ana-lysed period 1999–2007. The first anaana-lysed group included companies differentiated according to the legal form. results of this analysis are recorded in the Figure 2–4.
Based on this graph, it is evident that the individual legal forms are differently classified according to the returns to scale. The group of individual operat-ing farmers obtained the highest fluctuation in this group. This fact was probably caused by the lower representation in the total data file.
[image:5.595.69.288.573.720.2]Agricultural cooperatives obtained in the long term a stabile classification in the area of decreas-ing returns to scale. By this fact, there was partially confirmed the assumption that cooperatives need Figure 1. returns to Scale development in the analysed
data file
Source: own calculations
0% 20% 40% 60% 80% 100%
1999 2000 2001 2002 2003 2004 2005 2006 2007
IRS DRS CRS
100
80
60
40
20
firstly to restructure the whole production process and after that to begin with the increase of produc-tion based on investments. This negative trend was partly caused by using old and inefficient assets in the production process.
Unlike the previous groups, in case of the business companies, there was evident the trend of the increas-ing number of companies in the area of increasincreas-ing
returns to scale. This trend was interrupted just in the year 2005 which was characterized with bad climate and weather conditions. These results unambiguously confirm that business companies are strongly oriented on the production process restructuring and in this group of companies, it is possible to expect a higher measure of investments and thereby an increase of production profitability. 40% 60% 80% 100% 0% 20% 40% 60% 80% 100%
1999 2000 2001 2002 2003 2004 2005 2006 2007
[image:6.595.66.291.187.341.2]IRS DRS CRS
Figure 2. returns to Scale development in the group of individual operating farmers
20% 40% 60% 80% 100% 0% 20% 40% 60% 80% 100%
1999 2000 2001 2002 2003 2004 2005 2006 2007
[image:6.595.312.531.191.340.2]IRS DRS CRS
Figure 3. returns to Scale development in the group of cooperatives 20% 40% 60% 80% 100% 0% 20% 40% 60% 80% 100%
1999 2000 2001 2002 2003 2004 2005 2006 2007
[image:6.595.68.290.374.529.2]IRS DRS CRS
Figure 4. returns to Scale development in the group of business companies 20% 40% 60% 80% 100% 0% 20% 40% 60% 80% 100%
1999 2000 2001 2002 2003 2004 2005 2006 2007
[image:6.595.311.530.383.528.2]IRS DRS CRS
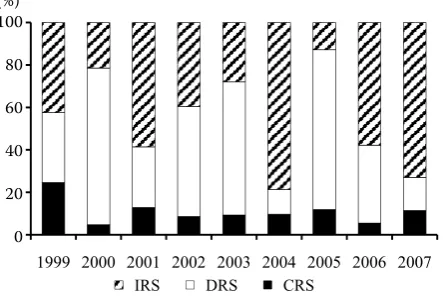
Figure 5. returns to Scale development in the group of crop production 20% 40% 60% 80% 100% 0% 20% 40% 60% 80% 100%
1999 2000 2001 2002 2003 2004 2005 2006 2007
IRS DRS CRS
Figure 6. returns to Scale development in the group of combined production 40% 60% 80% 100% 0% 20% 40% 60% 80% 100%
1999 2000 2001 2002 2003 2004 2005 2006 2007
IRS DRS CRS
Figure 7. returns to Scale development in the group of animal breeding
Source (for Figures 2–7): own calculations
[image:6.595.68.291.571.718.2] [image:6.595.309.528.574.717.2]Similarly as in the case of the companies differentia-tion according to the legal form, there were analysed also companies divided by the production orientation. This percentage differentiation of companies into the individual groups according to the returns to scale during the analysed period 1999–2007 is shown in the Figures 5–7.
The results are similar as in the analysis according to the legal form. The percentage differentiation ac-cording to the returns to scale was not unambiguous. While in the companies included into the group of animal and combined production, there was not sig-nificant any definite trend, in the case of companies oriented on crop production, there was recorded the transfer into the group with increasing returns to scale.
companies with crop and combined production are significantly sensitive to the realizing product prices because only in the years 2004 and 2007, there was registered higher transfer into the group with increas-ing returns to scale. Production restructurincreas-ing and a more efficient behaviour of the companies oriented
on crop production caused continuing the trend of the firms transfer into the group with increasing returns to scale.
categorization into the groups according to the returns to scale is appropriately verified also by the differentiation according to the area of cultivated land. Based on these results, it is possible to confirm that large companies have reserves in the increase of production; respectively smaller companies should increase production to reach the production level.
Based on the results of returnsto scale development in the group of companies according to the cultivated land area (Figures 8–9), we can state that the major-ity of companies over 1 000 ha belongs to the area of decreasing returns to scale and a further increase of inputs will not give an increase of profitability.
Unlike larger companies, the group of smaller firms showed reserves in the increase of production and profitability. in spite of that, it was not recorded as a significant trend as in the previous differentiation it is possible to assume that smaller companies should increase their production level and larger companies
Source (for Figures 8–11): own calculations
20% 40% 60% 80% 100%
0% 20% 40% 60% 80% 100%
1999 2000 2001 2002 2003 2004 2005 2006 2007
[image:7.595.66.290.377.529.2]IRS DRS CRS
[image:7.595.308.529.379.527.2]Figure 8. returns to Scale development in the group of companies up to 1 000 ha
Figure 9. returns to Scale development in the group of companies over 1 000 ha
Figure 11. returns to Scale development in the group of firms with more than 20 employees
Figure 10. returns to Scale development in the group of firms with less than 20 employees
20% 40% 60% 80% 100%
0% 20% 40% 60% 80% 100%
1999 2000 2001 2002 2003 2004 2005 2006 2007
IRS DRS CRS
20% 40% 60% 80% 100%
0% 20% 40% 60% 80% 100%
1999 2000 2001 2002 2003 2004 2005 2006 2007
IRS DRS CRS
20% 40% 60% 80% 100%
0% 20% 40% 60% 80% 100%
1999 2000 2001 2002 2003 2004 2005 2006 2007
IRS DRS CRS
100
80
60
40
20
0 (%)
100
80
60
40
20
0 (%)
100
80
60
40
20
0 (%)
100
80
60
40
20
[image:7.595.68.290.571.719.2] [image:7.595.308.529.572.718.2]should restructure production with the aim to increase the efficiency of inputs.
Similar results as in the companies according to the cultivated land area were obtained in the analysis based on the differentiation according to the number of employees. The percentage categorization is il-lustrated on Figures 10–11.
in comparison with larger companies, the ones with a lower number of employees reached a higher potential in the increase of production. only during the years with not favourable climate conditions, the smaller companies reached a decreasing percentage share in the group of firms with increasing returns to scale.
Figures 12–13 illustrate the percentage categoriza-tion into the groups according to the returns to scale based on the climatic and environmental conditions where the companies operated.
Unlike the previous results of the analyses com-panies, the categorization based on the climatic conditions has undergone other criteria. in the case of companies operating in favourable areas, there was evident the impact of the not favourable weather conditions what caused the decline of prof-itability. companies farming in less favoured areas reached the fluctuation in the categorization into increasing returns to scale what could indicate a non-balanced production structure and the firms aim is not the increase of profitability with increas-ing production.
CONCLUSION
During the analysed period, there was evaluated the most numerous group of companies which were located in the area of decreasing returns to Scale
(DrS). This evaluation confirmed that the total input utilization in agricultural companies is considerably inefficient because comparing the inputs, there were reached lower revenues. According to these results, it is not possible to exactly estimate which inputs are indispensable to optimize (for a more exact, it is necessary apply the non-radial DEA methods). in spite of it, there was confirmed the low profitability of inputs.
Based on the results, it is evident that the individual legal forms are differently classified according to the returns to scale. These results unambiguously con-firm that business companies are strongly oriented on the production process restructuring and in this group of companies, it is possible to expect a higher measure of investments and thereby an increase of the production profitability.
REFERENCES
Aiger D., Lovell c.A.K., Schmidt P. (1977): Formulation and estimation of stochastic frontier production function model. Journal of Econometrics, 6: 21–37.
Banker r.D., charnes A., cooper W.W. (1984): Some mod-els for estimating technical and scale inefficiences in Data Envelopment Analysis. Management Science, 30: 1078–1092.
Bielik P., rajčániová M. (2004): Scale efficiency of agricul-tural enterprises in Slovakia. Agriculagricul-tural Economics – czech, 50: 331–335.
charnes A., cooper W.W., rhodes E. (1978): Measuring the efficiency of decision making units. European Journal of operational research, 2: 429–444.
curtiss J. (2000): Technical Efficiency and competitive-ness of czech Agricultural Sector in Late Transition. humboldt University of Berlin.
100
80
60
40
20
[image:8.595.66.295.64.221.2]0 (%)
Figure 12. returns to Scale development in the non-LFA
group Figure 13. returns to Scale development in the LFA group
20% 40% 60% 80% 100%
0% 20% 40% 60% 80% 100%
1999 2000 2001 2002 2003 2004 2005 2006 2007
IRS DRS CRS
20% 40% 60% 80% 100%
0% 20% 40% 60% 80% 100%
1999 2000 2001 2002 2003 2004 2005 2006 2007
IRS DRS CRS
100
80
60
40
20
0 (%)
[image:8.595.311.531.67.219.2]Farrell M.J. (1957): The measurement of productive ef-ficiency. Journal of the royal Statistical Society, Series A, 120: 253–290, Part 3.
Fähre r., grosskopf S., Lovell c.A.K. (1985): The Meas-urement of Efficiency of Production. Kluwer-nijhoff Publishing, Dordrecht.
Fähre r., grosskopf S., Lovell c.A.K. (1994): Production Frontiers. cambridge University Press, new York. hazell P., haddad L. (2001): Agricultural research and
Poverty reduction, Food, Agriculture, and the Environ-ment. Discussion paper 34, iFPri/Technical Advisory committee of the cgiAr, Washington Dc.
Koopmans T.c. (1951): Analysis of production as an ef-ficient combination of activities. in: Koopmans T.c. (ed.): Activity Analysis of Production and Allocation. Wiley, new York.
Mathijs E., Blaas g., Doucha T. (1999): organisational form and technical efficiency of czech and Slovak farms. MocT-MoST, 9: 331–344.
Mathijs E., Vranken L. (2001): human capital, gender and organization in transition agriculture: Measuring and
explaining the technical efficiency of Bulgarian and hungarian farms. Post-communist Economies, 13: 171–187.
Petrick M., Weingarten P. (2004): The role of agriculture in central and Eastern European rural development: an overview. in: Petrick M., Weingarten P. (eds.): The role of agriculture in central and Eastern European rural development: engine of change or social buffer? Studies on the Agricultural and Food Sector in central and Eastern Europe, 25: 1–20.
Sojková z. (2001): Assessment of cooperatives efficiency using stochastic parametric approach. Agricultural Economics – czech, 47: 361–364.
Swinnen J.M.F., Vranken L. (2005): causes of Efficiency change in Transition: Theory and cross-country Survey Evidence from Agriculture. Available at http://www.econ. kuleuven.be/LicoS/DP/DP2006/DP172.pdf
Thiele h., Brodersen c.M. (1999): Differences in farm ef-ficiency in market and transition economies: empirical evidence from West and East germany. European review of Agricultural Economics, 26: 331–347
Arrived on 12th June 2010
Contact address:
Peter Bielik, Daniela hupková, Matúš Vadovič, natália Turčeková, Slovak University of Agriculture in nitra, Tr. A. hlinku 2, 949 76 nitra, Slovakia