Environmental Loads of Process Scrap by using I/O table for Life Cycle Inventory
Kenichi Nakajima
1;*, Yohji Uchiyama
2and Kohmei Halada
31College of Engineering, Graduate School, Tsukuba University, Tsukuba 305-8577, Japan 2Institute of Mechanics and System Engineering, Tsukuba University, Tsukuba 305-8577, Japan 3
National Institute for Materials Science, Tsukuba 305-0047, Japan
New method of environmental load estimation for scraps and by-products production in Life cycle inventory (LCI) based on Input-Output table (I/O table) has been developed. And a new description method of I/O table with scraps and by-products sections for the estimation is developed. In this study, both scraps and by-products are regarded as products, and are dealt with as an independent section in I/O table, respectively. By means of this method, the energy consumption and CO2emission of process-scrap steel production are estimated as an example
study. And a weighted average value of energy consumption and that of CO2emission with consideration to the monetary amounts of production
of process-scrap steel were calculated by using the estimated data, respectively. Moreover, a reliability of the estimated data is analyzed. And LCI of converter steel and EAF steel are done in order to evaluate an influence by differences of data. As a result, when the value of a process scrap was assumed to be zero, the energy consumption rates of zero against the maximum is estimated 0.5% for the converter steel, and 20.4% for the EAF steel, respectively. Therefore, in case of converter, it is possible to treat the environmental load of a process scrap for nothing in approximation.
(Received July 28, 2003; Accepted August 29, 2003)
Keywords: input-output table, life cycle assessment, recycling, system expansion, scrap, steel
1. Introduction
Life cycle assessment (LCA) is a tool to evaluate quantitatively the environmental loads and impacts of ‘‘a product system’’ throughout its life cycle. Moreover, LCA may give a guideline of designing products and social systems such as recycling system and energy system. However it is difficult to compare environmental effects on recycling with which a kind is different in conventional LCA. A clear method for LCA-based recycling technology has not established yet. In ISO TR 14049, the Technical Report1) shows some examples of method for recycling, but the guideline of the method has not identified yet.
In conventional study, scraps generated from production stage and scraps collected from used product are evaluated identically. ‘‘Environmental loads of scraps are zero’’ is a typical example. Waste scraps are collected from used products that finished their life cycle, but scraps generated from production stage and by-products are products that don’t finish their life cycle. So it is thought that the environmental history of production of those are fully needs to be taken into consideration.
A system generating scraps consists of many industrial fields: steel, car production, construction, shipbuilding, etc. In reality, it is impossible to set these processes inside of its system boundary per se. Then, utilization of I/O table (input-output table) that shows input and (input-output of industry is tried. In general, as an application of an I/O table to LCA, a method is established to apply the direct and indirect environmental load calculated value with a consideration of industrial linkage to environmental load of a material or a product. Such as the evaluation by Hondo et al.2) and the evaluation by Kawashimaet al.3)
However, scraps and by-products are not able to evaluate in conventional I/O analysis for the following reasons. In
Japanese I/O table, the scrap steel does not exist in an input coefficient matrix although it is expressed as a row of the minus notation called the Stone method in the input table. In this method, by-product price is also entered by minus notation in the intersection of the column of the section that generates the by-product and the row of the section that produces the by-product as main product. Japanese I/O table employs Stone method for scraps and by-products sections in general. However an input coefficient matrix is required to be non-negative values when a ripple effect is calculated by using an I/O table. With Stone method in the conventional input table, it fails to fill the non-negative condition. Thus scraps and by-products sections are deleted from the input coefficient matrix.
In this study, scraps generated in production process and by-products are regarded as product from each section, and theses sections are separated from every production sections. Usually, in an I/O analysis, one industry produces only one product in principle, and a notion called ‘‘products mix’’ is applied for simplification. In this notion two or more products are treated in a lump, and considered as one product. For an analysis, a method has been proposed in order to separate the ‘‘products mix’’ to each product. In this method, a ‘‘technical model’’ for a production is assumed for a separation. ‘‘Technical model’’ means input coefficients of production process. The Research Institute of Economy, Trade and Industry (RIETI) performed the separation of a copper-ore section from a section of non-ferrous metallic ores.4) And Kawashima et al.performed the separation of a household electric appliance to each of them. However, these are applications to products and a research for scraps and by-products are not reported.
2. Purpose
In this study, a new method to estimate environmental loads of process-scraps and by-products in LCI (life cycle
inventory) by using an I/O table is developed, and process-scrap steel is taken up as an example. Moreover direct and indirect energy consumption and direct and indirect CO2
emission for production of process-scrap steel are estimated based on this method.
3. Estimation of Environmental Loads for
Process-scrap and by-product Productions by using I/O table
3.1 New description of I/O table with process-scrap and
by-product sections
An extension of process-scrap and by-product sections is performed for estimation of environmental loads of scraps and products productions. In this study, the scraps and by-products are regarded as by-products from each production section defined by I/O table, and the scraps and by-products sections are separated from each production section based on the assumption of the ‘‘same technical model’’. ‘‘Same technical model’’ is that the input coefficients of main good are equal to those of process scrap. This is equivalent to the method that allocates input and output of a system according to economic value in LCA. The allocation based on an economic value is also described in ISO. Furthermore, many discussions about this economic allocation are performed internationally. Such as a method by Frank Werner et al.5)
and a method by Rolf Frischknecht.6)Our proposal method of performs an economic allocation actually.
Figure 1 shows an illustration of the extension. Based on this figure, we explain the extension method in following formulas. WhereXqis a domestic production of q-section in
an input table,xsqis the amount of production of scrap and a
by-product of q-section, X0
q is a domestic production of
q-section at the time of adding up a scrap and by-product,xiqis
the amount of input from i-section for q-section,xiq is the
amount of an input from i-section for main product production andxiqb is the amount of an input from i-section
for a scrap and by-product production. X0
q is equal to a
summation of xiq,Xq is equal to a summation ofxiq,xsq is equal to a summation of xiq0. And Fi is amount of final demand andViis gross value adds.
Process-scrap steel sections are taken up as an example. Japanese I/O table in 19957) is used in the calculation. In Japanese I/O table, iron and steel scrap (line code 2612-011) in intermediate sector is equivalent to the process-scrap steel. 75 production sections with production of scrap steel in I/O table are picked up, and an extension of process-scrap steel sections in I/O table has been done based on the method.
Regarding the input-column, an amount of production of process-scrap or by-product is appropriate for the amount of domestic production in each section. A production of a scrap is added up as a positive value, although it is a minus notation. This relation is shown in the following eq. (1),
X0q¼Xqþxsq ð1Þ
Thereby, each amount of an input is expressed as amount of an input to produce a main product, and scrap and a by-product. This relation is expressed by the following formula.
xiq¼xiqaþxiqb ð2Þ
If a same technical model (same technical model means
Domestic Production Gross Value adds Intermediate Sectors Domestic Production Final Demand Intermediate sections … … … … … Vn … Vq … V1 Xn Fn xnn … xnq … xn1 … … Xq … X1 … … Fq … F1 Xn … … xqn … x1n
(-)xsq
… … Xq … X1 … … … xqq … xq1 …
… … x1q …
x11 Domestic Production Gross Value adds Intermediate Sectors Domestic Production Final Demand Intermediate Sections Vn … Vq … V1 Xn Fn xnn … xnq … xn1 … X’q … X1 … F’q … F1 Xn … x’qn … x1n … X’q … X1 …
… … xqq …
x’q1 … … … x1q … x11 Domestic Production Gross Value Adds Domestic Production Final Demand Intermediate Sections Process Scrap Main Goods X’qa F’qa x’qan
… xqaqb xqaqa … x’qa1
X’qb Vqb xnqb
…
xqbqb
…
x1qb
Vn
… Vqa
… V1 Xn Fn xnn … xnqa
… xn1 … X’qb … X1 … F’qb … F1 Xn …
x’qbn
…
x1n
… X’qa
… X1
…
… … xqbqa …
x’qb1
…
… … x1qa …
x11
(a) Conventional I/O table (b) New I/O table with process-scrap sections
[image:2.595.70.526.455.770.2]that it has same input coefficient.) is assumed between a main goods production and a process scrap production, then the relation is shown in the following expression.
xiqb¼xiqa; xiq¼ ð1þÞxiqa
1=ð1þÞ ¼xiqa=xiq ð3Þ
Where is ratio of amount of input for a main product production and amount of input for a process scrap production in q-section. And
xiq=xiq¼Xq=Xq0 ð4Þ
Therefore, each is expressed by the following relations if referred to as1=ð1þÞ ¼. Whereis ratio of amount of input for a main product and a process scrap production and amount of input for a main product production in q-section.
xiq ¼xiq
xiqb ¼ ð1Þxiq ð5Þ
Separation of a main product section and a scrap section corresponding to it is attained based on the formula (5) described above. By calculation, all sections of process-scrap section are integrated to a ‘general process-scrap section’ with a definite material flow.
Regarding the production-row to each section, an exten-sion of a row is needed in order to secure a non-singular matrix. However, since the element of the row is not obtained from an I/O table, data that is based on individual material flow are necessary to investigate. The present estimation is used in the data of the Japan Ferrous Raw Materials Association.8)
3.2 Estimation of environmental loads by using I/O
table
Environmental loads of a process-scrap are calculated by using the new extended I/O table with separated process scrap section. Calculation of direct and indirect environ-mental loads using I/O table has been already established,8) and so here it is mentioned briefly. Direct and indirect environmental loads, "j is obtained from the following formula.
"j ¼Ejþ X
i
"iAij ð6Þ
where, Ej is direct environmental loads in j-section for a production of j-goods per unit of money and"iAijis indirect environmental loads in other sections for a production of j-goods per unit of money. A vector of direct and indirect environmental loads "is expressed in the following matrix notation.
"¼EðIAÞ1 ð7Þ
where,Ais a matrix that hasAijas a factor andEis a vector that has Ej as a factor, respectively. Direct environmental loads are referred to those data by Mr. Kawashimaet al.9)
4. Result
Energy consumption and CO2 emission of process-scrap
steel in each production section are calculated by using new
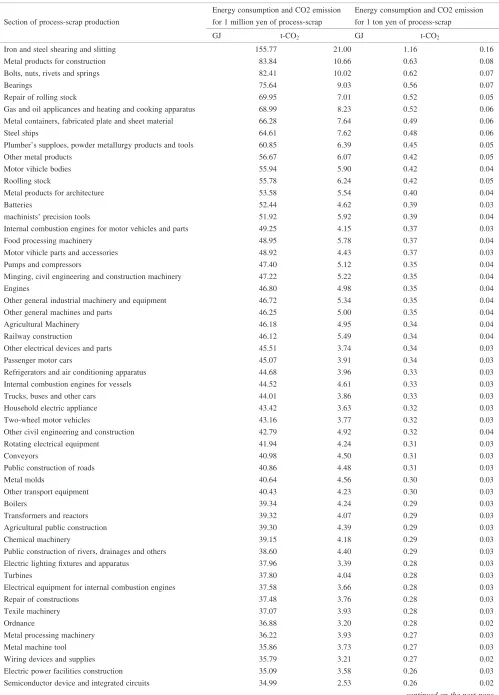
extended I/O table with process-scrap steel section. More-over, the conversion to the amount of resources is performed using the unit price (7468 yen/t) of the scrap obtained from I/O table. The calculated result is shown in Table 1. From the result obtained, environmental loads for process-scrap steel production are not same but different at every section.
An average value with consideration to the production is calculated by using the data described above, and the value is defined as a value of the general process-scrap steel. The amount of energy consumption and CO2 emission of the
general process-scrap steel were 55.7GJ and 6.1t-CO2 per a
million yen, respectively. And they were 0.42GJ and 0.05 t-CO2 per ton, respectively.
5. Discussion
5.1 Reliability of estimated environmental loads
A reliability of estimated environmental loads is analyzed. First, regarding to the unit price used for the conversion. In this research, the unit price is used as a conversion coefficient to a volume-amount display from a monetary-amount dis-play. In regard to the unit price, it is estimated from the monetary amount of production and the volume of produc-tion. The unit price of process-scrap steel estimation based on I/O table is 7,468 yen per ton, whereas the one based on the data of the Japan Ferrous Raw Materials Association10) is 10,351 yen per ton. Then, analysis is attempted to know how deviation arises in the time of using the data in I/O table and the data by Japan Ferrous Raw Materials Association on the basis of the result of 1995. As result, direct and indirect energy consumption and CO2 emission per weight unit of
process-scrap steel are 0.58GJ and 0.06t based on the data by Japan Ferrous Raw Materials Association, and they are 0.42GJ and 0.05t based on the data of I/O table, respectively. This deviation is expressed almost as 40%. That is, as 1 yen change of a unit price occur, then an amount of energy consumption is increased to make 0:56104GJ change,
and an amount of CO2emission makes0:62105t change.
This problem is not a characteristic problem in our method but common problem seen in the analysis of products by using I/O table that is written in monetary-amount display.
Second, regarding to the average value. Environmental loads for general process-scrap steel production are weighted average loads for every process-scrap steel production in this study. Maximum energy consumption for 1t process-scrap production is 1.16GJ in the iron and steel shearing and slitting section, and minimum energy consumption for 1t process-scrap production is 0.18GJ in the electric measuring instru-ment section. From the result obtained, an environinstru-mental load of a process scrap differs at every section, with the maximum disparity of about 6.5 times. Similar tendency is shown about CO2 emission. It is possible to raise the
reliability of evaluation by applying the reliability analysis with the consideration of the uncertainty.
5.2 Influence by the estimated environmental loads
Table 1 Environmental loads for process-scrap steel production
Energy consumption and CO2 emission Energy consumption and CO2 emission Section of process-scrap production for 1 million yen of process-scrap for 1 ton yen of process-scrap
GJ t-CO2 GJ t-CO2
Iron and steel shearing and slitting 155.77 21.00 1.16 0.16
Metal products for construction 83.84 10.66 0.63 0.08
Bolts, nuts, rivets and springs 82.41 10.02 0.62 0.07
Bearings 75.64 9.03 0.56 0.07
Repair of rolling stock 69.95 7.01 0.52 0.05
Gas and oil applicances and heating and cooking apparatus 68.99 8.23 0.52 0.06
Metal containers, fabricated plate and sheet material 66.28 7.64 0.49 0.06
Steel ships 64.61 7.62 0.48 0.06
Plumber’s supploes, powder metallurgy products and tools 60.85 6.39 0.45 0.05
Other metal products 56.67 6.07 0.42 0.05
Motor vihicle bodies 55.94 5.90 0.42 0.04
Roolling stock 55.78 6.24 0.42 0.05
Metal products for architecture 53.58 5.54 0.40 0.04
Batteries 52.44 4.62 0.39 0.03
machinists’ precision tools 51.92 5.92 0.39 0.04
Internal combustion engines for motor vehicles and parts 49.25 4.15 0.37 0.03
Food processing machinery 48.95 5.78 0.37 0.04
Motor vihicle parts and accessories 48.92 4.43 0.37 0.03
Pumps and compressors 47.40 5.12 0.35 0.04
Minging, civil engineering and construction machinery 47.22 5.22 0.35 0.04
Engines 46.80 4.98 0.35 0.04
Other general industrial machinery and equipment 46.72 5.34 0.35 0.04
Other general machines and parts 46.25 5.00 0.35 0.04
Agricultural Machinery 46.18 4.95 0.34 0.04
Railway construction 46.12 5.49 0.34 0.04
Other electrical devices and parts 45.51 3.74 0.34 0.03
Passenger motor cars 45.07 3.91 0.34 0.03
Refrigerators and air conditioning apparatus 44.68 3.96 0.33 0.03
Internal combustion engines for vessels 44.52 4.61 0.33 0.03
Trucks, buses and other cars 44.01 3.86 0.33 0.03
Household electric appliance 43.42 3.63 0.32 0.03
Two-wheel motor vehicles 43.16 3.77 0.32 0.03
Other civil engineering and construction 42.79 4.92 0.32 0.04
Rotating electrical equipment 41.94 4.24 0.31 0.03
Conveyors 40.98 4.50 0.31 0.03
Public construction of roads 40.86 4.48 0.31 0.03
Metal molds 40.64 4.56 0.30 0.03
Other transport equipment 40.43 4.23 0.30 0.03
Boilers 39.34 4.24 0.29 0.03
Transformers and reactors 39.32 4.07 0.29 0.03
Agricultural public construction 39.30 4.39 0.29 0.03
Chemical machinery 39.15 4.18 0.29 0.03
Public construction of rivers, drainages and others 38.60 4.40 0.29 0.03
Electric lighting fixtures and apparatus 37.96 3.39 0.28 0.03
Turbines 37.80 4.04 0.28 0.03
Electrical equipment for internal combustion engines 37.58 3.66 0.28 0.03
Repair of constructions 37.48 3.76 0.28 0.03
Texile machinery 37.07 3.93 0.28 0.03
Ordnance 36.88 3.20 0.28 0.02
Metal processing machinery 36.22 3.93 0.27 0.03
Metal machine tool 35.86 3.73 0.27 0.03
Wiring devices and supplies 35.79 3.21 0.27 0.02
Electric power facilities construction 35.09 3.58 0.26 0.03
Semiconductor device and integrated circuits 34.99 2.53 0.26 0.02
Statistics.11) According to the Iron and Steel Statistics, the combined rates of pig iron against the total amount of iron materials are 93% in converter furnace and 9% in electric furnace, respectively. Environmental loads of pig iron and a process scrap are calculated from the I/O table. Scraps consist of internally generated scrap, process scrap and waste scrap, but the whole quantity of scrap steel is assumed to be process-scrap steel in this study, in order to evaluate the influence by a difference in environmental loads of process-scrap steel.
First, an influence by using unit price is evaluated. Environmental loads of converter steel and EAF steel is calculated according to the reference data with following two cases: (a) environmental loads of process scrap are converted by using the unit price calculated based on I/O table, and (a) environmental loads of process scrap are converted by using the unit price calculated based on year book of ferrous row materials. Figure 2 shows that the direct and indirect energy consumption of converter steel and EAF steel are divided into a scrap origin (direct and indirect environmental loads for scrap production) and other process origin(direct and indirect environmental loads for pig iron production, and direct environmental loads for crude steel production). From the
result, the influence on energy consumption is 0.8% in direct and indirect energy consumption for EAF steel production, and that is 4% in direct and indirect energy consumption for converter steel production. Similar results were also obtained from the CO2 emission.
Second, an influence by using loads of general process-scrap steel is evaluated. Environmental loads of converter steel and EAF steel is calculated according to the reference data with following four cases: (a) environmental loads of process scrap are Zero. (b) minimum loads of electric measuring instrument section, (c) average loads of all sections, and (d) maximum loads of an iron and steel shearing and slitting section. Figure 3 shows that the direct and indirect energy consumption of converter steel and EAF steel are divided into a scrap origin and other process origin. From the result, for the rate of maximum and minimum to the energy consumption for the converter steel production calculated by using the loads of general process-scrap steel are estimated to be0:1% and 0.3%, respectively, and those for the EAF steel production are estimated to be6:4% and 13.2%, respectively. Similar results were also obtained from the CO2emission. The reason that the rates of environmental
0.0 2.0 4.0 6.0
0.00
Energy Consumption, E/GJ
18.0 18.4
Other Process
17.6 EAF Steel
Converter Steel
Other Process
Scrap production
(a) Zero: loads of process-scrap steel as zero (b) Minimum: loads of electric measuring instrument section (c) Weighted average: loads of general process-scrap steel (d) Maximum: loads of iron and steel shearing and slitting section
(a) (b) (c) (d)
(a) (b)(c) (d)
Fig. 3 Calculated energy consumption of converter steel and EAF steel per ton.
Energy Consumption, E/GJ
0.0 2.0 4.0 6.0
0.00 18.0 18.4
Other Process
17.6 EAF Steel
Converter Steel
Other Process
Scrap production
(a) Calculated load based on I/O table
(b) Calculated load based on year book of ferrous raw materials
(a) (b)
(a) (b)
Fig. 2 Calculated energy consumption of converter steel and EAF steel per ton.
Toys 34.88 2.70 0.26 0.02
Semiconductor making equipment 34.81 3.51 0.26 0.03
Other special industrial machinery 34.23 3.52 0.26 0.03
Other photographic and optical instruments 33.87 2.77 0.25 0.02
Copy machine 33.45 2.74 0.25 0.02
Bicycles 32.93 3.02 0.25 0.02
Telecommunication facilities construction 31.70 3.10 0.24 0.02
Electric audio equipment 31.69 2.67 0.24 0.02
Other industrial heavy electrical equipment 31.28 2.87 0.23 0.02
Relay switches and switchboards 31.21 2.94 0.23 0.02
Other office machines 31.00 2.45 0.23 0.02
Professional and scientific insturments 30.78 2.82 0.23 0.02
Watches and clocks 30.45 2.49 0.23 0.02
electric computing equipment(accessory equipment) 29.39 2.29 0.22 0.02
Industrial robots 29.22 2.89 0.22 0.02
Wired communication equipment 28.84 2.30 0.22 0.02
Analytical instruments, testing machine, measuring instruments 27.56 2.46 0.21 0.02
Camera 26.36 2.00 0.20 0.01
Aircrafts 26.20 2.07 0.20 0.02
electric computing equipment(main parts) 25.58 1.96 0.19 0.01
[image:5.595.304.547.626.759.2] [image:5.595.48.291.640.760.2]loads in converter steel differ from those in EAF steel is the difference of the pig iron consumption. The converter steel production consumes large amount of pig iron than EAF production. And the environmental loads of pig iron are much larger than those of process-scrap. When the value of a process scrap was assumed to be zero, the energy consump-tion rates of zero against the maximum is estimated to be 0.5% for the converter steel, and 20.4% for the EAF steel, respectively. Similar results were also obtained from the CO2
emission.
6. Conclusions
By using an I/O table, the new LCI method to estimate an environmental load of a process scrap was developed, and the following were obtained as main conclusion.
. It was enabled to evaluate process-scrap steel by this new method and to create process scrap inventory data by the section.
. The calculated values of process-scrap steel by the section were useful for evaluating a system consumed different kinds of process-scrap steel.
. Case like converter steel, it was shown that it is possible to treat environmental load of process-scrap as zero in approximation. Meanwhile, case like EAF steel, it was shown that the difference in the process-scrap steel was necessary to be taken into consideration.
Acknowledgments
The authors would like to thank Mr.Hayashi, the general manager of Japan Technical Information Service, Mr.Kawashima of Institute for Policy Science Japan.
REFERENCES
1) JEMAI, LCA–Inventory analysis & Examples of application–(2001) pp118-179.
2) H.Hondo, Y.Tonooka and Y.Uchiyama: Socio-economic Research Center, Reo.No.Y97017 (1998) pp.1-35.
3) K.Kawashima and Y.Uchiyama: Input-Output Analysis 3 (2000) 16-29.
4) The Research Institute of Economy, Trade and Industry (RIETI): http://www.rieti.go.jp/jp/projects/koubutsu/index.html
5) F.Werner and K.Richter: Int. J. LCA5(2000) 79-83. 6) R.Frischknecht: Int. J. LCA5(2000) 85-95.
7) Management and Coordination Agency Government of Japan, 1995 Input-Output Tables (1999) pp.5-913.
8) The Japan ferrous raw materials association, year book of ferrous raw materials(2000) pp. 18–21.
9) K.Kawashima and Y.Uchiyama: Input-Output Analysis 3 (2000) 17-23.
10) The Japan ferrous raw materials association, year book of ferrous raw materials (2000) pp. 20.