Salinity is a common environmental stress factor seriously affecting crop production in different regions, particularly in arid and semi-arid regions. It is estimated that over 800 million hectares of land in the world are affected by both salinity and sodicity (Munns 2005). The response of rice to salinity varies with growth stage. In the most commonly cultivated rice cultivars, young seedlings were sensitive to salinity (Lutts et al. 1995). Salinity tolerance at the rice seedling and reproductive stages is only weakly associated; hence, pyramid-ing of contributpyramid-ing traits at both stages is needed for developing resilient salt-tolerant genotypes.
Salinity has several effects on plant growth via an osmotic effect on plant water uptake, and specific ion toxicities (Munns et al. 2006). Thus, physi-ological traits used for screening germplasm for salinity tolerance included Na+, K+ and Cl–
exclu-sion (Carden et al. 2003), and Na+/K+ or Ca2+/ Na+
discrimination (Yamaguchi and Blumwald 2005). By decreasing the osmotic potential of the soil solution in saline conditions, plant access to water uptake will be reduced. As the soil dries, the concentra-tion of salt in the soil soluconcentra-tion will be increased. Salt stress, like many abiotic stress factors, also induces oxidative damage to plant cells catalyzed
The effect of salinity stress on ions and soluble sugars
distribution in leaves, leaf sheaths and roots of rice
(
Oryza sativa
L.) seedlings
I. Nemati
1, F. Moradi
2, S. Gholizadeh
1, M.A. Esmaeili
3, M.R. Bihamta
41
College of Agriculture, Islamic Azad University, Khorramshahr Branch, Khorramshahr,
Iran
2
Plant Physiology Libratory, Agricultural Biotechnology Research Institute of Iran, Karaj,
Iran
3
Faculty of Agronomy, Agriculture and Natural Resources University of Sari, Sari, Iran
4Department of Plant Breeding, Agriculture and Natural Resources College, Tehran
University, Karaj, Iran
ABSTRACT
In order to investigate the solutes accumulation associated with salt tolerance of rice (Oryza sativa L.), two rice genotypes including IR651 (salt-tolerant) and IR29 (salt-sensitive) were grown hydroponically in the Youshida nutrient solution. Salinity treatment was imposed 3 weeks after sowing using NaCl in two levels 0 and 100 mmol. Samples were separately collected from the youngest (sixth) leaves, leaf sheaths and roots at 72 and 240 h after salinization; then Na+, K+, Ca2+, Mg2+, P, Mn2+, Cl– and total soluble sugars concentration and Na+/K+ ratio were
determined. Total dry weight of both genotypes decreased with the application of NaCl. Salinity caused higher ac-cumulation of Na+ and Cl– in the sixth leaf and leaf sheath of IR29 than in IR651 while their concentration in root
of IR651 was higher. K+ concentration was decreased in the sixth leaf and leaf sheath of IR29 under NaCl stress.
Reduction in Ca2+ and Mg2+ concentrations were observed in sixth leaves of both genotypes. P concentration was
increased in leaf sheath and root of IR29 under saline conditions while it showed no changes in IR651. Our results indicated that the tolerant genotype had mechanisms to prevent high Na+ and Cl– accumulation in the sixth leaf.
High total soluble sugars concentration in shoot of IR651 is probably for adjusting osmotic potential and better wa-ter uptake under salinity. These mechanisms help plant to avoid tissue death and enable to continue its growth and development under saline conditions.
by reactive oxygen species (Azevedo-Neto et al. 2006). However, for many plants (such as grami-naceous crops), Na+ is the primary cause of ion
specific damage. Shannon et al. (1998) found no relation between ion concentration in shoot and salt tolerance in rice. Aslam et al. (2003) reported that salt stress in some cultivars of rice is related with K+/Na+ ratio. Maintaining a better nutrition
with K+ and Ca2+, while limiting sodium uptake, is
a highly important trait contributing to high salt stress tolerance in plants. In recent years increasing numbers of salt-tolerant transgenic plants were generated with overexpression of vacuolar Na+/H+
antiporter proteins mediating lower concentrations of Na+ and higher ratios of K+/Na+ (Yamaguchi
and Blumwald 2005). Carden et al. (2003) reported that the cytosolic Na+/K+ ratio rather than the
absolute Na+ concentration, may be critical for
NaCl tolerance. High levels of Ca2+ in rice root
environment are essential for the maintenance of high root uptake and shoot accumulation of Ca2+ and K+ in saline soils and thus for avoiding
salinity damage in plants as shown in rice plants (Song et al. 2006). Earlier studies report on cart-bohydrate accumulation during various abiotic stresses in plants where long term carbohydrate storage occurs during reproductive development (Colmer et al. 1995).
The objectives of this experiment were to com-pare responses of rice genotypes differing in toler-ance to salt stress and to study the association of the physiological traits of rice seedlings such as ion contents and total soluble sugars in leaves, leaf sheaths and roots with the salt tolerance.
MATERIALS AND METHODS
Plant cultivation in greenhouse. Experiments were conducted during 2006 in a greenhouse of Agricultural Biotechnology Research Institute of Iran (ABRII) with a solution culture system and young plants of two rice genotypes. The air tem-perature ranged 30–20°C (day-night) and 50–75% relative humidity. All the studies were carried out at the seedling stage of rice (Oryza sativa L.). Seeds of salt-tolerant (IR651) and sensitive (IR29) rice genotypes were germinated at 30°C for 72 h and pregerminated seeds were transferred to pots containing distilled deionized water for 3 days; then test pots were filled with nutrient solution containing 91.4 g NH4NO3, 35.6 g NaH2PO4∙H2O, 117.35 g CaCl2∙2 H2O, 71.4 g K2SO4, 324 g MgSO4∙ 7 H2O, 1.5 g MnCl2∙4 H2O, 0.074 g (NH4) 6 Mo7.
O24∙4 H2O, 0.035 g ZnSO4∙7 H2O, 0.934 g H3BO3, 0.031 g CuSO4∙5 H2O, 7.7 g FeCl3∙6 H2O and 11.9 g C6H8O7∙H2O per liter (Yushida et al. 1976). The pH was adjusted to 5.5 by 0.1M KOH and HCl. Salinity treatments were imposed 21 days after sowing, when seedlings had six complete leaves, using two salinity levels with 0 and 100 mmol NaCl.
Plant materials analysis. All sixth leaves, leaf sheaths and roots were collected for mea-surements 72 and 240 h after adding NaCl and dried at 70°C for 72 h; the total and each part dry weight were separately determined. Samples digestion was done for Na+, K+, Ca2+, Mg2+, P
and Mn2+ determination via wet digestion using
sulfuric acid (96%), H2O2 (30%) and salicylic acid. The concentration of Na+ and K+ were
deter-mined after digestion with a Flame photometer (Corning-410), Ca2+, Mg2+ and Mn2+ were
deter-mined with an Atomic Absorption Spectrometer (Perkin Elmer, AAnalyst 300, California, USA). Chloride was measured with Ion-Analyzer using a chloride electrode (ISM146-Cl, Los Angeles, USA) after digestion with distilled deionized water. P concentration in digested samples was estimated after coloring with molybdate-vanadate using spectrophotometer (Varian, Carry 300, California, USA). Soluble carbohydrates were determined using zinc sulfate (5%), barium hydroxide (0.3 N) and phenol (5%) with spectrophotometer (Varian, Carry 300, California, USA). Data were analyzed in a factorial based on completely ran-domized design with four replications. Means were statistically compared among treatments by the Least Significant Difference (LSD) at the
P ≤ 0.01 level using the SAS (Ver. 6.12) software.
RESULTS AND DISCUSSION
Dry weight. There was no significant (P ≤ 0.01) difference between studied genotypes in total dry weight and dry weight of different parts under normal conditions. Both genotypes showed a dry matter reduction under saline condition but ob-served a decline in dry weight of IR29 higher than in IR651 (Table 1). Salinity caused a decrease of the sixth leaf dry weight of IR651 and IR29 by 12% and 40%, respectively. Analysis of variance showed that all of the treatments and their interactions had significant (P ≤ 0.01) effects on dry weight of genotypes (Tables 5 and 6).
seedlings was higher than IR651. Munns (2002) reported that biomass production in saline versus control conditions over a long period is related to salt tolerance. A significant reduction in total dry weight under salinity was due to Na+ and
Cl– accumulation and osmotic stress. NaCl stress
led to a decline of osmotic potential in nutrient solution and plant water uptake and finally plant dry matter production was reduced.
Solutes concentration. Root Na+ concentration
was higher than in other parts in both genotypes (Tables 2–4). A significant (P ≤ 0.01) increase was observed in root Na+ concentration in both
genotypes under salinity (Table 4). Root Na+
con-centration in IR651 seedlings was higher than IR29 at the second harvest while no significant (P ≤ 0.01) difference was observed between geno-types until the first sampling. Table 2 shows a significant (P ≤ 0.01) effect of NaCl on Na+
con-centration in the sixth leaves of both genotypes
at the first harvest. More Na+ was accumulated
in the sixth leaf of stressed IR29 seedlings than in IR651 at the second harvest. Application of NaCl caused a significant (P ≤ 0.01) rise in leaf sheaths Na+ concentration in seedlings of both genotypes
(Table 3). Na+ concentration showed an
increas-ing change durincreas-ing the experiment conductance. Differences between leaf sheath and root Na+
concentrations in stressed IR29 seedlings were not significant (P ≤ 0.01) at the second harvest. Generally, Na+ in IR29 was accumulated mainly in
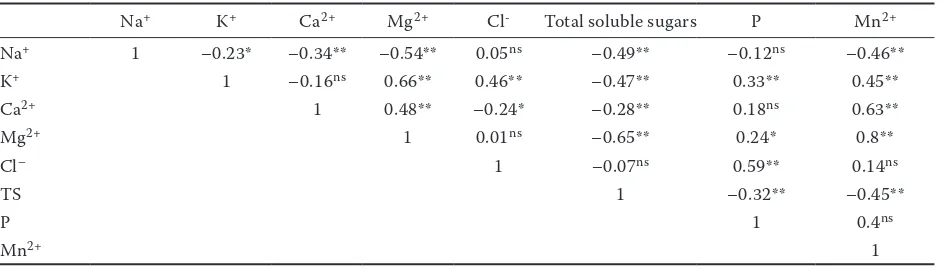
shoot while in IR651 it was in root. Pierson cor-relation coefficients showed a negative corcor-relation between Na+ with K+, Ca2+, Mg2+ and Mn2+ but a
positive with total soluble sugars (Table 7). Results showed that plant growth suppression in studied genotypes was related to the rate of Na+ accumulation in leaves and leaf sheaths. Salt
tolerant genotype was able to prevent high Na+
accumulation in the youngest leaf and thereby
de-Table 1. Total dry weight and dry weight of separated parts of plants at 240 h after salinization
IR29 IR651
normal stress normal stress
Total dry weight (g) 451 ± 12.9 243 ± 12.9 468 ± 13.8 385 ± 13.8
Leaf dry weight (g) 39 ± 0.8 24 ± 0.7 33 ± 0.9 29 ± 0.9
Leafsheath dry weight (g) 97 ± 1.9 107 ± 2.3 99 ± 2.1 77 ± 1.8
Root dry weight (g) 122 ± 2.4 89 ± 1.8 121 ± 2.3 101 ± 2.1
[image:3.595.63.533.77.163.2]Means and standard errors of 4 replications are shown
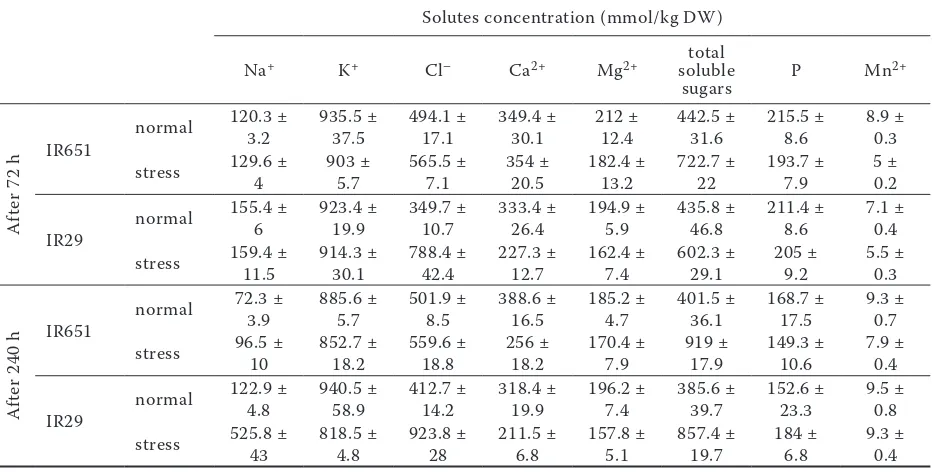
Table 2. Solutes concentration in leaf sheaths of IR651 (salt tolerant) and IR29 (salt sensitive) under normal and saline conditions
Solutes concentration (mmol/kg DW)
Na+ K+ Cl– Ca2+ Mg2+ soluble total
sugars P Mn
2+
A
ft
er
7
2
h IR651
normal 120.3 ± 3.2 935.5 ± 37.5 494.1 ± 17.1 349.4 ± 30.1 212 ± 12.4 442.5 ± 31.6 215.5 ± 8.6 8.9 ± 0.3 stress 129.6 ± 4 903 ± 5.7 565.5 ± 7.1 354 ± 20.5 182.4 ± 13.2 722.7 ± 22 193.7 ± 7.9 5 ± 0.2
IR29 normal
155.4 ±
6 923.4 ± 19.9 349.7 ± 10.7 333.4 ± 26.4 194.9 ± 5.9 435.8 ± 46.8 211.4 ± 8.6 7.1 ± 0.4 stress 159.4 ± 11.5 914.3 ± 30.1 788.4 ± 42.4 227.3 ± 12.7 162.4 ± 7.4 602.3 ± 29.1 205 ± 9.2 5.5 ± 0.3
A
ft
er
2
40
h IR651
normal 72.3 ± 3.9 885.6 ± 5.7 501.9 ± 8.5 388.6 ± 16.5 185.2 ± 4.7 401.5 ± 36.1 168.7 ± 17.5 9.3 ± 0.7 stress 96.5 ± 10 852.7 ± 18.2 559.6 ± 18.8 256 ± 18.2 170.4 ± 7.9 919 ± 17.9 149.3 ± 10.6 7.9 ± 0.4
IR29 normal
122.9 ±
4.8 940.5 ± 58.9 412.7 ± 14.2 318.4 ± 19.9 196.2 ±7.4 385.6 ± 39.7 152.6 ± 23.3 9.5 ± 0.8 stress 525.8 ± 43 818.5 ± 4.8 923.8 ± 28 211.5 ± 6.8 157.8 ± 5.1 857.4 ± 19.7 184 ± 6.8 9.3 ± 0.4
[image:3.595.66.532.505.741.2]crease Na+ damages to active tissues. Na+ toxicity
is strongly linked to the plants’ ability to sustain the acquisition and in planta distribution of K+
(Kader and Lindberg 2005).
There was a significant (P ≤ 0.01) reduction in root and leaf sheath K+ concentration in IR651
when adding NaCl to nutrient solution (Tables 3
and 4). Results also showed that there were no sig-nificant (P ≤ 0.01) differences between genotypes in leaves K+ concentration under control and stress
conditions at the first harvest. K+ concentration
[image:4.595.70.533.89.327.2]was decreased in leaf sheath of IR651 while it was stable in IR29 under stress at 72 h after saliniza-tion. Observations indicated that K+ concentration
Table 3. Solutes concentration in leaf sheaths of IR651 (salt tolerant) and IR29 (salt sensitive) under normal and saline conditions
Solutes concentration (mmol/kg DW)
Na+ K+ Cl– Ca2+ Mg2+ soluble total
sugars P Mn
2+
A
ft
er
7
2
h IR651
normal 191.7 ± 24.4 3400 ± 298.1 212.4 ± 10.2 77.2 ± 7.1 180.4 ± 12.6 358 ± 23.6 265.5 ± 16.4 7.1 ± 0.5 stress 408.5 ± 14.5 2569.1 ± 94.7 267.3 ± 1.5 115 ± 5.1 157.8 ± 7.6 662.9 ± 32.1 238.9 ± 10.6 5 ± 0.2
IR29 normal
225.5 ±
12.6 3234.5 ± 80.8 188.6 ± 4.2 182.2 ± 5.6 226.1 ± 10.3 290 ±23.5 231.6 ± 21.4 7.1 ± 0.4 stress 618.9 ± 17.6 3160.5 ± 141.1 305.8 ± 16.3 194.6 ± 22.7 156.2 ± 3.9 498.8 ± 53.4 241.3 ± 8.1 5.5 ± 0.3
A
ft
er
2
40
h IR651 normal
178 ±
4.8 2975.7 ± 46.5 175.7 ± 5.6 98.2 ± 8.2 212.9 ± 7.7 450 ± 49.9 84 ± 9.7 0.3 ± 0.0 stress 799.9 ± 42.5 2217.9 ±90.5 215.5 ± 5.5 161.1 ±13.8 151.8 ± 4.4 1082.7 ± 4.2 190 ± 14.7 0.2 ± 0.0
IR29 normal
188.3 ±
14.1 3014.9 ± 65.1 149.8 ± 4.5 145.3 ± 6.7 255.1 ± 6.3 286.7 ± 6.7 106.6 ± 4.8 0.3 ± 0.0 stress 2069 ± 85.1 2347.3 ± 149 348.2 ± 11.6 235.1 ± 6 173.3 ±2.9 459.3 ± 72.1 196.2 ± 6.2 0.3 ± 0.0
Means and standard errors of 4 replications are shown
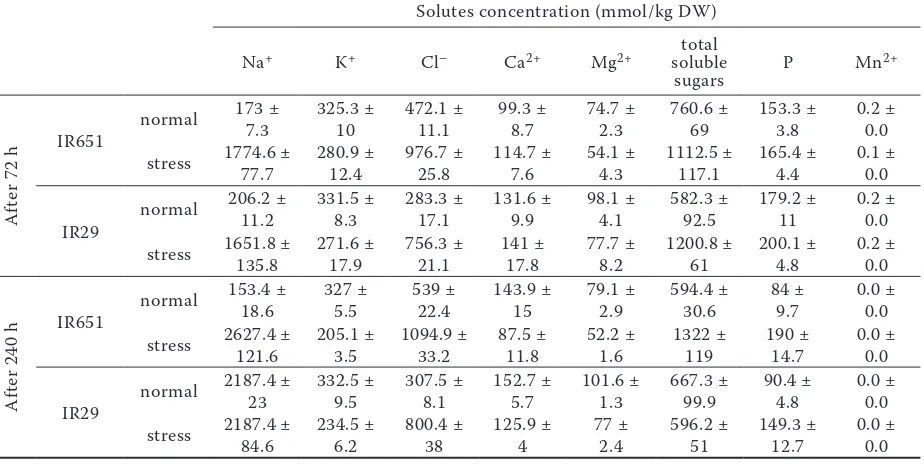
Table 4. Solutes concentration in roots of IR651 (salt tolerant) and IR29 (salt sensitive) under normal and saline conditions
Solutes concentration (mmol/kg DW)
Na+ K+ Cl– Ca2+ Mg2+ soluble total
sugars P Mn
2+
A
ft
er
7
2
h IR651
normal 173 ± 7.3 325.3 ± 10 472.1 ± 11.1 99.3 ± 8.7 74.7 ± 2.3 760.6 ± 69 153.3 ± 3.8 0.2 ± 0.0 stress 1774.6 ± 77.7 280.9 ± 12.4 976.7 ± 25.8 114.7 ± 7.6 54.1 ± 4.3 1112.5 ± 117.1 165.4 ± 4.4 0.1 ± 0.0
IR29 normal
206.2 ±
11.2 331.5 ± 8.3 283.3 ± 17.1 131.6 ± 9.9 98.1 ± 4.1 582.3 ± 92.5 179.2 ± 11 0.2 ± 0.0 stress 1651.8 ± 135.8 271.6 ± 17.9 756.3 ± 21.1 141 ± 17.8 77.7 ± 8.2 1200.8 ± 61 200.1 ± 4.8 0.2 ± 0.0
A
ft
er
2
40
h IR651
normal 153.4 ± 18.6 327 ± 5.5 539 ± 22.4 143.9 ± 15 79.1 ± 2.9 594.4 ± 30.6 84 ± 9.7 0.0 ± 0.0 stress 2627.4 ± 121.6 205.1 ± 3.5 1094.9 ± 33.2 87.5 ± 11.8 52.2 ± 1.6 1322 ± 119 190 ± 14.7 0.0 ± 0.0
IR29 normal
2187.4 ±
23 332.5 ± 9.5 307.5 ± 8.1 152.7 ± 5.7 101.6 ± 1.3 667.3 ± 99.9 90.4 ± 4.8 0.0 ± 0.0 stress 2187.4 ± 84.6 234.5 ± 6.2 800.4 ± 38 125.9 ± 4 77 ± 2.4 596.2 ± 51 149.3 ± 12.7 0.0 ± 0.0
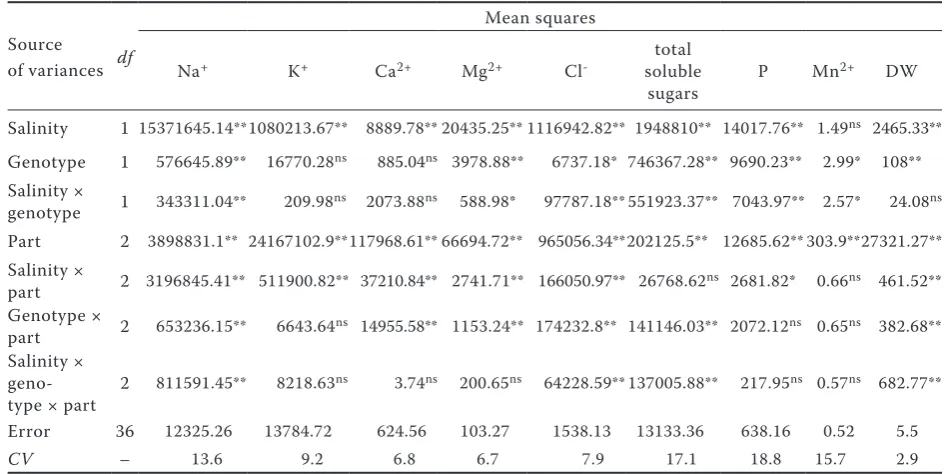
[image:4.595.71.533.511.743.2]Table 5. Analysis of variances for determined traits in different parts of plants at 72 h after salinization
Source
of variances df
Mean squares
Na+ K+ Ca2+ Mg2+ Cl– soluble total
sugars P Mn
2+
Salinity 1 449180.98** 368511.5** 208.83ns12667.2** 3340961.12** 1040459.62** 48.9ns 26.8** Genotype 1 16068.49ns 59163.57ns 3026.2ns 1000.64* 10960.44ns 53318.18* 438.77ns 0.02ns Salinity ×
genotype 1 79.38ns 195476.54* 6057.79* 807.53ns 298045.83** 898.47ns 1221.59ns 1.28* Part 2 5617431.33**34337726.23** 174339.88**62382.98**17316106.79** 691840.93** 19550.62** 218.62** Salinity × part 2 5166470.3** 232139.05** 6163.41** 651.99ns 356748.86** 58824.06** 1065.87ns 7.83** Genotype ×part 2 55813.59ns 60756.63ns 24751.83** 2297.45** 90250.91** 4679.69ns 2134.85** 2** Salinity × geno-
type × part 2 55476.21ns 189786.14** 2978.57* 689.2ns 105165.03** 33188.74ns 205.94ns 16.26**
Error 36 9260.33 32148.48 1105.75 253.34 11050.24 10930.01 354.74 0.28
CV – 19.8 12.4 16.9 10.7 8.9 17.2 8.9 12.41
*P < 0.05; **P < 0.01; nsnot significant
Table 6. Analysis of variances for determined traits in different parts of plants at 240 h after salinization
Source of variances df
Mean squares
Na+ K+ Ca2+ Mg2+ Cl- soluble total
sugars P Mn
2+ DW
Salinity 1 15371645.14**1080213.67** 8889.78** 20435.25** 1116942.82** 1948810** 14017.76** 1.49ns 2465.33** Genotype 1 576645.89** 16770.28ns 885.04ns 3978.88** 6737.18* 746367.28** 9690.23** 2.99* 108** Salinity ×
genotype 1 343311.04** 209.98ns 2073.88ns 588.98* 97787.18** 551923.37** 7043.97** 2.57* 24.08ns Part 2 3898831.1** 24167102.9**117968.61** 66694.72** 965056.34**202125.5** 12685.62** 303.9**27321.27** Salinity ×
part 2 3196845.41** 511900.82** 37210.84** 2741.71** 166050.97** 26768.62ns 2681.82* 0.66ns 461.52** Genotype ×
part 2 653236.15** 6643.64ns 14955.58** 1153.24** 174232.8** 141146.03** 2072.12ns 0.65ns 382.68** Salinity ×
geno-
type × part 2 811591.45** 8218.63
ns 3.74ns 200.65ns 64228.59** 137005.88** 217.95ns 0.57ns 682.77**
Error 36 12325.26 13784.72 624.56 103.27 1538.13 13133.36 638.16 0.52 5.5
CV – 13.6 9.2 6.8 6.7 7.9 17.1 18.8 15.7 2.9
*P < 0.05; **P < 0.01; nsnot significant
was decreased in both genotypes at 240 h after imposing salinity. As shown in Tables 2–4, K+
concentration in leaf sheaths of both genotypes was higher than in leaves and roots.
One of the best-known effects of sodium stress on plant nutrition is suppression of K+ uptake. K+
is an essential activator for many enzymes located in the cytosol, and it was shown that Na+ cannot
substitute for this biochemical function (Tester and Dovenport 2003). Leaf sheath was the main source for K+ in both genotypes. Reduction in K+
concentration under stress is due to Na+
accumu-lation because Na+ engrosses ways for K+ uptake.
Increasing cytosolic Na+ concentrations with
sa-linity was reported previously (Carden et al. 2003, Halperin and Lynch 2003, Kader and Lindberg 2005). In addition, several studies showed, or inferred, a suppression of the cytosolic K+ concentration in
the presence of Na+ (Flowers and Hajibagheri 2001,
Carden et al. 2003). Many of physiological processes in plants were suppressed with the increase in Na+
concentration. Jones and Turner (1980) reported that K+ is an important ion for osmotic
[image:5.595.60.533.505.742.2]Table 7. Pearson correlation coefficients between determined traits
Na+ K+ Ca2+ Mg2+ Cl- Total soluble sugars P Mn2+
Na+ 1 –0.23* –0.34** –0.54** 0.05ns –0.49** –0.12ns –0.46**
K+ 1 –0.16ns 0.66** 0.46** –0.47** 0.33** 0.45**
Ca2+ 1 0.48** –0.24* –0.28** 0.18ns 0.63**
Mg2+ 1 0.01ns –0.65** 0.24* 0.8**
Cl– 1 –0.07ns 0.59** 0.14ns
TS 1 –0.32** –0.45**
P 1 0.4ns
Mn2+ 1
*P < 0.05; **P < 0.01; nsnot significant
osmotic adjustment till 30–50%. Reduction in K+
concentration probably caused a reduction of plant ability for osmotic adjustment and drought stress, which led to plant growth reduction.
Adding NaCl to nutrient solution had no sig-nificant (P ≤ 0.01) effect on Ca2+ concentration in
roots at the first harvest but caused a significant (P ≤ 0.01) reduction in Ca2+ concentration at the
second harvest. Table 3 shows there was no change in leaf sheath Ca2+ concentration in IR29
seed-lings at the first harvest while a significant (P ≤ 0.01) increase was observed in both genotypes at 240 h after salinization.
Observed reduction in leaf Ca2+ concentration
in IR29 was higher than in IR651; this may be due to lower salt tolerance. Ca2+ functions in plants
include alleviation of ionic stress, activation of enzymes, sensing and responding. It was shown in previous studies that increasing Na+ content in
plant environment caused reduction of Ca2+
con-tent in salt-sensitive plants (Lacerda et al. 2003). Ca2+ content decreased in maize, chickpea and
sorghum under salinity while it increased in bean. In previous studies on soybean and cucumber, an additional supply of Ca2+ to salt-stressed plants
improved the salt tolerance of plants by reducing Na+ uptake and transport (Dabuxilatu and Ikeda
2005). According to Husain et al. (2004) the major role of Ca2+ for increasing salt tolerance of plants
was related to its inhibitory effect on the xylem loading of Na+. Song et al. (2006) reported that
high levels of external Ca2+ are essential for the
maintenance of high root uptake and shoot ac-cumulation of Ca2+ and K+ on saline soils. It also
plays a key role to avoid salinity damage to plants. Salt stress caused a decrease of Mg2+
concen-tration in all plant parts of studied genotypes (Tables 2–4). Determination of Mg2+ showed that
its concentration in the sixth leaf of IR651 was higher than IR29 while in root and leaf sheath it
was lower. Mg2+ is essential for protein
synthe-sis and chlorophyll structure. It is an activator for many of photosynthetic and respiratory en-zymes. Salinity caused Mg2+ to decrease in plant
leaves, leaf sheaths and roots of both genotypes. Contribution of Mg2+ in osmotic adjustment in
leaves of salt-stressed sorghum was higher than in root (Lacerda et al. 2003).
Cl– concentration in all parts of stressed IR651
seedlings was significantly (P ≤ 0.01) higher than IR29. Leaves Cl– concentration rose in stressed
seedlings of both genotypes. Salinity had a signifi-cant effect on Cl– concentration in leaf sheaths
of genotypes. Cl– content in the sixth leaf and
leaf sheath of salt-sensitive genotype were about 1.65 and 1.61 times higher than IR651 under stress condition, respectively (Tables 2 and 3). Results showed a significant (P ≤ 0.01) increase in Cl–
concentration in roots of both genotypes; but Cl– concentration in IR651 was about 1.36 times
higher than IR29. Root Cl– concentration
increas-ingly changed in IR651 but in IR29 became stable after the primary increase (Table 4). Cl– had a
positive correlation with K+ and negative with
Ca2+ (Table 7).
IR651 was able to preserve Cl– in root and leaf
sheath while a high rate of this ion was observed in the sixth leaf of IR29. Lacerda et al. (2003) said that Cl– accumulation in shoot of salt tolerant plant
was lower compared to salt-sensitive ones under saline condition. Some halophytes can accumu-late high Na+ content and use it as osmolyte but
compartmentalize it in vacuole to decrease toxic effect. The pattern of Cl– distribution was similar
to Na+. It may be associated with salt tolerance in
IR651. Na+ and Cl– accumulation in root of IR651
led to suppression of shoot damage.
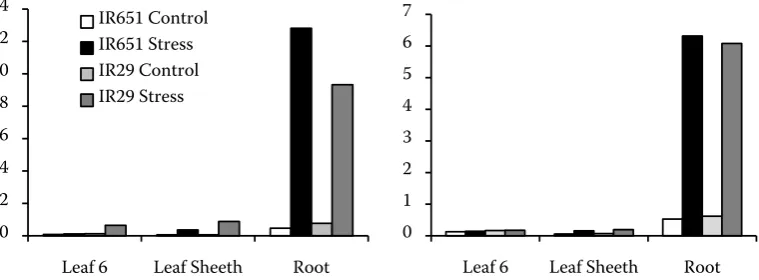
tion. Roots Na+/K+ ratio increase was higher than
in other parts of both genotypes. Na+/K+ ratio in
the sixth leaf and leaf sheath of IR29 was about 5.6 and 2.4 times higher than IR651, respectively, while in roots of IR651 it was 1.3 times higher than in IR29 (Figure 1).
Salinity has various effects on Mn2+ and P content
in plants. Mitochondrial SOD (superoxide dismutase) is scavenged with Mn2+ that can play an important
role to remove toxic effects of oxidative stress. Mn2+
concentration decreasing under salinity lead to a decrease of micro elements solubility in saline and sodic soils. This study has highlighted a relationship between plant ionic status and salinity tolerance in studied rice cultivars. Tolerant genotype was able to accumulate toxic ions in roots better than the sensitive ones, and thereby had better dry matter production. Total soluble sugars that are essential for osmotic adjustment accumulated in shoot of salt-tolerant plants were higher compared to sensitive-ones. Our results showed that IR651 was able to suppress both osmotic and toxic effects of salinity on active leaf using the above mentioned mechanisms, and showed better growth under salt stress.
REFERENCES
Aslam M., Muhammad N., Qureshi R.H., Ahmad Z., Nawaz S., Akhtar J. (2003): Calcium and salt-tolerance of rice. Commu-nications in Soil Science and Plant Analysis, 34: 3013–3031. Azevedo-Neto D.D., Prisco J.T., Eneas J., De Abreu C.E.B., Gomes
E. (2006): Effect of salt stress on antioxidative enzymes and lipid peroxidation in leaves and roots of salt-tolerant and salt sensitive maize varieties. Environmental and Experimental Botany, 56: 87–94.
Carden D.E., Walker D.J., Flowers T.J., Miller A.J. (2003): Signal cell measurements of the contributions of cytosolic Na+ and
K+ to salt tolerance. Plant Physiology, 131: 676–683.
0
2 4 6 8 10 12 14
Leaf 6 Leaf Sheeth Root
IR651 Control IR651 Stress IR29 Control IR29 Stress
0 1 2 3 4 5 6 7
[image:7.595.93.473.67.207.2]Leaf 6 Leaf Sheeth Root
Figure 1. Na+/K+ ratio in studied genotypes of rice at (A) 72 h after salinization and (B) 240 h after salinization
soluble sugars increase in IR651 was continuous till the end of experiment while in IR29 it was stable in leaf sheath and decreased in root. Results showed that total soluble sugars concentration in the sixth leaf and leaf sheath of IR651 were 1.07 and 2.35 times higher, respectively, than IR29 at the second harvest (Table 3).
The first effect of salinity on plants is a drought effect or water deficit. Plants try to reduce their osmotic potential via increasing mineral ions content and compatible solutes synthesis to better water uptake under salinity. Total soluble carbohydrates are important solutes that are synthesized and accumulated in cytosol under salt stress. Total soluble carbohydrates under saline conditions were higher than control in both genotypes. Total soluble carbohydrates increase in IR651 probably caused better osmotic adjustment and maintained turgor for growth under salinity. Kerepsi and Galiba (2000) reported that carbohydrates changes are important because of their relationship with such physiologi-cal processes as photosynthesis, translocation and respiration. Some studies reported that plants sugars content rose (Munns and Weir 1981) or remained constant (Morgan 1992) under salinity.
Salinity caused an increase of P concentration in leaf sheath and root of IR29 while it had no significant effect on IR651 at the second harvest. There were no significant (P ≤ 0.01) changes in P concentration in both genotypes. The effect of sa-linity was significant (P ≤ 0.01) on P concentration at the second harvest (Table 6). Changes in P con-centration under salinity depended on plant space, salinity level and salt type. The lowest concentration of Mn2+ was observed in roots of both genotypes.
Mn2+ concentration was decreased in sixth leaf of
IR651 while there was no observed change in IR29 under salinity (Table 2). Na+/K+ ratio was increased
solu-Colmer T.D., Epstein E., Dvorak J. (1995): Differential solute regulation in leaf blades of various ages in salt-sensitive wheat and salt tolerant wheat × Lophopyrum elongatum (Host) A. Löve amphiploid. Plant Physiology, 108: 1715–1724.
Dabuxilatu M., Ikeda M. (2005): Interactive effect of salinity and supplemental calcium application on growth and ionic concentration of soybean and cucumber plants. Soil Science and Plant Nutrition, 51: 549–555.
Flowers T.J., Hajibagheri M.A. (2001): Salinity tolerance in Hor-deum vulgare: ion concentrations in root cells cultivars differing in salt tolerance. Plant and Soil, 231: 1–9.
Halperin S.J., Lynch J.P. (2003): Effect of salinity on cytosolic Na+
and K+ in root hairs of Arabidipsis thaliana: in vivo
measure-ments using the flurescent dyes SBFI and PBFI. Journal of Experimental Botany, 54: 2035–2043.
Husain S., Von Caemmer S., Munns R. (2004): Control of salt transport from roots to shoots of wheat in saline soil. Functional Plant Biology, 29: 1393–1403.
Jones M.M., Turner N.C. (1980): Osmotic adjustment in expanding and fully expanded leaves of sunflower in response to water deficits. Australian Journal of Plant Physiology, 7: 181–192. Kader M.A., Lindberg S. (2005): Uptake of sodium in protoplasts
of salt sensitive and salt tolerant cultivars of rice, Oryza sativa
L. determined by the florescent dye SBFI. Journal of Experi-mental Botany, 56: 3149–3158.
Kerepsi I., Galiba G. (2000): Osmotic and salt stress induced alternation in soluble carbohydrate content in wheat seedling. Crop Science, 40: 482–487.
Lacerda C.F., Cambraya J., Cano M.A.O., Ruiz H.A., Priscu J.T. (2003): Solute accumulation and distribution during shoot and leaf development in two sorghum genotypes under salt stress. Environmental and Experimental Botany, 49: 107–120. Lutts S., Kinet J.M., Bouharmont J. (1995): Changes in plant re-sponse to NaCl during development of rice (Oryza sativa L.)
varieties differing in salinity resistance. Journal of Experimental Botany, 46: 1843–1852.
Morgan J.M. (1992): Osmotic components and properties associ-ated with genotypic differences in osmoregulation in wheat. Australian Journal of Plant Physiology, 19: 67–76.
Munns R. (2002): Comparative physiology of salt and water stress. Plant, Cell and Environment, 25: 239–250.
Munns R. (2005): Genes and salt tolerance: bringing them together. New Phytology, 167: 645–663.
Munns R., James R.A., Lauchli A. (2006): Approaches to increas-ing the salt tolerance of wheat and other cereals. Journal of Experimental Botany, 57: 1025–1043.
Munns R., Weir R. (1981): Contribution of sugars to osmotic adjustment in elongating and expanded zones of wheat leaves during moderate water deficit at two light levels. Australian Journal of Plant Physiology, 8: 93–105.
Shannon M.C., Rhoades J.D., Draper J.H., Scardaci S.C., Spyres M.D. (1998): Assessment of salt tolerance in rice cultivars in response to salinity problems in California. Crop Science, 38: 394–398.
Song J.Q., Mei X.R., Fujiyama H. (2006): Adequate internal water status of NaCl salinized rice shoots enhanced selective calcium and potassium absorption. Soil Science and Plant Nutrition,
52: 300–304.
Tester M., Davenport R. (2003): Na+ tolerance and Na+ transport
in higher plants. Annual Botany, 91: 503–527.
Yamaguchi T., Blumwald E. (2005): Developing salt-tolerant crop plants: challenges and opportunities. Trends in Plant Science,
10: 615–620.
Yushida S., Forno D.A., Cock J.H., Gomez K.A. (1976): Laboratory Measure for Physiological Studies of Rice. International Rice Research Institute, Los Banos.
Received on March 25, 2010
Corresponding author: