Social Protection and Food Security in
Sub-Saharan Africa: An Evaluation of
Cash Transfer Programmes
d’Agostino, Giorgio and Pieroni, Luca and Scarlato,
Margherita
Department of Management, University Ca’ Foscari, Venice (Italy),
Department of Economics, Finance and Statistics, University of
Perugia (Italy), Department of Economics, Roma Tre University
(Italy)
5 September 2013
Online at
https://mpra.ub.uni-muenchen.de/60888/
Giorgio d’Agostino
Department of Management, University Ca’ Foscari, Venice (Italy).
Luca Pieroni1
Department of Economics, Finance and Statistics, University of Perugia (Italy).
Margherita Scarlato
Department of Economics, Roma Tre University (Italy).
ABSTRACT
This paper evaluates the effects of cash transfer (CT) programmes on undernour-ishment in a sample of African countries during the 1990s and 2000s. We apply the synthetic control method to compare changes in the post-intervention undernourish-ment trajectories of economies affected by CT programmes with countries that are unaffected. The results suggest that CT programmes exert significant effects on the prevalence of undernourishment in low-income sub-Saharan countries, whereas the impact on dietary energy supply adequacy is more articulated. Robustness analysis via placebo experiments confirms the soundness of our results and their implications for policy-makers are also discussed.
Keywords: Sub-Saharan Africa, Undernourishment, Cash Transfers.
JEL Classification: Q1, Q18, O13
1. Introduction
Recently, threats of financial collapse and global recession, food shortages and rising food
prices have exacerbated nutrition vulnerability to adverse shocks1. One consequence has been the
increased presence of food insecurity even in countries unaffected by recurrent famine (Gentilini
1Corresponding Author: Luca Pieroni, University of Perugia, Via Alessandro Pascoli, 06123 Perugia. Tel. +39
0755855280, Fax. +39 0755855299, [email protected].
1Following the food and economic crises, in 2009 more than one billion people worldwide were undernourished
2007; Crawford et al. 2010). A number of inquiries have shown that the relationship between food intake and nutritional achievement could vary greatly depending, amongst other things, on the level of access to complementary inputs such as healthcare, basic education, clean drinking water and sanitation (Dreze and Sen 1989). These analyses supported a pragmatic approach to promoting capabilities and incentives, one that tackled hunger and food insecurity by bridging food assistance and other pillars of social protection (Crawford et al. 2010). In accordance with this perspective, new social protection measures have been implemented in numerous underdeveloped and emerging countries (Gentilini and Omamo 2011).
Social protection programmes targeting the poor, or those who may become poor as a result of adverse shocks, can take many forms: cash transfer (CT) schemes involving welfare payments, child allowances or pensions; in-kind transfers such as food aid or school food programmes; subsidies for goods purchased by the poor; unemployment insurance and public works or workfare schemes. The ’new social protection agenda’ includes interventions that link the recipients of cash or food payments to other government services and conditional cash transfer (CCT) schemes (Hoddinott 2012). These programmes provide cash payments to poor households that meet certain behavioural requirements, generally related to children’s healthcare, child nutrition and education, with the aim of promoting longer-term human capital investments (Fiszbein et al. 2009).
Despite the abundance of social protection innovations and studies assessing their effectiveness, the literature still lacks inquiries that rigorously measure the effects of such innovations in
sub-Saharan Africa (Gilligan et al. 2009)2. This paper partially fills this gap by evaluating the effects of
CTs introduced in the past 20 years on alleviating undernourishment in Africa. These programmes, which constitute the dominant form of social transfer in this region, can be provided as alternatives
or complements to vouchers or traditional food transfer programmes3. They deal with short-term
poverty by providing guaranteed extra money and serve as insurance against the risk of food insecurity.
This paper contributes to the current literature which determines whether CT has positive shifts in alleviating undernourishment. We use the synthetic control method (Abadie et al. 2010) to evaluate the effects of policy interventions on two indicators extracted by the Hunger Map compiled each year by the Food and Agriculture Organization of the United Nations (FAO): the prevalence of undernourishment (PU) and the dietary energy supply adequacy index (ADESA). These indexes are related to the access to and availability of food, which are two crucial dimensions of food insecurity (FAO 2012b). Following Billmeier and Nannicini (2013), we underline one caveat when interpreting the results obtained with this methodology. Since CT policies vary according to country application and beneficiaries, there is a difficulty when comparing CTs across countries
2An exception is Ethiopia’s Productive Safety Nets Programme (PSNP), the largest social protection programme
in sub-Saharan Africa. The PSNP has been rigorously evaluated across a range of indicators by Gilligan et al. (2009) and Sabates-Wheeler and Devereux (2011), amongst others.
using quantitative indicators. We overcome this issue by estimating the effect of CT policies as case-specific.
Our results suggest that in the selected eight African countries, CTs have differing effects on the outcomes and in five cases they significantly reduce the prevalence of undernourishment indicator. Conversely, we find a significant impact of CTs on the ADESA only in Rwanda and Sierra Leone. In most of the cases considered here, CTs are part of a large-scale humanitarian response to a food emergency and have immediate effects on food distribution. In other cases, such as in Rwanda and Sierra Leone, CT intervention is more articulated and represents the start up of a development strategy aimed at stimulating demand and triggering food supply response by local production.
The remainder of the paper is organised as follows. In Section 2, we present the data. In Section 3, we discuss methodological issues whereas in Section 4, we provide the results of our empirical analysis, discuss the main results and draw the relevant policy implications. Section 5 concludes the paper by summarising the key issues.
2. Data
In this section, we present the main variables of interest for our analysis. This is based on a large dataset of sub-Saharan African countries for the 1992-2010 period. In particular, the length of the sample period is strongly influenced by data availability.
We attempt to investigate undernourishment through two outcomes that characterise the mul-tidimensional content of food insecurity. The first is the prevalence of undernourishment (PU) which is based on the proportion of the population subject to chronic undernourishment. This measure indicates the population at risk of calorie inadequacy, estimated considering the level of habitual food consumption over one year. It proxies mainly the access dimension of food security at the country level and is extracted from the Food Security Indicators redacted yearly by the Food and Agricultural Organization (FAO 2012b).
Despite the wide adoption of this indicator in food security analyses, a number of questions
arise in its use4. With regard to content, the indicator’s reliance on the distribution of the country’s
average annual per capita food consumption means that short-term phenomena such as seasonal crises are not covered (Cafiero and Gennari 2011). In addition, chronic hunger is not the only interesting phenomenon that needs to be monitored. The evolution in food production, prevailing dietary composition and the ratio of food expenditure to other basic needs expenditures, such as health services and education, may be equally important in monitoring the state of food security (Cafiero and Gennari 2011). In contrast, the FAO’s PU indicator is adequate for our analysis
be-4See, for example, Masset (2011); De Haen et al. (2011); Cafiero (2013) for a critical review of methodological
cause the aim is to assess the country-level changes in chronic hunger affected by one specific policy
(e.g. CT) and this pattern is not significantly influenced by its main methodological weakness5.
The second outcome that we use in our analysis is the average dietary energy supply adequacy (ADESA) which expresses the Dietary Energy Supply (DES)6 as a percentage of the Average
Dietary Energy Requirement (ADER)7 in the country. Each country’s or region’s average supply
of calories for food consumption is normalised by the average dietary energy requirement estimated for its population in order to provide an index of adequacy of the food supply in terms of calories. Clearly, the goodness of this indicator is associated with the reliability of the underlying official data on production, trade and the extent of various non-food uses. In particular, the literature concentrates the debate on the role of inventory changes which affects the precision of the DES indicator in any single year. For this reason, the data on food availability are corrected for stock variations by averaging over a three-year period (Cafiero 2011).
These indexes are published by the FAO for each country annually and are calculated over a three-year moving average. This methodology is applied to smooth the temporal behaviour of the series excluding short-run fluctuations. This procedure does not weaken the results of the present investigation since our aim is to compare the undernourishment trends within countries that have experienced a CT policy. In this perspective, the use of smooth series reduces unpredictable mea-surement errors that may bias comparability between the undernourishment trends. Moreover,
analysing together the ADESA and theP U indicators enables us to discern whether
undernourish-ment is mainly due to insufficiency of food supply or to particularly bad distribution (FAO 2012b). From an interpretative point of view, countries with low average dietary energy supply adequacy may most need policies for enhancing the means of making more food available to their citizens, while in countries where the prevalence of undernourishment is high, a focus on enhancing the access and distribution of food may be required.
A number of factors, including food market characteristics and household behaviour with re-spect to food consumption influence these outcomes (Cafiero, 2013). To control for these factors, we extract four additional variables from the FAO data source which we use as covariates in the evaluation procedure: access to improved water sources (AW), access to improved sanitation fa-cilities (AS), the cereal import dependency ratio (CID) and the political stability and absence of
5Note that we cannot use anthropometric indicators of under-nutrition, which would give us complementary
information, because these measures are not available on a yearly basis and are used only for medium-term assessment of nutritional problems (De Haen et al, 2011).
6DES estimates the per capita amount of energy (kcal) in food available for human consumption, during the
reference period. The index is expressed in kcal per capita a day. Per capita supplies represent only the average supply available for each individual in the population as a whole and do not indicate what is actually consumed by individuals.
7The average of the individual’s dietary energy requirement, ADER, is a proper normative reference for adequate
violence/terrorism index (PSV). Whilst AW and AS reduce the risks of diarrhoea and other diseases that hamper the capacity to convert food into good nutritional outcomes, the CID and PSV have direct effects on a country’s probability of experiencing undernourishment (Dreze and Sen 1989; Smith 2000; Masset 2011; UNDP 2012).
In more detail, AW is measured as the percentage of the population with reasonable access to an adequate amount of water from an improved source such as a household connection, public standpipe, borehole or protected well or spring or rainwater collection. Reasonable access is defined as the availability of at least 20 litres per person per day from a source within one kilometre of the individual’s dwelling. AS refers to the percentage of the population with at least adequate access to excreta disposal facilities that can effectively prevent human, animal and insect contact with excreta. Improved facilities range from simple, but protected, pit latrines to flush toilets with a sewerage connection. To be effective, these facilities must be correctly constructed and properly maintained.
CID is the sum of imports and production minus exports by region and sub-region. When the international prices of primary commodities start to rise, highly import-dependent countries are likely to suffer, with a consequent increase in undernourishment. This variable can account for weather-related characteristics which are relevant cyclical determinants of food supply.
Finally, the PSV index represents the underlying institutional determinants of food availabil-ity. This index measures perceptions of the likelihood that the government will be destabilised or overthrown by unconstitutional or violent means, including politically motivated violence and terrorism. We use an indicator produced by the Brookings Institution and World Bank Devel-opment Research Group which reflects the statistical compilation of survey responses given by a large number of enterprises, citizens and experts in industrial and developing countries, as reported by several survey institutes, think tanks and non-governmental and international organisations. The PSV index varies from approximately -2.5 (weak stability) to 2.5 (strong stability), with an improvement in governance indicating increased food security.
3. Methods: synthetic control approach
When evaluating the effects of CTs on undernourishment, we need to compare countries that have and have not experienced these transfers. The challenge is to find countries that are suffi-ciently similar in sub-Saharan Africa to ensure that any differences in undernourishment outcomes reflect policy intervention rather than disparities in country characteristics. We follow Abadie and Gardeazabal (2003) and Abadie et al. (2010, 2012) who propose a method based on the synthetic control approach. In this framework, a weighted combination of potential control countries (the synthetic control) is constructed to approximate the most relevant characteristics linked with the undernourishment indicators of the treated countries. Schematically, when a CT is introduced,
the synthetic control method is used to estimate changes in the patterns of P U and ADESA by
comparing the observable outcome trends with those estimated in countries undergoing no policy intervention.
More formally, given a sample of sub-Saharan African countries indexed by J, we can
distin-guish between a set of J1 countries that have introduced a CT policy (treated countries) and a
set of J0 countries that are potential controls for comparison, such that J =J0 +J1. We define
the potential comparison controls as ”control group” and suppose that the characteristics of each treated unit may be better approximated by a weighted average of countries in the control group.
It is also assumed that the sample is a balanced panel for the time span t= 1, ...., T and includes
a number of pre-intervention periods T0 and post-intervention periods T1, such thatT =T0+T1.
The synthetic control can then be represented by a vector (J0×1) of weightsW =w1, ..., wJ0, with
0≤wJ0 ≤1 and w1+...+wJ0 = 1, whereW is chosen to better reassemble the characteristics of
the treated units in the synthetic control (Abadie and Gardeazabal 2003).
We defineXj1 as a (k×1) vector containing the pre-intervention characteristics of one treated
unit j1 in the set of treated unites J1, and XJ0 as a (k×J0) matrix of the pre-intervention
char-acteristics of the control group. Our intent is to find a set of W∗ that minimises the distance
Pk
m=1vm(Xj1m−XJ0mW)
2, wherem= 1, ..., kandv
mis a weight that reflects the relative
impor-tance assigned to them−thvariable when we measure the discrepancy betweenXj1 andXJ0W. By
introducing synthetic control weightsvm, we can describe the relevance of the explanatory variable
chosen to measure the synthetic control. Indeed, as Abadie et al. (2012) show, we can infer the
goodness of the chosen variables by comparing the synthetic control values of each kvariable with
their simple mean in the control group.
We now focus onY1, one vector (T1×1) of the outcome of unitj1in setJ1in post-intervention
period T1, that is, Y1 = (Yj1T0+1, ..., Yj1T)
′. Symmetrically, we define Y
0 as a matrix (T1 ×J0)
containing all of the post-intervention characteristics of the countries in the control group. The synthetic control estimator for the countries that experienced CTs in the given period is expressed as
the difference betweenY1−Y0W∗. Hence, for a given post-intervention periodt > T0, the synthetic
control estimator for a treated unit j is Yj1t−
P
J0w
∗Y
Jot. Matching variables Xj1 and XJ0 are
the intervention. Abadie et al. (2010) propose a linear factor model to estimate Y1−Y0W∗ that
reduces unmeasured factors affecting the outcome variables.
Controlling for unobservable factors ideally requires a large pre-intervention time span T0.
However, when undernourishment indicators are used as the outcome variables, trade-offs may arise between the length of the time span and their performance. As clarified in the previous section, the temporal behaviour of food insecurity is highly volatile and depends on a series of shocks. For example, epidemics, natural disasters or distractions arising from armed conflicts, can permanently modify the behaviour of the time series, net of the smoothing determined by the average over three years in constructing undernourishment indicators. As another necessary condition to evaluate the effects of CT policies, we need to find a period of time in which no other policies have been
implemented which specifically affects undernourishment. As a consequence, a sufficiently longad
hoc time span is proposed for each treated country.
To confirm the goodness of our estimated results, we perform a placebo test for each CT intervention on the two undernourishment indicators. We replicate the synthetic control estimate of each treated unit for each country in the control group. In other words, for a given country
in subset J0 that does not implement a CT policy at time t > T0, we expect an unusually large
gap in relation to the respective treated country. If we obtain this result, our interpretation is
that the analysis provides significant evidence that CTs reduce PU and/or increase ADESA. If
the placebo tests produce gaps similar to those for the treated countries, in contrast, then our interpretation is that the analysis does not constitute evidence of a significant CT impact on these undernourishment outcomes.
3.1. Case study selection
A preliminary step in the synthetic control method is to identify feasible treated units and the control group. The upper part of Table 1 lists countries that introduced CT policies (treated units) in the sample period, whilst the bottom part lists the control group countries. Appendix A provides the list of programmes being evaluated. The last column in Table 1 shows the sub-Saharan African countries by income class following the World Bank classification (Garcia and Moore 2012). This classification allows us to distinguish CTs implemented in middle-income countries from those offered to low-income countries.
sys-Table 1: Cash transfer policies in sub-Saharan Africa
Country code Country name Treatment date Income group
Treated units
LSO Lesotho∗ 2005, (2009) Middle-income
SWZ Swaziland 2005 Middle-income
BFA Burkina Faso 2008 Low income
ETH Ethiopia 2005 Low-income
KEN Kenya∗ 2005, (2009) Low-income
MWI Malawi 2006 Low-income
RWA Rwanda 2007 Low-income
SLE Sierra Leone 2007 Low-income
Control group countries
AGO Angola Middle-income
CMR Cameroon Middle-income
GAB Gabon Middle-income
MUS Mauritius Middle income
COM Comoros Low-income
GIN Guinea Low-income
MDG Madagascar Low-income
MRT Mauritania Low-income
TCD Chad Low-income
UGA Uganda Low-income
BDI Burundi Low-income
CIV Ivory Coast Low-income
COG Republic of Congo Low-income
LBR Liberia Low-income
STP Sao Tome and Principe Low-income
TGO Togo Low-income
Countries excluded: not in line with treatment requirements
BWA Botswana 1996, 2002 Middle-income
CPV Cape Verde 1992, 1995 Middle-income
NAM Namibia 2000 Middle-income
NGA Nigeria 2008, 2009 Middle-income
SEN Senegal 2009, 2010 Middle-income
ZAF South Africa 1990 Middle-income
GHA Ghana 2008 Low-income
MOZ Mozambique 1993 Low-income
NER Niger 2008 Low-income
TZA Tanzania 2010 Low-income
ZMB Zambia 2004,2006, 2007,2008 Low-income ZAR Dem. Rep. of Congo 2004 Low-income
ERI Eritrea 2009 Low-income
ZWE Zimbabwe 2004 Low-income
MLI Mali 2005 Low-income
Countries excluded: not in line with control requirements
GNQ Equatorial Guinea Middle-income
SYC Seychelles Middle-income
BEN Benin Low-income
GMB Gambia Low-income
GNB Guinea-Bissau Low-income
SDN Sudan Low-income
SOM Somalia Low-income
CAF Central African Republic Low-income
Notes: The income classification of the 48 sub-Saharan African countries presented in the third column
[image:9.612.138.477.139.728.2]tems of these programmes are usuallyad hocin nature. These programmes are generally emergency responses to natural disasters or man-made events and they are not linked to other programmes. Moreover, as Nino-Zarazua et al. (2011) note, we can identify two ”models” of social assistance in sub-Saharan Africa: one model includes age-based social transfer programmes and dominate in the middle-income countries of Southern Africa and a second model is based on social trans-fer programmes that target extreme poverty and food insecurity and is widespread in low-income countries.
The data set covers the period 1992-2010 and we fix a minimum five year pre-intervention period. For inclusion in the set of treated units, a country had to satisfy two narrow and necessary conditions: i) its CT policy had to be implemented after 1996, with a minimum pre-intervention
period (e.g.,T0 = 5) and ii) only one large-scale CT policy was implemented and other major
com-plementary policies were not implemented. The latter condition was adopted to allow identification of the effects of intervention. Following the application of these conditions, we excluded Botswana, Cape Verde, Mali, Nigeria, Senegal, South Africa, Mozambique and Zambia from the treatment sample. For example, Mali was excluded because it experimented only a small, localised pilot CT programme and implemented a number of supply-side policies that influenced undernourishment.
The exclusion from the treated sample of Ghana and Niger was determined by relevant policies which may affect undernourishment outcomes. For example, in 2004 Ghana introduced subsidies to
compensate for higher liquid petroleum gas (LPG), petrol and kerosene prices8. With expenditure
totalling about 2.2% of GDP, this intervention influencing income and food security determined a distortion of the causal estimation of the subsequent CT in 2008. Similarly, we cannot identify the effects of the implementation of the CT in Niger. Since 2005, the government has made cut-price cereals available to those who need help in recovering from shortages in the previous years and it is likely that the effects on undernourishment outcomes of this significant policy intervention are at least time-correlated with the CT intervention implemented in 2008. In addition, Tanzania and Eritrea were excluded because they had an insufficient post-intervention period. The Democratic Republic of Congo and Namibia were excluded because of missing data. Zimbabwe was excluded since it implemented multiple small-scale CTs starting in the ’90s. The final treatment sample comprises 8 countries. Note that in the majority of the middle-income countries, more than one national CT policy was implemented, thus violating condition ii). This condition restricted our analysis to Lesotho and Swaziland in middle-income countries.
The control group was also chosen to satisfy two main requirements: i) the countries therein had not experienced a CT policy or ii) any other policy with indirect but relevant effects on undernourishment. Sixteen countries met both requirements and thus formed the control group after excluding four countries that did not meet the first requirement in the 1992-2010 period.
We also excluded 4 countries (Benin, Gambia, Guinea-Bissau and Central African Republic)
that did not meet the second condition. The interventions that had important food security im-plications for these four excluded countries were: i) the Emergency Food Security Support Project (EFSSP) implemented in 2008 by the government of Benin and the World Bank (World Bank 2008b) to assist the population experiencing food insecurity following a food price crisis; ii) a well-structured programme designed to increase household and national food security through an improvement in agricultural productivity, production and producer income introduced by the gov-ernment of Gambia in 2004 (Republic of Gambia 2005); iii) the EFSSP promoted by the World Bank in Guinea-Bissau in 2008 to rescue the food-insecure population following a food price crisis; iv) several programmes to combat food insecurity launched by international agencies in the Central African Republic where about 45% of the population was living in conditions of food insecurity following the end of the country’s civil war in 2005 (World Bank 2008a; Global Food Security 2009).
4. Empirical results
4.1. Estimates
The synthetic estimator is constructed for each country as the convex combination of char-acteristics that most resembled the matching treated country in terms of the undernourishment predictors.
Table 2 and 3 display the statistical results of a comparison between the pre-treatment char-acteristics of the actual treated countries and those of the synthetic control estimators. The results highlight the affinity between a country exposed to the CT programme and its synthetic counter-part safeguarding, like the matching estimator, against estimation of extreme counterfactuals (King
and Zeng 2006)9.
The effect of the CT policies is constructed by choosing the weight w∗ which minimises the
mean squared prediction error (RM SP E) of each outcome in the treated country during the
pre-CT period. The RMSPE measures the lack of fit between the path of the outcome variables in each country and its synthetic counterpart. The pre-intervention RMSPE for a given country is defined
asRM SP E=1/T0PtT=10 Y1t−PJ0w
∗Y
Jot
21/2
. The last lines in Tables 2 and 3 confirm with the RM SP E calculation that the data are able to perform consistently in the pre-intervention period.
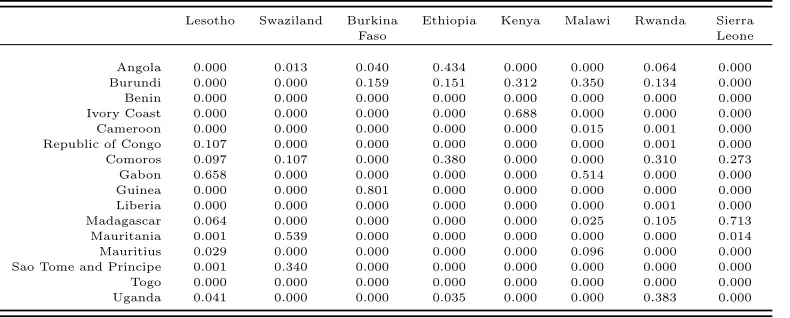
Table 4 and 5 display the weights of each control country across the synthetic estimates. These weights indicate in the first table that the PU trend in Lesotho prior to CT programme
9It should be noted that the mean estimators of the countries that did not implement a CT programme during
Table 2: Descriptive statistics for pre-treatment covariates (Outcome Variable: Prevalence of Un-dernourishment)
Lesotho Swaziland Burkina Faso
Real Synt. control Real Synt. control Real Synt. control (6 countries) (4 countries) (3 countries)
Access to improved water source 79.923 79.617 48.462 57.329 59.125 63.331 Access to improved sanitation facilities 24.615 32.686 50.923 31.067 11.188 20.066 Cereal import dependency ratio 65.500 75.307 54.523 71.948 9.488 22.636 Female primary education level 50.947 48.762 48.496 48.102 41.977 42.147 Political stability and absence of violence 0.028 0.009 -0.068 0.314 -0.077 -1.518 Agricultural population 13.558 13.457 12.840 13.066 16.185 15.739 Growth rate of per-capita GDP 3.109 -1.116 -0.997 -0.441 1.797 0.571 Mean of undernourishment prevalence 16.860 16.802 16.880 16.857 26.320 26.319
RMSPE 0.013 0.017 0.104
Ethiopia Kenya Malawi
Real Synt. control Real Synt. control Real Synt. control (4 countries) (3 countries) (3 countries)
Access to improved water source 25.308 36.647 49.923 55.358 57.417 59.684 Access to improved sanitation facilities 7.154 14.690 27.769 28.646 43.833 43.691 Cereal import dependency ratio 9.090 22.318 22.492 34.934 14.792 58.603 Female primary education level 39.667 45.618 48.915 43.519 48.923 47.754 Political stability and absence of violence -1.135 -1.132 -1.073 -1.598 -0.276 -0.603 Agricultural population 17.758 14.906 16.936 15.815 15.982 13.950 Growth rate of per-capita GDP 1.001 -0.090 -0.221 -1.812 -1.809 -1.797 Mean of undernourishment prevalence 53.860 53.845 33.92 33.914 27.250 27.232
RMSPE 0.385 0.354 0.249
Rwanda Sierra Leone
Real Synt. control Real Synt. control (5 countries) (8 countries)
Access to improved water source 66.071 65.973 44.769 51.047 Access to improved sanitation facilities 44.929 29.624 11.154 15.393 Cereal import dependency ratio 24.350 31.907 43.292 26.517 Female primary education level 50.186 46.790 42.416 47.973 Political stability and absence of violence -1.570 -0.949 -1.405 0.094 Agricultural population 15.679 15.344 14.846 15.327 Growth rate of per-capita GDP 0.429 0.432 -1.477 -1.615 Mean of undernourishment prevalence 43.680 43.668 40.360 40.365
RMSPE 0.848 0.193
Notes: We report in parentheses the number of countries used to estimate the synthetic control. The ”mean” of undernourishment prevalence is
av-eraged for the five-year pre-intervention period. TheRMSPEis estimated using the real and the synthetic control of prevalence of undernourishment
Table 3: Descriptive statistics for pre-treatment covariates (Outcome Variable: Average Dietary Energy Supply Adequacy)
Lesotho Swaziland Burkina Faso
Real Synt. control Real Synt. control Real Synt. control (4 countries) (15 countries) (5 countries)
Access to improved water source 79.923 70.625 48.462 51.061 59.125 62.888 Access to improved sanitation facilities 24.615 26.385 50.923 50.607 11.188 15.044 Cereal import dependency ratio 65.500 37.078 54.523 76.461 9.488 23.665 Female primary education level 50.946 48.811 48.496 47.833 41.977 41.977 Political stability and absence of violence 0.0283 0.010 -0.068 -0.089 -0.077 -1.369 Agricultural population 13.557 15.018 12.840 13.481 16.185 15.807 Growth rate of per-capita GDP 3.108 0.340 -0.997 1.881 1.797 0.785 Mean of dietary energy supply adequacy 84.341 84.346 82.481 82.323 90.543 90.466
RMSPE 0.219 0.375 0.089
Ethiopia Kenya Malawi
Real Synt. control Real Synt. control Real Synt. control (3 countries) (3 countries) (3 countries)
Access to improved water source 25.308 30.130 49.923 57.096 57.417 67.386 Access to improved sanitation facilities 7.154 25.721 27.769 34.680 43.833 32.206 Cereal import dependency ratio 9.090 25.489 22.492 32.870 14.792 73.761 Female primary education level 39.667 45.795 48.915 47.090 48.923 48.091 Political stability and absence of violence -1.135 -1.240 -1.073 -1.036 -0.276 -0.762 Agricultural population 17.758 15.201 16.936 14.996 15.982 13.838 Growth rate of per-capita GDP 1.001 0.806 -0.221 -2.544 -1.809 -1.515 Mean of dietary energy supply adequacy 66.047 66.267 73.953 73.775 81.589 81.598
RMSPE 0.824 0.681 0.101
Rwanda Sierra Leone
Real Synt. control Real Synt. control (5 countries) (3 countries)
Access to improved water source 66.071 65.062 44.769 59.251 Access to improved sanitation facilities 44.928 35.479 11.153 26.589 Cereal import dependency ratio 24.350 25.165 43.292 42.844 Female primary education level 50.186 46.463 42.415 46.760 Political stability and absence of violence -1.570 -1.535 -1.405 -0.584 Agricultural population 15.678 15.726 14.846 14.767 Growth rate of per-capita GDP 0.429 0.304 -1.476 -1.494 Mean of dietary energy supply adequacy 71.937 72.711 73.333 73.329
RMSPE 0.326 0.396
Notes: We report in parentheses the number of countries used to estimate the synthetic controls. The ”mean” of dietary energy supply adequacy
is the average in the five-year pre-intervention period. TheRMSPEis estimated using the real and synthetic control of dietary energy supply
implementation is best represented by the combination of Gabon (0.657), Republic of Congo (0.107)
and six other countries for its complement (0.235), whilst the other countries haveW−weight= 0.
[image:14.612.113.508.225.384.2]We extend this interpretation by creating counterfactual samples for all of the columns in Table 4 and 5 which represent the weight of estimates in countries subjected to a CT programme.
Table 4: Comparison countries for each selected treatment unit (Variable: Prevalence of Under-nourishment)
Lesotho Swaziland Burkina Ethiopia Kenya Malawi Rwanda Sierra
Faso Leone
Angola 0.000 0.013 0.040 0.434 0.000 0.000 0.064 0.000 Burundi 0.000 0.000 0.159 0.151 0.312 0.350 0.134 0.000 Benin 0.000 0.000 0.000 0.000 0.000 0.000 0.000 0.000 Ivory Coast 0.000 0.000 0.000 0.000 0.688 0.000 0.000 0.000 Cameroon 0.000 0.000 0.000 0.000 0.000 0.015 0.001 0.000 Republic of Congo 0.107 0.000 0.000 0.000 0.000 0.000 0.001 0.000 Comoros 0.097 0.107 0.000 0.380 0.000 0.000 0.310 0.273 Gabon 0.658 0.000 0.000 0.000 0.000 0.514 0.000 0.000 Guinea 0.000 0.000 0.801 0.000 0.000 0.000 0.000 0.000 Liberia 0.000 0.000 0.000 0.000 0.000 0.000 0.001 0.000 Madagascar 0.064 0.000 0.000 0.000 0.000 0.025 0.105 0.713 Mauritania 0.001 0.539 0.000 0.000 0.000 0.000 0.000 0.014 Mauritius 0.029 0.000 0.000 0.000 0.000 0.096 0.000 0.000 Sao Tome and Principe 0.001 0.340 0.000 0.000 0.000 0.000 0.000 0.000 Togo 0.000 0.000 0.000 0.000 0.000 0.000 0.000 0.000 Uganda 0.041 0.000 0.000 0.035 0.000 0.000 0.383 0.000
Notes: Countries andW−W eightsfor synthetic controls constructed from the best fitting combination of countries.
The patterns of the figures we present below show the PU trends in the treated countries (solid line) and synthetic control samples (dotted line) during the 1992-2010 period with the results of the placebo tests alongside. We first consider the two medium-income countries, Lesotho and
Swaziland, which introduced CTs in 2005 (Figure 1: panelsa and b). PU in the synthetic Lesotho
closely tracks the trajectory of this variable in the pre-treatment period (panels c and d). Along
with the previous estimates of the pre-treatment covariates, the synthetic Lesotho thus provides an approximation of the PU that would have been recorded in Lesotho after 2005 in the absence of any CT. Note that the real PU trend shows no change in trajectory following policy implementation. We
conclude that CTs did not improve food security in Lesotho10. The same pattern and statistical
result is shown when we used ADESA as a response outcome (panels c and d). Applying the same line of reasoning to the case of Swaziland, we found that the country’s real trend diverged from the trajectory of its synthetic control in an unexpected direction, i.e. there was an increase in undernourishment, immediately after CTs introduction. These results were also confirmed by ADESA, with an unexpected decrease in 2005 of the average of calories after the introduction of the CT.
A different picture emerges for low-income countries. Panels (a) to (f) in Figure 2 show the
10In the case of Lesotho, we stopped our analysis before 2009 when a second CT programme, the Child Grants
Fig. 1.— Cash transfer policies and food insecurity, Middle-income countries A. Lesotho
10
15
20
Prevalence of undernourishment
2000 2001 2002 2003 2004 2005 2006 2007 2008 2009 2010
year
(a) estimate
−15
−10
−5
0
5
10
2000 2001 2002 2003 2004 2005 2006 2007 2008 2009 2010
year
(b) placebo test
75
80
85
90
95
Average Dietary Energy Supply Adequacy
2000 2001 2002 2003 2004 2005 2006 2007 2008 2009 2010
year
(c) estimate
−10
−5
0
5
10
2000 2001 2002 2003 2004 2005 2006 2007 2008 2009 2010
year
(d) placebo test
B. Swaziland
10
15
20
25
30
Prevalence of undernourishment
2000 2001 2002 2003 2004 2005 2006 2007 2008 2009 2010
year
(e) estimate
−20
−10
0
10
20
2000 2001 2002 2003 2004 2005 2006 2007 2008 2009 2010
year
(f) placebo test
70
75
80
85
90
Average Dietary Energy Supply Adequacy
2000 2001 2002 2003 2004 2005 2006 2007 2008 2009 2010
year
(g) estimate
−20
−15
−10
−5
0
5
10
15
20
2000 2001 2002 2003 2004 2005 2006 2007 2008 2009 2010
year
(h) placebo test
Notes: The solid line shows the real behaviour of the PU variable, whereas the dotted line is the synthetic control. The covariates used for the
Table 5: Comparison countries for each selected treatment unit (Variable: Average Dietary Energy Supply Adequacy)
Lesotho Swaziland Burkina Ethiopia Kenya Malawi Rwanda Sierra
Faso Leone
Angola 0.000 0.342 0.000 0.640 0.000 0.000 0.087 0.063 Burundi 0.000 0.000 0.000 0.067 0.000 0.183 0.352 0.234 Benin 0.000 0.002 0.000 0.000 0.000 0.000 0.000 0.000 Ivory Coast 0.000 0.001 0.098 0.000 0.000 0.000 0.000 0.000 Cameroon 0.000 0.005 0.000 0.000 0.000 0.000 0.001 0.000 Republic of Congo 0.000 0.001 0.000 0.000 0.077 0.332 0.024 0.000 Comoros 0.000 0.000 0.000 0.293 0.000 0.000 0.130 0.253 Gabon 0.000 0.001 0.000 0.000 0.000 0.485 0.000 0.000 Guinea 0.000 0.002 0.836 0.000 0.250 0.000 0.000 0.000 Liberia 0.000 0.001 0.000 0.000 0.000 0.000 0.000 0.000 Madagascar 0.456 0.055 0.042 0.000 0.000 0.000 0.000 0.214 Mauritania 0.172 0.001 0.000 0.000 0.132 0.000 0.000 0.236 Mauritius 0.125 0.350 0.000 0.000 0.000 0.000 0.000 0.000 Sao Tome and Principe 0.076 0.232 0.000 0.000 0.541 0.000 0.000 0.000 Togo 0.000 0.003 0.000 0.000 0.000 0.000 0.000 0.000 Uganda 0.171 0.002 0.024 0.000 0.000 0.000 0.406 0.000
Notes: Countries andW−W eightsfor synthetic controls constructed from the best fitting combination of countries.
main outcomes of analysis of the low-income group. The only case which is not significant is Burkina Faso. This result is not surprising because a number of extremely segmented and decentralised CT programmes existed in this country, but it was only in 2008 that the government decided to launch a pilot CT programme with a large coverage as part of a broader project created to help orphans and vulnerable children.
The figure also shows that the PU in the synthetic control estimated for Rwanda, Kenya, Ethiopia, and Malawi displayed a primarily upward trend, whilst the real PU trend in these
coun-tries underwent a sharp decline immediately after CT policy intervention11. The difference between
the two trajectories in subsequent years suggests a large improvement in this undernourishment outcome. The estimate for the ADESA outcome is, on the other hand, less significant. There is a significant increase for the amount of calorie supply after the CT policy only in Rwanda.
Finally, the estimates show that the PU trend for the synthetic Sierra Leone continued on its moderate downward trajectory, whilst the real trend underwent a sharper decline. In the post-intervention period, we estimated a significant reduction in the prevalence of undernourishment in this country. The placebo test for Sierra Leone presents a clear picture concerning interpretation of the causal effects of CTs on the PU. The CT also significantly affects food calorie supply in Sierra Leone.
It must be stressed that in many cases the introduction of CT programmes is a gradual process
11In the case of Kenya, we stopped our analysis before 2009 when a second CT programme, the Hunger Safety Net
F ig. 2. — C as h tr an sf er p ol ic ie s an d fo o d in se cu ri ty , Lo w -i n com e cou n tr ie s C . B u rk in a F as o 20 25 30 Prevalence of undernourishment
2003 2004 2005 2006 2007 2008 2009 2010 year (a ) es ti m a te −10 −5 0 5 10 2003 2004 2005 2006 2007 2008 2009 2010 year (b ) p la ce b o te st 85 90 95 100
Average Dietary Energy Supply Adequacy
2003 2004 2005 2006 2007 2008 2009 2010 year (c ) es ti m a te −10 −5 0 5 10 2003 2004 2005 2006 2007 2008 2009 2010 year (d ) p la ce b o te st E . E th iop ia 40 45 50 55 60
Prevalence of undernourishment
2000 2001 2002 2003 2004 2005 2006 2007 2008 2009 2010 year (e ) es ti m a te −10 −5 0 5 10 2000 2001 2002 2003 2004 2005 2006 2007 2008 2009 2010 year (f ) p la ce b o te st 55 60 65 70 75
Average Dietary Energy Supply Adequacy
2000 2001 2002 2003 2004 2005 2006 2007 2008 2009 2010 year (g ) es ti m a te −10 −5 0 5 10 2000 2001 2002 2003 2004 2005 2006 2007 2008 2009 2010 year (h ) p la ce b o te st F . K en y a 25 30 35 40 45
Prevalence of undernourishment
2000 2001 2002 2003 2004 2005 2006 2007 2008 2009 2010 year (i ) es ti m a te −10 −5 0 5 10 2000 2001 2002 2003 2004 2005 2006 2007 2008 2009 2010 year (j) p la ce b o te st 65 70 75 80 85
Average Dietary Energy Supply Adequacy
[image:17.612.88.538.85.715.2]F ig. 3. — * C as h tr an sf er p ol ic ie s an d fo o d in se cu ri ty , Lo w -i n com e cou n tr ie s H. M al aw i 20 25 30 Prevalence of undernourishment
1999 2000 2001 2002 2003 2004 2005 2006 2007 2008 2009 2010 year (a ) es ti m a te −10 −5 0 5 10 15 2000 2001 2002 2003 2004 2005 2006 2007 2008 2009 2010 year (b ) p la ce b o te st 70 75 80 85 90
Average Dietary Energy Supply Adequacy
1999 2000 2001 2002 2003 2004 2005 2006 2007 2008 2009 2010 year (c ) es ti m a te −10 −5 0 5 10 1999 2000 2001 2002 2003 2004 2005 2006 2007 2008 2009 2010 year (d ) p la ce b o te st I. R w an d a 30 35 40 45 50 55
Prevalence of undernourishment
2001 2002 2003 2004 2005 2006 2007 2008 2009 2010 year (e ) es ti m a te −15 −10 −5 0 5 10 2001 2002 2003 2004 2005 2006 2007 2008 2009 2010 year (f ) p la ce b o te st 65 70 75 80
Average Dietary Energy Supply Adequacy
2002 2003 2004 2005 2006 2007 2008 2009 2010 year (g ) es ti m a te −10 −5 0 5 10 2002 2003 2004 2005 2006 2007 2008 2009 2010 year (h ) p la ce b o te st J . S ie rr a Le on e 30 35 40 Prevalence of undernourishment
2000 2001 2002 2003 2004 2005 2006 2007 2008 2009 2010 year (i ) es ti m a te −10 −5 0 5 10 2000 2001 2002 2003 2004 2005 2006 2007 2008 2009 2010 year (j) p la ce b o te st 65 70 75 80 85
Average Dietary Energy Supply Adequacy
[image:18.612.99.541.72.716.2]that starts with a number of small-scale experiments, involving just a few thousand recipients and funded by external donors, followed by an expansion of cash coverage. For this reason, for some countries (i.e. Rwanda and Sierra Leone) the evidence shows a positive impact on undernourishment before the date of implementation of the official CTs programmes. Despite this limitation that challenges the identification of the policy being evaluated, we stress that in the placebo test the effects of CTs become significant only when the programmes reach a massive scale, thus supporting the robustness of the evaluation.
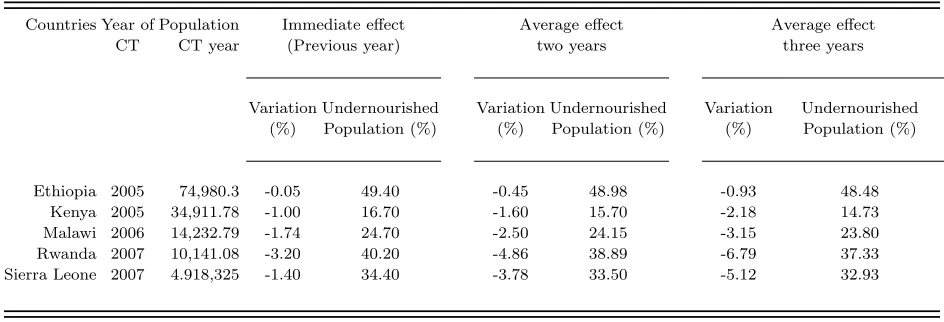
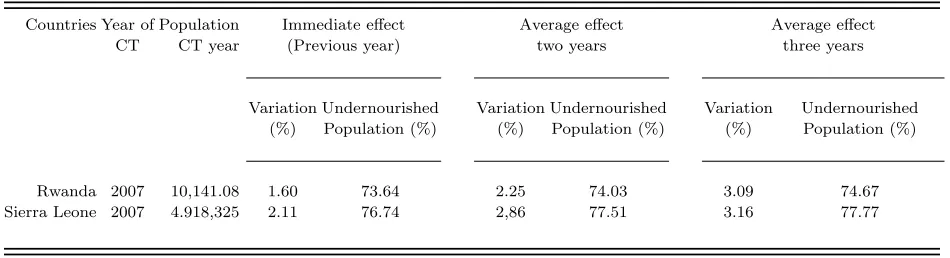
Table 6 lists the countries where CTs had significant effects on the PU estimates in terms of variations of the outcome over time and the percentage of the population who were undernour-ished. Table 7 reports the CT effects in countries where the ADESA outcome is also significant. The undernourished population variation is obtained by subtracting the estimated reduction of un-dernourishment obtained by the synthetic control method from the percentage of undernourished population (based on PU or ADESA). The immediate effects of CT policies are reported in these tables along with the average effects after two and three years. The estimates for years after the third year are not listed because they may be affected by the progressive importance of confounders. Finally, the tables list the total population during the year of intervention to give an impression of the magnitude of the impact. For example, from Table 6, we find that the three-year average effect of the CT in Kenya reduces PU of 2.2 percentage points, whereas in Rwanda decreases about 6.8 percentage points. When we consider the impact of CT in absolute terms of the outcome, the results is slightly different. Using the population in Kenya and Rwanda in the year of intervention - 35 million and about 10 million, respectively - the effect of the CT in Kenya involving about 770,000 people is as important as that the one in Rwanda which involves about 680,000 people. Interestingly, the magnitude of the CT effects had a large effect on undernourishment in Rwanda, Sierra Leone, Malawi and Kenya, with a reduction of between 6.79 and 2.18 percentage points (3-year mean value). A weaker reduction effect of less than 1 percentage point (3-year mean value) was shown in Ethiopia. In some of these countries, CTs induced an immediate increase in the adequacy of the dietary energy supply which complemented the distribution effect proxied by the prevalence of undernourishment index. For example, after three years in Rwanda and Sierra Leone, the ADESA outcome recorded a more than 1.5 percentage point increase.
4.2. Discussion and policy implications
Table 6: Cash transfer effects on prevalence of undernourishment
Countries Year of Population Immediate effect Average effect Average effect
CT CT year (Previous year) two years three years
Variation Undernourished Variation Undernourished Variation Undernourished (%) Population (%) (%) Population (%) (%) Population (%)
Ethiopia 2005 74,980.3 -0.05 49.40 -0.45 48.98 -0.93 48.48 Kenya 2005 34,911.78 -1.00 16.70 -1.60 15.70 -2.18 14.73 Malawi 2006 14,232.79 -1.74 24.70 -2.50 24.15 -3.15 23.80 Rwanda 2007 10,141.08 -3.20 40.20 -4.86 38.89 -6.79 37.33 Sierra Leone 2007 4.918,325 -1.40 34.40 -3.78 33.50 -5.12 32.93
Notes: Yearly effects of policy introduction on the prevalence of undernourishment, along with the two and three year averages, for each country.
Age Grant for poor people over 60 introduced in Swaziland in 2005 had any appreciable effect on undernourishment.
A possible explanation is that Lesotho, like most of middle-income countries, has adopted a rights-based social protection system that already covers a wide range of vulnerable groups. Thus, the effect of various social policies may conceal the positive influence of CTs on undernourishment. In addition, the rapid increase in food prices after 2005 resulted in reduced purchasing power for pensioners and measures such as CTs became inadequate to meet the nutritional needs of this group (Croome et al. 2007).
In Swaziland, in contrast, we have a counterintuitive result: after CT implementation, the indicator of undernourishment increased. The explanation of this result may lie in the simultaneous food crisis that began to unfold its effects in 2005. In the wake of this crisis, CTs proved ineffective in Swaziland for two reasons: their lack of universal coverage and the huge administrative problems associated with the old age grant - e.g., high transfer and disbursement costs and fraud (Garcia and Moore 2012). In fact, Swaziland is a peculiar case facing a number of long-term systemic problems, including the interaction between food insecurity, HIV/AIDS and drought which cannot
be addressed by the CTs in place12 .
The success stories are focused on low-income countries in which CTs have been proved to be effective in enhancing undernourishment. It must be stressed that this analysis does not always clarify the transmission channel through which reductions in the PU are achieved. We speculate that the drivers of CTs’ effects on food security improvements are linked to the response of food
Table 7: Cash transfer effects on average dietary energy supply adequacy
Countries Year of Population Immediate effect Average effect Average effect
CT CT year (Previous year) two years three years
Variation Undernourished Variation Undernourished Variation Undernourished (%) Population (%) (%) Population (%) (%) Population (%)
Rwanda 2007 10,141.08 1.60 73.64 2.25 74.03 3.09 74.67
Sierra Leone 2007 4.918,325 2.11 76.74 2,86 77.51 3.16 77.77
Notes: Yearly effects of policy introduction on the average dietary energy supply adequacy, along with the two and three year averages, for each
country.
purchases, made possible by changes in household income. In particular, given that food is a luxury for a large proportion of the population in poor countries, the share of food consumption increases with additional income at low levels of total consumption distribution, an argument largely discussed by Ibrahim et al. (2007) using the Ethiopian Urban Household Survey.
We emphasise that generally these CT programmes have been funded by both governments and foreign donors and administered by government institutions, with the universal aim of reducing the socio-economic vulnerability of a large proportion of the population. In most cases, CTs have been a response of the humanitarian emergencies (FAO 2009; United Nations 2009; Harvey et al. 2010), instead of long-term strategies, as in the case of Ethiopia’s Productive Safety Net Programm-Direct
Support13.
In the case of Malawi, the CT pilot programme that was launched in 2006 and then scaled up countrywide (the Social Cash Transfer Programme, funded by the government and UNICEF) was a tool within the Government of Malawi’s National Social Welfare Policy targeted at ultra poor and labour constrained households. Transfers were provided to female household representatives with the specific purpose of improving both food security and children’s school enrolment and attendance (Miller et al. 2010, 2011). The length of the pilot programme and the progressive scale up appears to be a determinant of the success with respect to Kenya. In fact, in Kenya the CT for Orphans and Vulnerable Children targeted at individuals living in HIV-affected households began as a pre-pilot in 2004. The programme expanded the scale and transfer in 2005 attempting to condition transfers on human capital investment in children’s health and education (World Bank, 2009). The overall findings related to the cases of Malawi and Kenya contribute to providing evidence in favour of CTs linked to human capital investments and targeted at women and children for their role in
13For a discussion of Ethiopia’s CT scheme see, Gilligan et al. (2009); Sabates-Wheeler and Devereux (2010); B´en´e
combating hunger and promoting nutrition security (Bassett 2008).
Given that all these interventions aim to promote recovery after an emergency, the improve-ment of the prevalence of undernourishimprove-ment indicator is the expected result. Instead, the CTs programmes have had a positive and significant influence on both the undernourishment and en-ergy supply indicators in Rwanda and Sierra Leone. In Rwanda, government designed a social protection policy at the end of 2005, introducing different schemes and interventions to reduce poverty including social transfers to specific vulnerable groups (for example, the Ubudehe Pro-gramme). These scattered interventions had a limited impact on poverty because they reached an extremely low number of people and had no systematic coordination (ILO, 2011). In 2008 a new process started which introduced a coherent social protection strategy to replace the plethora of small programmes and fragmented services. In particular, the Vision 2020 Umurenge Programme (VUP) was launched, providing three components to encourage both protection and production:
public works, direct support and financial services14.
Similarly, in 2005 Sierra Leone was recovering from a decade of civil war and introduced the Poverty Reduction Strategy to improve vulnerable groups’ access to food, social services and other social safety nets (Holmes and Jackson 2007). The Social Safety Net pilot programme was implemented in 2007 following a community-based approach with the objective of assisting the most vulnerable people, although as discussed above sparse and small cash transfer schemes were introduced to assist post-conflict transition. The beneficiaries were typically the elderly and those lacking a stable income in accordance with the strategic objective of increasing social cohesiveness in the aftermath of the conflict.
In summary, complementarities in development policies for the enhancement of food supply and poverty reduction in Rwanda and the community-driven experience of Sierra Leone show that institutional arrangements are also of paramount importance in determining the effects of CTs on the quantitative measures of undernourishment (Devereux 2009, 2012). This explanation concurs with the views of Harvey and Homes (2007), Holmes and Jackson (2007) and Slater (2009) that social policy in the post-conflict context helps to provide an enabling environment for growth, bridging the gap between crisis and development.
5. Concluding remarks
In this paper, we estimate the effects of CT policies on undernourishment in a sample of African countries. We study the patterns of prevalence of undernourishment and average dietary energy supply adequacy amongst the low- and middle-income countries targeted by CT policies. The availability of similar countries that have not implemented these policies allows us to estimate
14For a discussion on social protection in Rwanda, see Jones et al. (2005); B´en´e et al. (2012); Sabates-Wheeler and
the short-to-medium term effects of these programmes under a quasi-experimental framework.
We find that the application of CTs programmes in low-income countries leads generally to a reduction in the prevalence of undernourishment over three years. Conversely, these policies resulted in no significant improvements in food security in countries classified in the middle-income counterparts. Although anticipated or correlated forces may sparsely affect the results of the CT application on undernourishment, our results lead us to conclude that CT policies are important where the reaction of food consumption to impulses in available income is large. The channels through which CTs activate food consumption have been particularly effective when a development strategy has been implemented, either linked to humanitarian or post-conflict emergencies or to comprehensive interventions to reduce poverty. In some of these cases, an increase in ADESA, in addition to an improvement in the distribution of food, is also evident.
Some limitations of the paper must be noted. The first concerns the use of macro-data to assess the impact of CTs. In particular, the estimates based on CT programmes, which are nationwide and widespread, are not obtained through specific control groups, which is possible when using micro-datasets. Moreover, the unconditional nature of the CTs does not necessarily lead to spending the bulk of them on food which may affect the estimates of the effects on the undernourishment.
The second limitation concerns the outcomes used to evaluate the impact of CTs on under-nourishment. Since the food indicators are mainly based on caloric availability, the conclusions regarding changes in purchased food are largely related to staple foods. This implies that im-provements should be extended, theoretically and empirically, to include diet quality. Both these limitations should be accounted in future works.
–
23
–
Country/Programme Start year Beneficiaries Spending (annual budget)
Lesotho
Old Age Pension 2004 78,064 individual beneficiaries (in 2009) 1.4% of GDP (in 2007)
Swaziland
Old Age Grant 2005 60,000 individual beneficiaries (in 2007) Varies according to annual funding (US$8.6 million in
2006/2007)
Burkina Faso
Burkina Faso pilot CCT-CT pilot 2008 3,250 households (in 2008) Not available
Ethiopia
Productive Safety Net Programme - Direct Support 2005 1,200,000 individual beneficiaries (in 2009) US$414 million (1.38% of GDP in 2009)
Kenya
CT for Orphans and Vulnerable People 2005 (pre-pilot 2004) 74,000 households (in 2009) Expected cost US$26 million (in 2010)
Malawi
Social Cash Transfer 2006 94,386 individual beneficiaries (in 2009) Expected cost 1.4% of GDP (in 2014)
Rwanda
Vision 2020 Umurenge Programme 2007 24,400 households (in 2009) Expected cost US$ 16.7 million (in 2012)
Sierra Leone
Pilot Social Safety Net Cash Transfer 2007 16,000 individual beneficiaries (in 2012) Not available
REFERENCES
Abadie, A., Diamond, A., Hainmueller, J., 2010. Synthetic control methods for comparative case studies: estimating the effect of California’s tobacco control program. Journal of the Amer-ican Statistical Association 105 (490), 493–505.
Abadie, A., Diamond, A. J., Hainmueller, J., 2012. Comparative politics and the synthetic control method. Tech. rep., MIT Political Science Department Research Paper.
Abadie, A., Gardeazabal, J., March 2003. The economic costs of conflict: a case study of the Basque Country. American Economic Review 93 (1), 113–132.
Bassett, L., 2008. Can conditional cash transfer programs play a greater role in reducing child undernutrition? Social Protection Discussion Papers 46687, The World Bank.
Behrman, J. R., Wolfe, B. L., 1987. How does mother’s schooling affect family health, nutrition, medical care usage, and household sanitation? Journal of Econometrics 36 (12), 185-204.
B´en´e, C., Devereux, S., Sabates-Wheeler, R., 2012. Shocks and social protection in the Horn of Africa: analysis from the productive safety net programme in Ethiopia. Tech. Rep. 395, IDS Working Paper, Brighton.
Billmeier, A. and Nannicini, T. 2013. Assessing Economic Liberalization Episodes: A Synthetic Control Approach, The Review of Economics and Statistics. 95 (3), 983-1001.
Burchi, F., De Muro, P., 2012. A human development and capability approach to food security: conceptual framework and informational biases. Tech. Rep. 9, UNDP, Washington D.C.
Cafiero, C., Gennari, P., 2011. The FAO indicator of the prevalence of undernourishment. Paper prepared for the Workshop on Measuring Food Insecurity and Assessing the Sustainability of Global Food Systems, Keck Center of the National Academies, Washington D.C.
Cafiero, C., 2011. Advances in hunger measurement. Traditional FAO methods and recent innova-tions. Tech. rep., FAO, Rome.
Cafiero, C., 2013. What do we really know about food security? NBER Working Paper No.18861, NBER, Washington DC.
Crawford, N., Pattugalan, G., Dale, K., 2010. Revolution: From food aid to food assistance. WFP, Rome.
De Haen, H., Klasen, S. and Qaim, M, 2011. What do we really know? Metrics for food insecurity and undernutrition. Food Policy 36(6), 760-769.
Devereux, S., 2009. Why does famine persist in Africa? The Science, Sociology and Economics of Food Production and Access to Food 1 (1), 25–35.
Devereux, S., 2012. Social protection for enhanced food security in Sub-Saharan Africa. Work-ing Papers 2012-010, United Nations Development Programme, Regional Bureau for Africa (UNDP/RBA).
Dreze, J., Sen, A., 1989. Hunger and public action. Oxford University Press, Oxford.
FAO, 2009. Hunger in the face of crises. Tech. rep., FAO, Rome.
FAO, 2011. The state of food insecurity in the world 2011. Tech. rep., FAO, Rome.
FAO, 2012a. The state of food insecurity in the world 2012. Tech. rep., FAO, Rome.
FAO, 2012b. HUNGER MAP. Rome, Italy: FAO.
Fiszbein, A., Schady, N., Ferreira, F. H. G., Grosh, M., Keleher, N., Olinto, P., Skoufias, E., July 2009. Conditional cash transfers: reducing present and future poverty. No. 2597 in World Bank Publications. The World Bank.
Garcia, M., Moore, C. M. T., 2012. The cash dividend: the rise of cash transfers programs in Sub-Saharan Africa. The World Bank.
Gentilini, U., 2007. Cash and food transfers: a primer. Tech. rep. 18, WFP Occasional Paper, Rome.
Gentilini, U., Omamo, S. W., June 2011. Social protection 2.0: exploring issues, evidence and debates in a globalizing world. Food Policy 36 (3), 329–340.
Gilligan, D., Hoddinott, J., Taffesse, A. S., 2009. The impact of Ethiopia’s Productive Safety Net Programme and its linkages. The Journal of Development Studies 45 (10), 1684–1706.
Global Food Security, 2009. Central African Republic report. Tech. rep., United Nations.
Grosh, M., del Ninno, C., Tesliuc, E., Ouerghi, A., 2008. For protection and promotion: the design and implementation of effective safety nets. Tech. rep., World Bank.
Harvey, P., Homes, R., 2007. The potential for joint programmes for long-term cash transfers in unstable situations. Tech. rep., Humanitarian Policy Group, ODI, London.
Hoddinott, J., 2012. Social protection in West Africa. Tech. rep. 3, IFPRI Thematic Research Note, Washington, D.C.
Holmes, R., Barrientos, A., 2009. The potential role of cash transfers in addressing childhood poverty and vulnerability in West and Central Africa. Regional thematic report, UNICEF, ODI, London.
Holmes, R., Jackson, A., 2007. Cash transfers in Sierra Leone: appropriate, affordable and feasible? Project Briefing Paper 8, ODI, London.
Ibrahim, G., Kedir, A., Torres, S., 2007. Household-level credit constraints in urban Ethiopia, Discussion Papers in Economics 07/03, Department of Economics, University of Leicester.
Jones, S., Matiza, G., Mlalazi, B., Wiggins, S., 2005. Zimbabwe: Protracted Relief Programme. Output to purpose review. Tech. rep., ODI, London.
Kassouf, A. L., Senauer, B., July 1996. Direct and indirect effects of parental education on mal-nutrition among children in Brazil: a full income approach. Economic Development and Cultural Change 44 (4), 817–38.
King, G., Zeng, L., 2006. The dangers of extreme counterfactuals. Political Analysis 14, 131–159.
Masuku, M. B., Sithole, M., June 2009. The impact of HIV/AIDS on food security and household vulnerability in Swaziland. Agrekon 48 (2).
Masset, E., January 2011. A review of hunger indices and methods to monitor country commitment to fighting hunger. Food Policy 36 (Supplement), S102–S108.
Miller, C. M., Tsoka, M., Reichert, K., 2010. Targeting cash to Malawi’s ultra-poor: a mixed methods evaluation. Development Policy Review 28 (4), 481–502.
Miller, C. M., Tsoka, M., Reichert, K., 2011. The impact of the social cash transfer scheme on food security in Malawi. Food Policy 36 (2), 230–238.
Nino-Zarazua, M., Barrientos, A., Hickey, S. and Hulme, D, 2011. Social protection in sub-Saharn Africa: getting the politics right. World Development, 40(1), 163-176.
Pereznieto, P., 2009. Social protection to tackle child poverty in Malawi. Project Briefing Paper 25, ODI, London.
Republic of Gambia, 2005. Support of NEPADCAADP implementation. Tech. rep., Government of the Republic of Gambia & FAO.
Sabates-Wheeler, R., Devereux, S., 2011. Transforming livelihoods for resilient futures: how to facil-itate graduation in social protection programme. Tech. rep. 3, Centre for Social Protection, Brighton.
Slater, R., 2009. Cash transfers: growth and graduation. Project Briefing 29, ODI, London.
Smith, R. P., 2000. Defence expenditure and economic growth. Regina Books, California.
UNDP, 2012. Africa human development report 2012. Towards a food secure future. Tech. rep., UNDP, Washington, DC.
United Nations, 2009. High-level task force on the global food security crisis. Progress report, April 2008-October 2009. Tech. rep., United Nations, Washington, DC.
World Bank, 2008a. Guinea Bissau. Food price crisis response program (p113468). Tech. rep., World Bank.