Helicobacter pylori microbe and detecting with data mining
algorithms
Amir Hossein Rasekh*, Zeinab Liaghat, Alireza Tabebordbar
Computer Science and Engineering Department, Shiraz University, Shiraz, Iran Email: [email protected]
Received 20 February 2013; revised 2 April 2013; accepted 6 May 2013
Copyright © 2013 Amir Hossein Rasekh et al. This is an open access article distributed under the Creative Commons Attribution License, which permits unrestricted use, distribution, and reproduction in any medium, provided the original work is properly cited.
ABSTRACT
Nowadays medicines believe that the only definite method to diagnose the existence of Helicobacter py-
lori microbe is performing endoscope, however it’s
painful and insufferable for young children. Thus in this paper we used data mining algorithms to diag- nose the existence of this microbe and eventually we succeeded in predicting the existence of this bacte- rium in stomach that guides medicines to perform Endoscopy just in cases where percentage of finding this bacterium is high.
Keywords:Data Mining; Helicobacter pylori; Regression; RBF Network; Part
1. INTRODUCTION
In recent years, helicobacter pylori microbe has gained lots of attention and become prevalent among children. It is curved bacterium and usually lives in the stomach and many people around the world are affected by this bacte-rium. This bacterium not only leads to disorder in diges-tive system, but also; if it doesn’t cure, it may cause dis-ease like gastric cancer or peptic ulcer.
Helicobacter pylori is prevalent pathogen in human and scientists believe this bacterium is more prevalent in unhygienic and crowded places and they guess Helico- bacter pylori is contagious microbes and they can trans- fer from one person to another [1].
There are different methods we can use to diagnose the existence of this bacterium, but generally, we can classify them in two groups: aggressive and non-aggres- sive methods. Aggressive methods include performing Endoscopy and non-aggressive methods include taking blood sample, respiratory test and urine analysis.
In fact it’s a gram negative S shape, micro aerophilic, spiral bacterium and its length is about 3.5 micron and its width is about 0.5 micron. The outer cover of this bac- terium is flat and covered with lots of flagel.
In this paper we talked about the type of disease, method of healing, side effects and suggested methods to detect this bacterium stomach.
1.1. History of Helicobacter pylori
Helicobacter pylori is known as H. pylori. They grow in stomach and about half of the people in the world are affected by this bacterium, but just a group of them are affected by side effects of H. pylori infection and most of them never feel any illness despite being affected by this microbe. On the other side; H. pylori infection can lead to peptic ulcer disease or gastric cancer. Still it is a question why the side effects of this bacterium are ap- pearing in a group of people and it doesn’t cause any illness in the other ones?
In fact, the prevalence of infection in different coun- tries and in various populations of a country varies and it has strong relation with economic and social status of people living in that country. For example, in advanced and high tech countries, the infection of H. pylori is un- usual and it’s not prevalent in children. In these countries just 5% of children under 5 years old are affected by this bacterium, on the other side; in less advanced countries
Helicobacter pylori bacterium mostly appears in young children and a high percentage of children under 10 years old are affected by this bacterium and it’s not prevalent in adult.
To definitely diagnose the existence of these microbes’ medicines must perform Endoscopy and take samples from stomach, after that patient must start drug therapy and she must undergo UBT1 to completely make assur- ance about the eradication of infection [2].
*Young Researchers Club, Shiraz Branch, Islamic Azad University,
1.2. Helicobacter pylori in Children
H. pylori bacterium usually doesn’t cause any illness in period of infancy, however if it doesn’t cure it can lead to digestive disease like gastric (pain and inflammation in gastric tract) or peptic ulcer (ulcer in gastric or upper part of small intestine called duodenum), besides Helico- bacter pylori may not have any symptom in children which causes diagnosing this bacterium harder [3].
1.3. Contagion
Scientist guess H. pylori infection must be contagious, because it’s more prevalent in families that live in unhy- gienic and crowded places, besides the researchers show that infection can transfer from one person to another, however still it’s not clear how infection is transmitted to the others, and due to passive and mysterious nature of H. pylori bacterium there isn’t any vaccine or instruction to prevent the contagion of infection.
1.4. Diagnosis
There are varieties of methods to diagnose H. pylori bac- terium; but, in general we can classify them in to two groups: aggressive and non-aggressive methods.
Aggressive methods like performing Endoscopy and non-aggressive methods like taking blood test, respira- tory test and urine analysis. In fact selecting the suitable method of healing depends on clinical status of patient.
1.5. Aggressive Methods
In this method medicines need to directly look at gas- tro intestinal tract, so this operation requires to use seda- tive and enter an Endoscopy (a small and flexible pipe with a small camera at end) into throat, stomach and duo- denum.
During the procedure, medicines take sample for labo- ratory to examine the symptom of microscopic infections and existence of H. pylori.
1.6. Non-Aggressive Methods
Generally we can classify non aggressive methods in three sections [5]:
Blood Sample;
Respiratory Tests;
Urine Analysis.
1.6.1. Blood Sample
This method helps us to identify the existence of H. py-lori antibodies. Performing blood sample is easy in this test the positive result just indicates the existence of H. pylori in the past and can’t show the active infection of patient at present.
1.6.2. Respiratory Tests
In this test patient need to drink a solution which helps the medicines to identify the carbon has broken by H. pylori bacterium. Respiratory tests are useful for indi- cating the existence of H. pylori infection but they can’t provide information about the measure of infection, be- sides; performing this test in children is not easily achiev- able.
1.6.3. Urine Analysis
In urine analysis we can identify the existence of H. pylori protein in urine. Urine analysis like respiratory test is just able to show the existence of H. pylori Bacter- ium; but they can’t help us to figure the measure of in- fection.
However; children may suffer gastric pain due to the variety of reasons, like dyspepsia, virus, depression and anxiety, appendicitis and etc. and most of gastric pains are not related to H. pylori bacterium but it’s crucial to diagnose this disease correctly and fast.
2. MOTIVATIONS AND RESEARCHES
Now it is clear that Endoscopy is an only method that’s able to definitely diagnose the existence of H. pylori in- fection but performing Endoscopy in children is insuf- ferable and painful. In this paper we tried to diagnose
Helicobacter pylori infection with data mining algorithm. In fact we tried to predict the probability of disease and existence of Helicobacter pylori infection before per- forming Endoscopy that help us to perform Endoscopy in cases where percentage of finding this bacterium is high.
The process of collecting data for this paper is as be- low:
At first we gathered and consolidated the real medical data collected from patient’s blood test in Namazi Hos- pital2 of Shiraz. Then we converted data to a readable format for data mining algorithms and eventually we analyzed the converted data with data mining algorithms. In this paper we just mention to those algorithms that show better performance compared with other ones.
3. METHOD OF EVALUATIING
MODELS
In this paper for evaluating described model we used Cross Validation model.
Cross Validation
In k-fold cross validation, the initial data are randomly partitioned into n subsets X1Xn. In this model train-
ing and testing is performed n times. In iteration i, parti-
2
tion Xi is reserved as the test set, and the remaining parti-
tions are collectively used to train the model. For exam- ple in the first iteration, subsets X2Xn collectively
serve as the training set in order to obtain a first model, which is tested on D1; the second iteration is trained on
subsets X1,X3Xk and tested on X2; and so on, here,
each sample is used the same number of times for train- ing and once for testing. For classification, the accuracy estimate is the overall number of correct classifications from the n iterations, divided by the total number of tu- ples in the initial data.
Generally we use 10-Fold state of this model on a par-ticular dataset.
4. THE PROPOSED METHOD
Below we described some of the algorithms that showed better performance among the other ones.
RBF Network Algorithm, Naïve Bayes Algorithm, PART Algorithm, Decision Tree Algorithm, logistic re- gression.
4.1. RBF Network Algorithm
RBF3 network is an artificial neural network that uses radial basis functions as activation functions. RBF net- works have three layers: input layer, hidden layer, output layer. One neuron in the input layer corresponds to each predictor variable. With respects to categorical variables,
n – 1 neurons are used where n is the number of catego- ries. Hidden layer has a variable number of neurons. Each neuron consists of a radial basis function centered on a point with the same dimensions as the predictor variables. The output layer has a weighted sum of out- puts from the hidden layer to form the network outputs. This algorithm uses the k-means clustering algorithm to provide the basis functions and learns either a logistic regression (discrete class problems) or linear regression (numeric class problems) on top of that. Symmetric mul- tivariate Gaussians are fit to the data from each cluster [8].
After performing RBF Network algorithm we found out this algorithm is just able to predict only 63% of data correctly that represent RBF Network doesn’t has ac- ceptable performance in detecting the existence of H. pylori bacterium.
4.2. Naive Bayes Algorithm
Bayesian classifiers are statistical classifiers. Naïve Bayes classifier is valid to multiply probabilities when the events are independent. Naïve Bayes algorithm has well per- formance in text classifying and medical diagnosis and its performance is comparable with neural network and
decision tree.
Naïve Bayesian classifiers assume that the effect of an attribute value on a given class is independent of the values of the other attributes. In theory, Bayesian classi- fiers have the minimum error rate in comparison to all other classifiers [9].
This algorithm needs a base knowledge about number of quantities for probability, however most of the time this knowledge is unavailable and we have no alternative except estimating data. In fact we can take help form background information or past data’s or theories in field of probability distribution and etc.
P D h P h
P h DP D
(1)
We explain the above formula with an example: for diagnosing a disease we have two states:
The patient has cancer;
The patient is healthy.
Laboratory data represents that 0/008 of population is affected by this disease. In spite of the fact that labora- tory tests can be inaccurate we represent the result as below:
In 98% of situation which person definitely is sick the correct result is positive;
In 97% of situation which person definitely is healthily the correct result is negative.
cancer 0.008, cancer 0.98,
~ cancer 0.03,
P P
P
~ cancer 0.992, cancer 0.02,
~ cancer 0.97
P P
P
Now if we face a new patient and the laboratory result being positive; Dose patient susceptible to cancer?
The probability of patient susceptible to cancer:
cancer cancer cancer 0.98 0.008 0.0078
P P P P
P P
The probability of patient being healthy:
~ cancer ~ cancer ~ cancer 0.03 0.992 0.0298
P P P
P P
P
On the other side; this algorithm has weakness, in fact it can’t make any differences among instances and it behave with all of them in a same manner and consider them unrelated.
After performing Naïve Bayes algorithm we found out this algorithm is able to predict about 70% of data cor- rectly in detecting the existence of H. pylori bacterium.
4.3. Part Algorithm
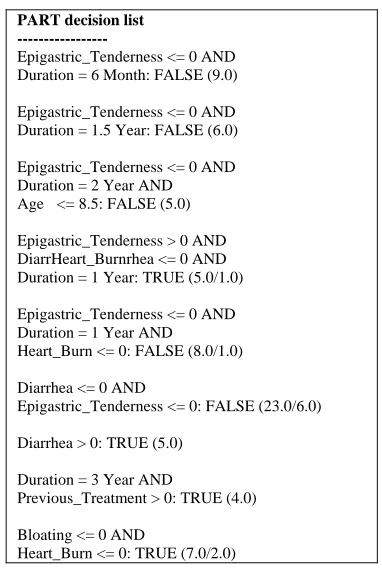
Part is a class for generating decision list. This algorithm is used to identify Knowledge, Patterns and generating different rules [10] Figure 1.
We performed part algorithm on a dataset with differ- ent attribute and we could generate some rules which expertise (medicines) can perceive the importance of these rule.
After performing PART algorithm on data we found out this algorithm is able to predict about 72.20% of data correctly in detecting the existence of H. pylori bacte- rium.
4.4. Decision Tree Algorithm
A decision tree is a flowchart-like tree structure, where each internal node (non-leaf node) denotes a test on an attribute, each branch represents anoutcome of thetest, and each leaf node4 holds a class label. The topmost node in a tree is the root node. In artificial intelligent, trees are used to show various concept like sentence structure, equation, and etc. [11].
This approach is a well-known induction train algo- rithms that successfully tested in different applications. In fact, decision trees are useful for topics that let us to answer them as category or class name. For example we can create a decision trees that able to answer below
PART decision list ---
Epigastric_Tenderness <= 0 AND Duration = 6 Month: FALSE (9.0)
Epigastric_Tenderness <= 0 AND Duration = 1.5 Year: FALSE (6.0)
Epigastric_Tenderness <= 0 AND Duration = 2 Year AND Age <= 8.5: FALSE (5.0)
Epigastric_Tenderness > 0 AND DiarrHeart_Burnrhea <= 0 AND Duration = 1 Year: TRUE (5.0/1.0)
Epigastric_Tenderness <= 0 AND Duration = 1 Year AND
Heart_Burn <= 0: FALSE (8.0/1.0)
Diarrhea <= 0 AND
Epigastric_Tenderness <= 0: FALSE (23.0/6.0)
Diarrhea > 0: TRUE (5.0)
Duration = 3 Year AND
Previous_Treatment > 0: TRUE (4.0)
Bloating <= 0 AND
[image:4.595.76.267.416.703.2]Heart_Burn <= 0: TRUE (7.0/2.0)
Figure 1. Rule extraction with the part algorithm.
question; Dose her susceptible to disease? In general Decision Tree Algorithm is useful for subject which let us to determine the output value with YES or NO an- swer.
After performing this algorithm on data we found out it’s able to predict about 78.50% of data correctly in de- tecting the existence of H. pylori bacterium.
4.5. Logistic Regression
Nowadays scientists in researches that involved with couples of element are trying to follow a specific purpose to obtain better result. In statistic we do the same with different methods of regression to obtain the desire result.
Generally in regression with couples of independent variable we must try to evaluate the answer variable. Logistic regression is useable for situation that answer variable has two or couples of states. This type of regres- sion is useful for medical and sociological researches [14]. Logistic regression is a mathematical model which use to describe the correlation between couples of X variable with two or couples of depended (Y) variable. Two state variable is a variable with just two answer like dead or alive, present or absent, having relation or not and etc. this type of variable mostly use zero and one codes to indicate a state, code one use to show positive state (success) and code zero use to show negative state (fail- ure).
This paper used Logistic regression to find a correla- tion between answer variable (Y) and a collection of predicator variables like X1,X2,X3Xn.
After examining the structure of logistic regression algorithm we found out this algorithm is able to predict about 83% of data correctly in detecting the existence of
H. pylori bacterium which shows better performance among the other algorithms.
5. PRACTICAL RESULTS
We have distributed a questionnaire for 6 months among those patients who needed to undergo Endoscopy to di- agnose the existence of H. pylori infection. The ques- tionnaire contains 22 questions based on below parame- ters:
Male and Female, abdominal pain, Nocturnal awak- ening, Nausea, Vomiting, Halitosis, HeartBurn, Bloating,
Belching, GI bleeding, Constipation, Diarrhea, Weight loss, Fatigue, Epigastric tenderness, Weight, height, Du- rationofsymptoms, Previoustreatment, PreviousEndo- scopy, Previousfamily HAcidpepticDx, RapidUrease testbeforetherapy.
After collecting data and running the algorithms we used Cross Validation method to evaluate the algorithms, and then we compared algorithms with each other and below result generated (Table 1 and Figure 2).
Table1. The percentage of correctly and incorrectly.
Algoritm Correct Incorrect
RBF Network 63.44% 36.56%
Naïve Bayes 69.9% 30.1%
PART 74.2% 25.81%
Decision Tree 78.5% 21.51%
Logistic Regression 82.64% 17.36%
Figure 2. Algorithm implemented Chart.
Finally Logistic regression represents better perform- ance in detecting H. pylori bacteria among the other al- gorithms.
6. CONCLUSIONS
Recently Helicobacter pylori disease has become very prevalent among children under 10 years old and the only definite method to correctly diagnose the existence of H. pylori infection is performing endoscope, however it’s painful and insufferable for children.
In this paper we tried to eliminate the unnecessary use of Endoscopy and use non-aggressive method as an al- ternative solution for children, and eventually we suc- ceeded in predicting the existence of this bacterium with data mining algorithms about 83% correctly.
With these algorithms, we are able to diagnose the ex- istence of Helicobacter pylori bacterium. In fact, using Data mining algorithms in identifying H. pylori bacte- rium helps us to make better decision in confronting this bacterium.
7. ACKNOWLEDGEMENTS
Dr. M. Bagherpour and Dr. A. Erjae and Dr. S. M. Dehghani that pro- vide data this paper along with Dr. M. H. Emanie, Chief of Medical Science University in shiraz, have our full appreciation and thanks.
REFERENCES
[1] Gold, B., Colletti, R., Abbott, M., et al. (2000) Helico- bacter pylori infection in children: Recommendations for diagnosis and treatment. Journal of Pediatric Gastroen-
terology and Nutrition, 31, 490-497.
doi:10.1097/00005176-200011000-00007
[2] Guarner, J., Kalach, N., Elitsur, Y. and Koletzko, S. (2010) Helicobacter pylori diagnostic tests in children: Review of the literature from 1999 to 2009. European Journal of Pediatrics, 169, 15-25.
doi:10.1007/s00431-009-1033-x
[3] Begue, R.E., Mirza, A., Compton, T., Gomez, R. and Vargas, A. (1999) Helicobacter pylori infection and insu- lin requirement among children with type 1 diabetes mel- litus. Pediatrics, 103, e83.doi:10.1542/peds.103.6.e83
[4] Richter, T., Richter, T., List, S., Müller, D.M., Deutscher, J., Uhlig, H.H., et al. (2001) Five to 7-year-old children with Helicobacter pylori infection are smaller than heli- conbacter-negative children: A cross-sectional popula- tion-based study of 3315 children. Journal of Pediatric Gastroenterology and Nutrition, 33, 472-475.
doi:10.1097/00005176-200110000-00010
[5] Bourke, B., Ceponis, P., Chiba, N., et al. (2005) Canadian helicobacter study group consensus conference: Update on the approach to Helicobacter pylori infection in chil- dren and adolescents—An evidence-based evaluation. Canadian Journal of Gastroenterology, 19, 399-408. [6] Marshall, B. and Warren, J.R. (1984) Unidentified curved
bacilli in the stomach of patients with gastritis and peptic ulceration. Lancet, 1, 1311-1314.
doi:10.1016/S0140-6736(84)91816-6
[7] Czinn, S. (2005) Helicobacter pylori infection: Detection, investigation and management. Journal of Pediatrics, 146, S21-S26.doi:10.1016/j.jpeds.2004.11.037
[8] Troyanskaya, O.G., Dolinski, K., Owen, A.B., Altman, R.B. and Botstein, A. (2003) Bayesian framework for combining heterogeneous data sources for gene function prediction (in Saccharomyces cerevisiae). Proceedings of the National Academy of Sciences of the United States of America, 100, 8348-8353. doi:10.1073/pnas.0832373100
[9] Friedman, N., Geiger, D. and Goldszmidt, M. (1997) Bayesian network classifiers. Machine Learning, 29, 131- 163.
[10] Cao, Y.Q. and Wu, J.H. (2004) Dynamics of projective adaptive resonance theory model: The foundation of PART algorithm. IEEE Transactions on Neural Networks, 15, 245-260.
[11] Fayyad, U.M. (1991) On the induction of decision trees for multiple concept learning. Doctoral Dissertation, Uni- versity of Michigan, Ann Arbor.
[12] Ng, A.Y. and Jordan, M.I. (2002) On discriminative vs. generative classifiers: A comparison of logistic regression and naive bayes. Neural Information Processing Systems, 14, 841.
[13] Breiman, L., Freidman, J., Olshen, R. and Stone, C. (1984) Classification and regression trees. Wadsworth Interna-tional, California.
[15] Wang, Y. (2005) A multinomial logistic regression mod- eling approach for anomaly intrusion detection. Com- puter& Security, 24, 662-674.
[16] Giudici, P. (2003) Applied data mining statistical meth- ods for business and industry. Wiley & Sons, Hoboken. [17] Zhang, J., Jin, R., Yang, Y. and Hauptmann, A.G. (2003)
Modified logistic regression: An approximation to SVM and its applications in large-scale text categorization. Proceedings of the 20th International Conference on Ma- chine Learning, Menlo Park, 888-895.
[18] Sulkava, M. and Hollmén, J. (2003) Finding profiles of forest nutrition by clustering of the self-organizing map. Proceedings of the Workshop on Self-Organizing Maps, Kitakyushu, 243-248.
[19] Han, J. and Kamber, M. (2006) Data mining: Concepts and techniques. 2nd Edition, Diane Cerra Publisher, San Francisco.