Munich Personal RePEc Archive
Why is growth less inclusive in
Indonesia?
Dartanto, Teguh
Institute for Economic and Social Research (LPEM), Faculty of
Economics and Business, University of Indonesia
2013
Online at
https://mpra.ub.uni-muenchen.de/65136/
Draft of ADB Economics Working Paper Series
Why Is Growth Less Inclusive in Indonesia?
Teguh Dartanto
No. ___ 2014
Teguh Dartanto is a Head of Poverty and Social Protection Research Group at the Institute for Economic and Social Research (LPEM), and a Director of Undergraduate Program in Economics, Faculty of Economics and Business, University of Indonesia.
Author would like to thank for Theresia Kinanti Dewi, Usman, Widi Larasari, Almira Salsabila and Sulistiadi Dono Iskandar for extensive research assistance and valuable comments on the completing of report.
CONTENTS
ABSTRACT v
I. INTRODUCTION 1
II. POVERTY, INEQUALITY AND HUMAN DEVELOPMENT 2
A. Poverty, Growth, and Inequality 2
B. Human Development Index 6
C. Poverty, Growth, Inequality and Human Development 8
Index in Provincial Level in Indonesia
III. ECONOMIC GROWTH AND ITS PATTERN 9
A. Growth Patterns 9
B. Employment Rate Policies 11
C. Elasticity of Poverty, Inequality and Employment to 12
Economic Growth
D. Growth, Poverty and Inequality at Provincial Level in Indonesia 14
IV. MACROECONOMIC POLICIES AND POVERTY REDUCTION 16
A. Fiscal Policy 16
B. Monetary Policy 18
V. ADJUSTMENT POLICIES AND POVERTY REDUCTION 21
A. Financial Liberalization 22
B. Trade Liberalization 23
VI. SOCIAL POLICIES AND POVERTY REDUCTION: A NEW 25
DIRECTION FOR POVERTY REDUCTION STRATEGIES
VII. CONCLUDING REMARKS 27
ABSTRACT
The speed of poverty reduction in Indonesia has begun to slow down with inequality continuing to rise significantly. Examining the macroeconomic dataset for last three decades, this study found that inclusive growth is observed only during 1980s in which one percent of economic growth could reduce the poverty rate by 0.72 percentage point and the Gini index by 0.0021 point. Nevertheless, during the 1990s and 2000s, the growth is less inclusive as indicated by shrinking the elasticity of poverty to growth and the positive elasticity of inequality to growth. The elasticity of employment to growth has also continuously declined from 1.12 (1985) to 0.21 (2012). There are two possible reasons for less inclusive growth in Indonesia: first, the Indonesian economy is moving into more services-oriented economy and capital-intensive sectors such as mining, financial and telecommunications that create less job opportunities particularly for unskilled labor. It deprives the poor to benefit from a rising economy. Second, the productivity of industrial sector and service sector is more than seven-fold and three-fold of the agriculture’s productivity, respectively. Consequently, the employees working at service and industry sectors are benefit much more than those working in agriculture sector. However, Indonesia has already two essential elements of the necessary condition for inclusive growth that are the stable macroeconomic condition and sound economic fundamentals. The government should now focus on the sufficient condition for inclusive growth that strengthens micro level policies such as financial inclusion, improving access to education, health insurance and other social policies.
Keywords: Inclusive Growth, Poverty, Inequality
JEL Classification: I32, I38, O40, O43
Page | 1
I. IN T R O D U C T IO N
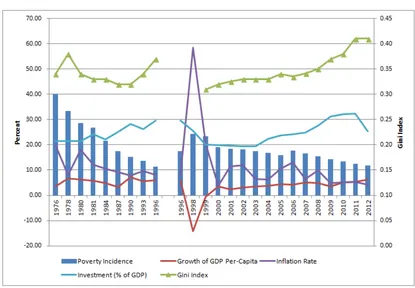
[image:5.595.97.512.342.630.2]Indonesia recorded a good experience in combating poverty during 1976-2012. Sustained economic growth and macroeconomic stability in Indonesia have been the primary driving factors in poverty reduction. In the past three decades, socio-economic conditions in Indonesia have been improving rapidly. During this period, per-capita GDP of Indonesia increased three-fold. The World Bank reported that the per-capita GDP (PPP, 2005 US$) of Indonesia had jumped from $1,323 (1983) to $4,271 (2012).1 From 1980 to 2012, the transformation of Indonesian economy as the relative shares of three sectors in GDP has been clearly observed. The share of agriculture output in GDP has declined continuously since 1980, while the share of industrial sector as well as service sector has increased significantly. The average share of industrial output in GDP has increased almost 9% during the 30-year period. This substantial increase in income and the transformation of Indonesian economy have been accompanied by improvements in social indicators such as the massive decrease in the absolute poverty incidence from 28.6% (1980) to 11.7% (2012) in headcount ratios (measured by national poverty line)
Figure 1: Poverty, Growth, Inequality and Other Macroeconomic Indicators
Source: World Development Indicators and Central Statistical Agency (BPS)
However, the rate of poverty reduction has started to slow down with inequality continuing to rise significantly. The Gini coefficient measured by the expenditure (consumption) substantially increased roughly from 0.33 in 2002 to 0.41 in 2012. De Silva and Sumarto (2013) confirmed that during 2006-2012, the growth rate of household income per capita was 26.5 percent. The growth rate varied from 9 percent for the poorest quintile to 29 percent for the richest. Changes in the sectoral composition of growth away
1
Page | 2
from agriculture and toward industry and services, driven in part by increased global integration and rural-urban migration are thought to be the root causes of rising inequality (De Silva and Sumarto, 2013). Thus, the economic growth in Indonesia was particularly beneficial for those located at the top of the distribution.
Palanivel (2013) observed that possible sources of rising inequality in Asia are uneven growth across sectors and locations; uneven demand of skilled and unskilled labor; capital intensive sectors driven growth; high food and fuel prices; and uneven asset and infrastructure distribution. Increasing inequality will polarize society and lead to social tensions and undermine the growth process itself. Banerjee and Duflo (2005) and World Bank (2005) have indentified that growing inequality reduces the growth elasticity of poverty reduction and generates a detrimental influence on the growth prospects of an economy.
Rising inequalities can be a catalyst of collective behavior such as an expansion of social protests that was seen lately in Indonesia which slows down economic growth. Even when social protests or social tensions do not urge social conflict, rising inequality can increase resistance and undermine a government’s ability to introduce very important reforms needed for economic growth (Coudouel, Dani and Paternostro, 2006). Therefore, now Indonesia should accelerate the rate of poverty reduction and curb rising inequalities by making growth and policies more inclusive that allows the poor to benefit equitable from economic growth. Economic growth that does not only create new economic opportunities, but also one that ensures equal access to the opportunities created for all segments of society, particularly for the poor (Ali and Son, 2007). Inclusive growth implies participation of poor and vulnerable population in the growth process in an equitable manner and the benefits of growth are shared equitably between poor and non-poor.
This paper aims to examine the correlation between poverty, growth and inequality; evaluate the extent to which the recent economic growth in Indonesia has been inclusive; analyze macroeconomic factors that determine inclusiveness of growth process; and attempt to underscore policy measures that can make growth more inclusive in Indonesia. This study utilized on elaborating statistical data/facts to meet the objectives of this study. Thus, this paper can provide understandable evidence and policy recommendations to policy makers how to make growth/development more inclusive in Indonesia.
The structure of the paper is as follows. The next section provides a brief overview of the trends poverty, inequality and human capital that include some stylized facts of education and health. The third section discusses the economic growth and its growth patterns and the transformation of Indonesian economy. The fourth section deals with macroeconomic policies including both fiscal and monetary policies and poverty reduction in Indonesia. The fifth section overviews some adjustment policies including financial and trade liberalization. The sixth section discusses new challenges and directions of poverty alleviation in Indonesia. The last section deals with key findings and conclusion.
II. P O V E R T Y , IN E Q U A L IT Y A N D H U M A N D E V E L O P M E N T
A. Poverty, Growth and Inequality
Page | 3
transformation of Indonesian economy. These have contributed large improvements in social welfare as well as a massive decrease in the poverty incidence.
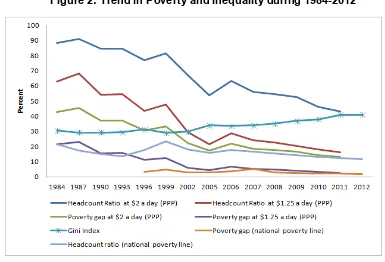
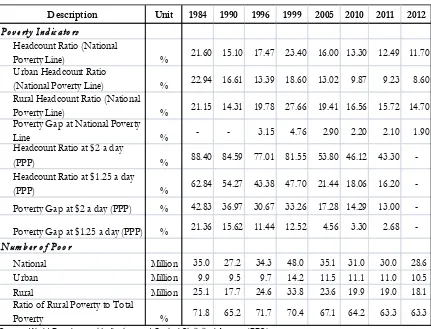
[image:7.595.112.497.328.590.2]The headcount index as measured with the national poverty line declined from 21.6% (1984) to 11.7% (2012).2 Other poverty measures show that the headcount ratio of US$ 2 per day had decreased more than half from 88.4% (1984) to 43.3% (2011), while the headcount ratio of US$ 1.25 per day (PPP) had decreased from 62.84% (1984) to 16.2% (2011) (Table 1). In 1998, the government revised the method of calculating the poverty line by improving the quality of non-food items. As a result the poverty line increased and the population below the poverty line also increased. The poverty incidence in 1996 was 11.30% under the old method of calculating poverty line and 17.47% under the new method of calculating poverty line. The poverty gap index (PGI henceforth) has also declined significantly from 3.15% (1996) to 1.9% (2012) (the national poverty line). The decrease of the poverty gap index is very large when US$ 1.25 per day (PPP) and US$ 2 per day (PPP) are applied; for instance, the PGI decreased from 21.36% (1984) to 2.68% (2011) (US$ 1.25 per day). The lower value of PGI indicates that poverty reduction programs should lift poor people easily out of poverty since they are clustered around the poverty line.
Figure 2: Trend in Poverty and Inequality during 1984-2012
Source: Author’s Compilation
Poverty figures, however, fluctuated overtime and increased sharply from 17.47% in 1996 to 23.43% in 1999 when the economic crisis hit. The economic growth decreased drastically exacerbated by domestic political turbulence and multidimensional socio-economic crisis. This indicates that households who are clustered around the poverty line are at risk to fall into poverty in the event of the economic fluctuation and small
2 The poverty line in Indonesia is measured by basic need approach (expenditure) rather than income
Page | 4
shocks. Dartanto and Otsubo (2013) observed that the Asian economic crisis in 1997-1998 caused almost 18.5% of non-poor household to fall into poverty. The economic crisis followed by massive contraction in both the industrial sector and service sector hit urban households. The poverty rate in urban area, where most activities are located, jumped significantly around 4.5% compared to the pre-crisis level.
[image:8.595.86.517.300.629.2]The economic recovery and macroeconomic stability from 2000 to 2005 have led to a significant decreased in poverty incidence during this period. By 2003, the poverty incidence remained almost the same during the pre-economic crisis level. In 2006, poverty incidence had increased as a consequent of the adjustment on fuel subsidies in 2005. The poverty rate increased from 15.97% in 2005 to 17.75% in 2006. However, poverty was not much affected by the adjustment of fuel prices in 2008, because households and firms have had already experienced a very high increase in 2005 and the role of the compensation policies, and the stabilization price policies of commodities price as a safety net for the poor was relatively well function.
Table 1: Trend in Poverty in Indonesia
Description Unit 1984 1990 1996 1999 2005 2010 2011 2012
Po v e rty In d ic ato rs
Headcount Ratio (National
Poverty Line) % 21.60 15.10 17.47 23.40 16.00 13.30 12.49 11.70 Urban Headcount Ratio
(National Poverty Line) % 22.94 16.61 13.39 18.60 13.02 9.87 9.23 8.60 Rural Headcount Ratio (National
Poverty Line) % 21.15 14.31 19.78 27.66 19.41 16.56 15.72 14.70 Poverty Gap at National Poverty
Line % - - 3.15 4.76 2.90 2.20 2.10 1.90
Headcount Ratio at $2 a day
(PPP) % 88.40 84.59 77.01 81.55 53.80 46.12 43.30
-Headcount Ratio at $1.25 a day
(PPP) % 62.84 54.27 43.38 47.70 21.44 18.06 16.20
-Poverty Gap at $2 a day (PPP) % 42.83 36.97 30.67 33.26 17.28 14.29 13.00
-Poverty Gap at $1.25 a day (PPP) % 21.36 15.62 11.44 12.52 4.56 3.30 2.68 -Nu m b e r o f Po o r
National Million 35.0 27.2 34.3 48.0 35.1 31.0 30.0 28.6
Urban Million 9.9 9.5 9.7 14.2 11.5 11.1 11.0 10.5
Rural Million 25.1 17.7 24.6 33.8 23.6 19.9 19.0 18.1
Ratio of Rural Poverty to Total
Poverty % 71.8 65.2 71.7 70.4 67.1 64.2 63.3 63.3
Source: World Development Indicators and Central Statistical Agency (BPS)
Page | 5
The increase of urban poor and the decrease of rural poor might be due to change in the village category from rural village to urban village and the massive urbanization wherein the proportion of urban population jumped from 36.84% in 1996 to 51.45% in 2012. Smallholder and landless rural poor households migrate to urban area to seek better job opportunities. Moreover, the Central Statistic Agency (BPS) classified between the urban village and the rural village based on the composite score of population density, proportion labor working at agriculture sectors, the availability of urban facilities such as school, fresh market, hospital, electricity and asphalt road. The rapid socio-economic development and the transformation of Indonesian economy during the last three decades have significantly transformed the rural village into the urban village.
[image:9.595.80.557.417.548.2]The trend of poverty incidence in Indonesia appears to decline significantly, but the reduction rate has begun to slow down recently. The main reason might be the changing nature of poverty. When the poverty incidence was larger enough, a large number of households used to live just below the poverty line and hence only a slight increase in income was needed to push those households out of poverty. However, as the poverty incidence approaches a single digit figure and is around 10 percent, further reductions in poverty becomes more difficult. Now the nature of poverty has changed, with many households living far below the poverty line and others being clustered just above the poverty with the risk of falling back to poverty. Dartanto and Nurkholis (2013) observed the household welfare mobility in and out of poverty during 2005-2007 and found around 11% of rural non-poor households in 2005 subsequently fell into poverty in 2007, compared with only 1% of urban non-poor households. They also confirmed that an increase of 25% in the poverty line causes an increase of more than 100% in the poverty rate.
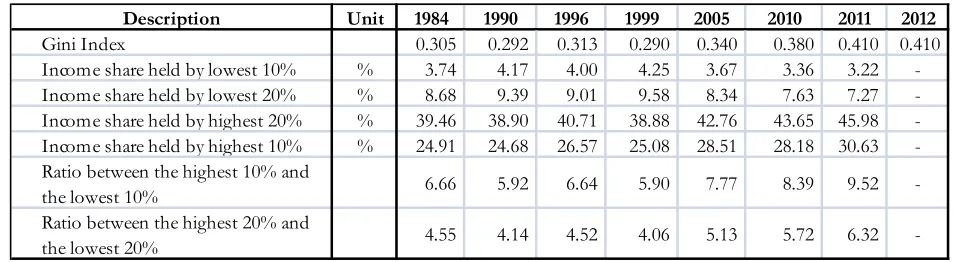
Table 3: Trend in Inequality in Indonesia
Description Unit 1984 1990 1996 1999 2005 2010 2011 2012
Gini Index 0.305 0.292 0.313 0.290 0.340 0.380 0.410 0.410 Income share held by lowest 10% % 3.74 4.17 4.00 4.25 3.67 3.36 3.22 -Income share held by lowest 20% % 8.68 9.39 9.01 9.58 8.34 7.63 7.27 -Income share held by highest 20% % 39.46 38.90 40.71 38.88 42.76 43.65 45.98 -Income share held by highest 10% % 24.91 24.68 26.57 25.08 28.51 28.18 30.63 -Ratio between the highest 10% and
the lowest 10% 6.66 5.92 6.64 5.90 7.77 8.39 9.52 -Ratio between the highest 20% and
the lowest 20% 4.55 4.14 4.52 4.06 5.13 5.72 6.32
-Source: World Development Indicators and Central Statistical Agency (BPS)
As experienced other countries in Southeast Asia, the remarkable success in poverty reduction has been associated with increasing in income inequality. Indonesia follows the same pattern that substantial decrease in poverty came along with increasing in Gini index particularly during the last decade. Inequality in Indonesia has been increasing during the recent six year period from 2006 to 2012 (Figure 2 and Table 2). During the period prior to the Asian economic crisis (1990-1996) the Gini index increased from 0.292 to 0.313, and then inequality slightly dropped from 0.313 (1996) to 0.289 (1999) due to the Asian economic crisis that had hit high income households resulted to closer the income gap (Dartanto and Otsubo, 2013). Economic recovery after the crisis has initiated a growing inequality in Indonesia since the welfare of rich grows higher than that of the poor. From 2005 to 2006, one outcome of fuel price adjustment and some other social policies in 2005 is the decline of Gini index from 0.340 to 0.335. Later, beginning in 2006, an increasing inequality trend has been exhibited by the movements in the Gini index.
Page | 6
is continuously increasing that means wider income gap between the richest and the poorest. In 1999, the richest has six times more income than the poorest, while in 2011 the richest has ten times more income than the poorest. During the period prior to the Asian economic crisis (1984-1996), the income ratio between the richest and the poorest remained stable from 5.9 to 6.64. Nevertheless during the post crisis period (1999-2011) within ten years, the income ratio of the richest and the poorest is almost double. The wider income gap can be a catalyst of social jealousy that can be a wick of social and political chaos.
B. Human Development Index
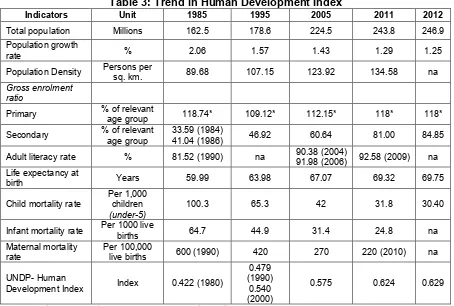
In the past three decades, except for the periods of crises, socio-economic conditions in Indonesia have been improving rapidly. This substantial increase in income has been accompanied by improvements in social indicators such as a massive decrease in the poverty incidence, a significant increase in the gross enrollment rate for secondary education from 41.04% (1986) to 84.85% (2012) and a significant decrease in the infant mortality rate from 64.7 (1985) to 24.8 (2011). Substantial improvements on economic welfare and education and health indicators have significantly contributed to the increase in Human Development Index (HDI henceforth) from 0.422 to 0.629.
In contrast to the slowing down poverty reduction rate, the development of HDI is progressively getting faster. From 1980 to 1990 the improvement of HDI was only 0.057 point, while in the next decade, there was 0.061 point improvement. In the period of 2000-2010, HDI has substantially increased by 0.8 point. Unfortunately, after 2010, HDI progression rate has begun to slow down since there was only 0.002 point increase per year compared to 0.008 point increase per year in the period of 2000-2010. Recent government policies such as fostering economic growth policies and widening access on education and health services through scholarship and health insurance distribution particularly for the poor are expected to improve HDI.
Figure 4 and Table 3 show that school enrollment for secondary and tertiary has significantly improved during the last three decades. The gross enrollment for secondary education has jumped almost 2.5 times from 34.6 (1980) to 84.85 (2012), while the school enrollment for tertiary level has reached five-fold from 5.41 (1980) to 26.88 (2012). An increase in years of schooling directly increases the stock of human capital as well as the stock of skilled labor that is a necessary condition for achieving a long run sustainable economic growth. On the other hand, individuals having a higher educational attainment will have broader opportunities to get jobs with high salary that can enable them to get out of poverty. Thus, the role of education in alleviating poverty is through two channels: 1) boosting economic growth and 2) providing opportunities for a vertical mobilization.
Page | 7
Figure 3: Trend of Human Development Index during 1980-2012
Source: Author’s Compilation from World Development Indicators
Table 3: Trend in Human Development Index
Indicators Unit 1985 1995 2005 2011 2012
Total population Millions 162.5 178.6 224.5 243.8 246.9
Population growth
rate % 2.06 1.57 1.43 1.29 1.25
Population Density Persons per
sq. km. 89.68 107.15 123.92 134.58 na
Gross enrolment ratio
Primary % of relevant age group 118.74* 109.12* 112.15* 118* 118* Secondary % of relevant
age group
33.59 (1984)
41.04 (1986) 46.92 60.64 81.00 84.85
Adult literacy rate % 81.52 (1990) na 90.38 (2004)
91.98 (2006) 92.58 (2009) na Life expectancy at
birth Years 59.99 63.98 67.07 69.32 69.75
Child mortality rate
Per 1,000 children (under-5)
100.3 65.3 42 31.8 30.40
Infant mortality rate Per 1000 live
births 64.7 44.9 31.4 24.8 na
Maternal mortality rate
Per 100,000
live births 600 (1990) 420 270 220 (2010) na
UNDP- Human
Development Index Index 0.422 (1980)
0.479 (1990)
0.540 (2000)
0.575 0.624 0.629
[image:11.595.79.533.420.726.2]Page | 8
Note: The gross enrolment ratio (GER) is the total enrollment of population regardless of age, GER can exceed 100 percent. In table 3, the gross enrollment of primary education that showing a number exceeding 100 percent is due to the inclusion of over-aged and under-aged students. This is because early or late school entrance and grade repetition.
C. Poverty, Growth, Inequality and Human Development Index in Provincial Level in Indonesia
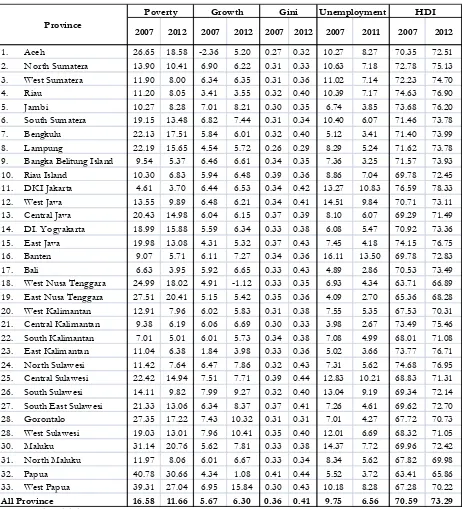
In a diverse society like Indonesia where a great deal of regional disparities exists, the poverty profile at national level should be complemented with the poverty profile at the regional level. Table 4 shows the variation of poverty headcount ratio for each province in Indonesia. Even though, the national poverty rate is 11.96% in 2012, some of provinces located at eastern part of Indonesia such as Maluku, Papua and West Papua have the poverty incidence twice (triple) than the national average. Provinces like DKI Jakarta, Bali, North Sulawesi and Bangka Belitung have less than half of the national poverty rate. According to this diversity, the poverty alleviation program should be tailor-made for each province.
About 57 per cent of poor in Indonesia live in Java, the most populous Island. One-fourth of population in Java, with most being concentrated in East Java, West Java, and Central Java, can be categorized as the poor. The poverty in Java is relatively intense in landless household; particularly those whose income depends solely on agriculture sector (LPEM FEUI, PSE KP UGM, PSP-IPB, 2004). East Java, for example, has around 3 million working poor. More than 60 per cent of the poorest households as opposed to less than 10 per cent of the richest households make their living from agriculture. By contrast, more than 75 per cent of the richest households work in the services sectors, along with only 25 per cent of the poorest households (ILO, 2011). Some of the landless were able to escape from poverty if they are able to find other jobs from non-farm activities. The poverty in Sumatera is mostly concentrated in Lampung, Aceh, Bengkulu and South Sumatera. The highest poverty rate in Kalimantan and Sulawesi is in Central and West Kalimantan, and in Southeast Sulawesi.
The provinces that experienced social riots such as Maluku, Central Sulawesi and Southeast Sulawesi have a high poverty rate. The social riot had caused damage to both physical infrastructures and economic activities. Study in Maluku by Rahayu and Febriany (2007) concluded that things like conflicts, natural disasters, monetary crisis, and the reduction of subsidies can make the household reduce or lose their income. The community members in high conflict area are also very vulnerable to various disturbances that can make them fall into poverty or trapped in poverty. Moreover, the high poverty rate in Papua and West Papua are mostly influenced by isolation and infrastructure problems. Reducing infrastructure barriers will reduce the poverty incidence in Papua. Rahayu and Febriany (2007) showed that improvement of infrastructure, openness of stratification, good social capital, as well as functioning local democracy have helped improve the prosperity of communities.
Page | 9
Table 4: Trend in Poverty, Growth, Inequality, Unemployment and Human Development Index at Provincial Level 2007-2012
2007 2012 2007 2012 2007 2012 2007 2011 2007 2012
1. Aceh 26.65 18.58 -2.36 5.20 0.27 0.32 10.27 8.27 70.35 72.51 2. North Sumatera 13.90 10.41 6.90 6.22 0.31 0.33 10.63 7.18 72.78 75.13 3. West Sumatera 11.90 8.00 6.34 6.35 0.31 0.36 11.02 7.14 72.23 74.70 4. Riau 11.20 8.05 3.41 3.55 0.32 0.40 10.39 7.17 74.63 76.90 5. Jambi 10.27 8.28 7.01 8.21 0.30 0.35 6.74 3.85 73.68 76.20 6. South Sumatera 19.15 13.48 6.82 7.44 0.31 0.34 10.40 6.07 71.46 73.78 7. Bengkulu 22.13 17.51 5.84 6.01 0.32 0.40 5.12 3.41 71.40 73.99 8. Lampung 22.19 15.65 4.54 5.72 0.26 0.29 8.29 5.24 71.62 73.78 9. Bangka Belitung Island 9.54 5.37 6.46 6.61 0.34 0.35 7.36 3.25 71.57 73.93 10. Riau Island 10.30 6.83 5.94 6.48 0.39 0.36 8.86 7.04 69.78 72.45 11. DKI Jakarta 4.61 3.70 6.44 6.53 0.34 0.42 13.27 10.83 76.59 78.33 12. West Java 13.55 9.89 6.48 6.21 0.34 0.41 14.51 9.84 70.71 73.11 13. Central Java 20.43 14.98 6.04 6.15 0.37 0.39 8.10 6.07 69.29 71.49 14. DI. Yogyakarta 18.99 15.88 5.59 6.34 0.33 0.38 6.08 5.47 70.92 73.36 15. East Java 19.98 13.08 4.31 5.32 0.37 0.43 7.45 4.18 74.15 76.75 16. Banten 9.07 5.71 6.11 7.27 0.34 0.36 16.11 13.50 69.78 72.83 17. Bali 6.63 3.95 5.92 6.65 0.33 0.43 4.89 2.86 70.53 73.49 18. West Nusa Tenggara 24.99 18.02 4.91 -1.12 0.33 0.35 6.93 4.34 63.71 66.89 19. East Nusa Tenggara 27.51 20.41 5.15 5.42 0.35 0.36 4.09 2.70 65.36 68.28 20. West Kalimantan 12.91 7.96 6.02 5.83 0.31 0.38 7.55 5.35 67.53 70.31 21. Central Kalimantan 9.38 6.19 6.06 6.69 0.30 0.33 3.98 2.67 73.49 75.46 22. South Kalimantan 7.01 5.01 6.01 5.73 0.34 0.38 7.08 4.99 68.01 71.08 23. East Kalimantan 11.04 6.38 1.84 3.98 0.33 0.36 5.02 3.66 73.77 76.71 24. North Sulawesi 11.42 7.64 6.47 7.86 0.32 0.43 7.31 5.62 74.68 76.95 25. Central Sulawesi 22.42 14.94 7.51 7.71 0.39 0.44 12.83 10.21 68.83 71.31 26. South Sulawesi 14.11 9.82 7.99 9.27 0.32 0.40 13.04 9.19 69.34 72.14 27. South East Sulawesi 21.33 13.06 6.34 8.37 0.37 0.41 7.26 4.61 69.62 72.70 28. Gorontalo 27.35 17.22 7.43 10.32 0.31 0.31 7.01 4.27 67.72 70.73 28. West Sulawesi 19.03 13.01 7.96 10.41 0.35 0.40 12.01 6.69 68.32 71.05 30. Maluku 31.14 20.76 5.62 7.81 0.33 0.38 14.37 7.72 69.96 72.42 31. North Maluku 11.97 8.06 6.01 6.67 0.33 0.34 8.34 5.62 67.82 69.98 32. Papua 40.78 30.66 4.34 1.08 0.41 0.44 5.52 3.72 63.41 65.86 33. West Papua 39.31 27.04 6.95 15.84 0.30 0.43 10.18 8.28 67.28 70.22
All Province 16.58 11.66 5.67 6.30 0.36 0.41 9.75 6.56 70.59 73.29 Province
Poverty Growth Gini Unemployment HDI
Source: Central Statistic Agency (BPS)
III. E C O N O M IC G R O W T H A N D IT S P A T T E R N
A. Growth Patterns
Page | 10
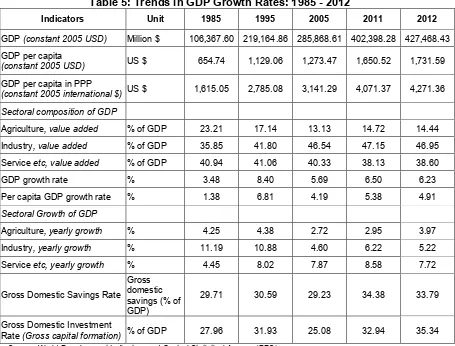
[image:14.595.85.540.254.600.2]experienced the highest economic growth in the pre-crisis period with an annual economic growth of 5.54%. In 1998, during the crisis, the economy contracted by 13.7% and inflation rate rose to 78%, driven by the increasing food prices. Since the economy recovered relatively quickly from the crisis, by 2000, economic growth was already 3.5% and it was continuously growing. Average economic growth during post-crisis period was around 5.5-6.5% per year. As the economy quickly recovered from the crisis, poverty began to decline again. The stable economic growth and improving macroeconomic conditions were the main source of sustainable reduction in poverty in the post crisis era. Nonetheless, poverty reduction rates never returned to those seen in the pre-crisis period. It may due to an argument that the main drivers of growth in the post crisis period are capital-intensive sectors such as mining and telecommunications, which employ fewer people and thus, depriving the poor to benefit from a rising economy (Suryahadi et al., 2012).
Table 5: Trends in GDP Growth Rates: 1985 - 2012
Indicators Unit 1985 1995 2005 2011 2012
GDP (constant 2005 USD) Million $ 106,367.60 219,164.86 285,868.61 402,398.28 427,468.43 GDP per capita
(constant 2005 USD) US $ 654.74 1,129.06 1,273.47 1,650.52 1,731.59 GDP per capita in PPP
(constant 2005 international $) US $ 1,615.05 2,785.08 3,141.29 4,071.37 4,271.36 Sectoral composition of GDP
Agriculture, value added % of GDP 23.21 17.14 13.13 14.72 14.44
Industry, value added % of GDP 35.85 41.80 46.54 47.15 46.95
Service etc, value added % of GDP 40.94 41.06 40.33 38.13 38.60
GDP growth rate % 3.48 8.40 5.69 6.50 6.23
Per capita GDP growth rate % 1.38 6.81 4.19 5.38 4.91
Sectoral Growth of GDP
Agriculture, yearly growth % 4.25 4.38 2.72 2.95 3.97
Industry, yearly growth % 11.19 10.88 4.60 6.22 5.22
Service etc, yearly growth % 4.45 8.02 7.87 8.58 7.72
Gross Domestic Savings Rate Gross domestic savings (% of GDP)
29.71 30.59 29.23 34.38 33.79
Gross Domestic Investment
Rate (Gross capital formation) % of GDP 27.96 31.93 25.08 32.94 35.34
Source: World Development Indicators and Central Statistical Agency (BPS)
Page | 11
Looking at the sectoral growth rate, the service sector has the highest growth rate recently. However, with the double digit growth rate during 1980s and 1990s (before the crisis), the industrial sectors was the belle of the Indonesian economy. The agriculture sector has the lowest economic growth compared to the other two sectors. According to this fact, it is evident that the Indonesian economy is moving into more services-oriented economy. By looking at the GDP by expenditures, we can observe that there are significant changes in the share of consumption of both private and government as well as in the share of investment – reflected by gross fixed capital formation – in three decades. The share of investment rises from 27.96% (1985) to 35.34% (2012) (Table 5). A large share of investment in GDP will help to promote a sustainable economic growth.
B. Employment Rate Policies
The transformation of Indonesian economy will change the share of sectoral employment. The sectoral employment trends are less mimic to the trends in output share described before. Akin to the share of agricultural output in the GDP, share of employment in agricultural sector also fell steadily from 53.83% (in the period of 1985-1994) to 40.20% in the current period of 2005-2011 (Table 6). Yet, the rate of decline in the share of agricultural employment is faster than in the agriculture output. Moreover, the share of employment in the industrial sector grows from 12.82% in the past period, to 18.02% during crisis, and continued to increase to almost 19.09% in the current period. On the other hand, the average share of service sector in total employment increased continuously since 1980, from 32.68% (1985-1994) to 40.64% (2005-2011). In three decades (1985-2011), the share of employment in agriculture sector fell by 13.6%; whereas in the industry sector and the service sector, they have increased almost by 6.2% and 8.0% respectively.
Table 6: Employment-Growth Linkages
Description 1985-94 1995-04 2005-11
Sectoral Employment Share(% of total employment, average during the period)
Agriculture 53.83 44.05 40.20
Industry 12.82 18.02 19.09
Service 32.68 37.93 40.64
Sectoral Value Added Growth(the average during the period)
Agriculture 3.33 2.45 3.37
Industry 8.59 3.38 4.49
Service 7.62 3.11 7.95
Sectoral Labor Productivity (the ratio between sectoral GDP and total employment (in IDR million))
Agriculture 4.15 5.53 7.02
Industry 35.90 40.19 52.33
Service 14.24 16.78 22.51
Unemployment Rate (Unemployment, total (% of total labor
force, average during the period) 2.66* 7.07** 8.66
Source: World Development Indicators and Central Statistical Agency (BPS)
Page | 12
employment share in agriculture is the reason why the productivity in the agriculture sector is quietly low compared to other sectors. The productivity of industrial sector and service sector is more than seven-fold and three-fold of agriculture’s productivity respectively. If each factor production is paid based on their productivity, then the average salary of agriculture sector will always be lower than that of industrial (service) sector. These facts support the hypothesis that the rich is getting richer faster than the poor. Most of rich income group is mostly working at either in industrial or service sectors, while the poverty is still rural and agricultural phenomenon.
Recent data also shows that the farmer exchange value as measured by the ratio between the value received by farmer and the value paid by farmer is continuously decreasing that means the welfare of farmer getting worst recently. The farmer exchange value was IDR 30,393 per day (the real value) in 2008 but it is constantly decreasing IDR 27,002 per day. During 5 years, the welfare of farmer decreases by approximately 10% or equals to 2% per year. At the same time, there is a provincial minimum wage policy for industry and service sectors that is adjusted every year following the inflation and some additional factors. This minimum wage policy can keep real wage rate either constant or even larger than the previous year. This will be one of the sources of growing inequality in Indonesia and also slow reduction of poverty in rural area. Margherita and Mello (2009) suggests that minimum wage legislation is hurting, instead of protecting vulnerable workers. Therefore, its use as social-protection and income-redistribution instruments is called into question. Moreover, they also observed that Indonesian minimum wage is very high, even in comparison with OECD countries, at about 65% of the median wage in 2004, which suggests that its dis-employment effect might be potentially strong.
C. Elasticity of Poverty, Inequality and Employment to Economic Growth
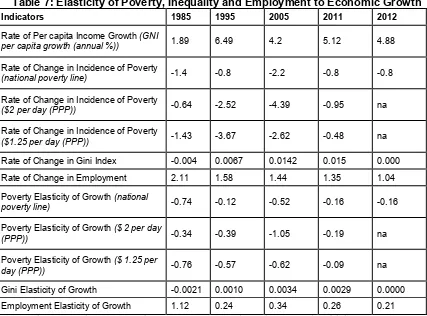
This section discusses the elasticity of poverty, inequality and employment to growth. The elasticity will provide information for us about the pattern of the effectiveness of economic growth to reduce poverty, create job opportunity and also reduce (increase) inequality. Table 7 shows the elasticity of poverty, inequality and employment to growth for each decade. The elasticity of poverty to growth (national poverty line) has declined sharply during three decades. In the mid of 1980s, the elasticity of poverty to growth was around -0.74 in which one percent of economic growth can reduce the poverty headcount ratio by 0.74 percentage point. When the poverty rate approached the level of around 11%-12% as the condition prior to the Asian economic crisis in 1995, the elasticity of poverty to growth has diminished by around one-six from 0.74 to 0.12. The declining of elasticity is because the nature of poverty has changed with many households living quietly far below the poverty line and others living just above the poverty line. Consequently, a considerable increase income are needed to lift those households out of poverty, while at the same time, a little shock can easily send out those households living just above the poverty line falling into poverty condition.
Page | 13
[image:17.595.88.515.125.441.2]elasticity of poverty to growth is not slightly different compared to the elasticity measured with the national poverty.
Table 7: Elasticity of Poverty, Inequality and Employment to Economic Growth
Indicators 1985 1995 2005 2011 2012
Rate of Per capita Income Growth (GNI
per capita growth (annual %)) 1.89 6.49 4.2 5.12 4.88 Rate of Change in Incidence of Poverty
(national poverty line) -1.4 -0.8 -2.2 -0.8 -0.8
Rate of Change in Incidence of Poverty
($2 per day (PPP)) -0.64 -2.52 -4.39 -0.95 na
Rate of Change in Incidence of Poverty
($1.25 per day (PPP)) -1.43 -3.67 -2.62 -0.48 na Rate of Change in Gini Index -0.004 0.0067 0.0142 0.015 0.000
Rate of Change in Employment 2.11 1.58 1.44 1.35 1.04
Poverty Elasticity of Growth (national
poverty line) -0.74 -0.12 -0.52 -0.16 -0.16
Poverty Elasticity of Growth ($ 2 per day
(PPP)) -0.34 -0.39 -1.05 -0.19 na
Poverty Elasticity of Growth ($ 1.25 per
day (PPP)) -0.76 -0.57 -0.62 -0.09 na Gini Elasticity of Growth -0.0021 0.0010 0.0034 0.0029 0.0000 Employment Elasticity of Growth 1.12 0.24 0.34 0.26 0.21
Source: Author’s Calculation based on data from World Development Indicators and Central Statistical Agency (BPS) na: not available
The elasticity of inequality to growth has a different pattern for each decade. During 1980s, economic growth was not only good for the poverty reduction but also good for improving inequality in Indonesia since economic growth can alleviate poverty and also decrease inequality. One percent of economic growth could reduce the poverty rate by 0.72-percentage point and also the Gini index by 0.0021 point. Economic growth during 1980s could be categorized as the inclusive growth since the poor is getting more benefits from the growth than the rich. However, the inclusive growth did not happen during 1990s and 2000s.
The elasticity of employments to growth has also continuously declined from 1.12 (1985) to 0.21 (2012). The condition of 1980s appears to be the increasing return to scale of job creation since one percent of growth could create more than one percent of job opportunities. The recent condition shows that employment is not sensitive to the economic growth. This is because the economic growth is mainly contributed by capital intensive of manufacturing industries and non-tradable sectors.
Page | 14
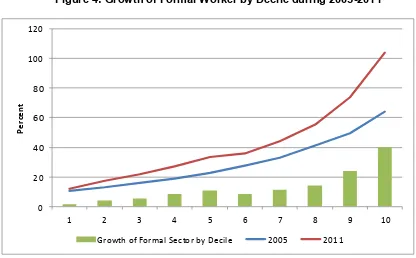
[image:18.595.97.513.128.386.2]skilled workers and higher education level that the lowest quintile households could not fulfill the requirement. This evidence can explain why inequality increases since 2006.
Figure 4: Growth of Formal Worker by Decile during 2005-2011
0 20 40 60 80 100 120
1 2 3 4 5 6 7 8 9 10
P
e
r
c
e
nt
Growth of Formal Sector by Decile 2005 2011
Source: Author’s Calculation based on Susenas 2005 and 2011
D. Growth, Poverty and Inequality at Provincial Level in Indonesia
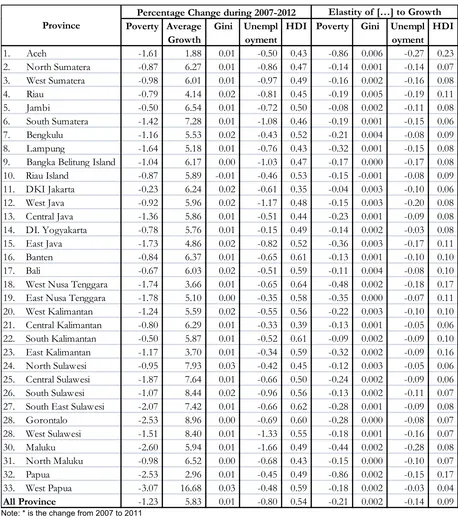
Table 8 shows the elasticity of poverty, inequality and unemployment to growth at provincial level from 2007 to 2012. It appeared that the economic growth has reduced the poverty in all provinces, while it also generated higher Gini index. Although West Papua experienced the highest percentage of average growth (16.68%), this growth could only reduce the poverty rate by 3.07 percentage points, the unemployment by 0.48 percentage point and increased the Human Development Index by 0.59 point. On the contrary, it increased the Gini index by 0.03 point.
On the other hand, the least average growth experienced by Aceh Province has reduced poverty incidence by 1.61 percentage point and unemployment rate by 0.50 percentage points. The greatest elasticity of poverty to growth is observed in Aceh and Papua. The elasticity was about -0.86 in which one percentage of economic growth can reduce the poverty incidence by 0.86 percentage point. This might not be surprising since the tsunami’s recovery process and rebuilding Aceh has created a lot of jobs and business opportunities that can alleviate poverty. At the same time, the benefits from the recovery process were not equally distributed among society; consequently the highest elasticity of inequality to growth was also in Aceh. In the term of the ability of economic growth to reduce unemployment, the highest elasticity was found in Maluku, Aceh, West Java and Riau. In the case of Maluku, one percent of economic growth can reduce unemployment rate by 0.28 percent.
Page | 15
[image:19.595.84.542.138.657.2]may significantly reduce poverty in Java while it may not affect the poverty reduction in the eastern part of Indonesia.
Table 8: Elasticity of Poverty, Gini and Unemployment to Growth at Provincial Level
Poverty Average Growth
Gini Unempl
oyment
HDI Poverty Gini Unempl
oyment HDI
1. Aceh -1.61 1.88 0.01 -0.50 0.43 -0.86 0.006 -0.27 0.23 2. North Sumatera -0.87 6.27 0.01 -0.86 0.47 -0.14 0.001 -0.14 0.07 3. West Sumatera -0.98 6.01 0.01 -0.97 0.49 -0.16 0.002 -0.16 0.08 4. Riau -0.79 4.14 0.02 -0.81 0.45 -0.19 0.005 -0.19 0.11 5. Jambi -0.50 6.54 0.01 -0.72 0.50 -0.08 0.002 -0.11 0.08 6. South Sumatera -1.42 7.28 0.01 -1.08 0.46 -0.19 0.001 -0.15 0.06 7. Bengkulu -1.16 5.53 0.02 -0.43 0.52 -0.21 0.004 -0.08 0.09 8. Lampung -1.64 5.18 0.01 -0.76 0.43 -0.32 0.001 -0.15 0.08 9. Bangka Belitung Island -1.04 6.17 0.00 -1.03 0.47 -0.17 0.000 -0.17 0.08 10. Riau Island -0.87 5.89 -0.01 -0.46 0.53 -0.15 -0.001 -0.08 0.09 11. DKI Jakarta -0.23 6.24 0.02 -0.61 0.35 -0.04 0.003 -0.10 0.06 12. West Java -0.92 5.96 0.02 -1.17 0.48 -0.15 0.003 -0.20 0.08 13. Central Java -1.36 5.86 0.01 -0.51 0.44 -0.23 0.001 -0.09 0.08 14. DI. Yogyakarta -0.78 5.76 0.01 -0.15 0.49 -0.14 0.002 -0.03 0.08 15. East Java -1.73 4.86 0.02 -0.82 0.52 -0.36 0.003 -0.17 0.11 16. Banten -0.84 6.37 0.01 -0.65 0.61 -0.13 0.001 -0.10 0.10 17. Bali -0.67 6.03 0.02 -0.51 0.59 -0.11 0.004 -0.08 0.10 18. West Nusa Tenggara -1.74 3.66 0.01 -0.65 0.64 -0.48 0.002 -0.18 0.17 19. East Nusa Tenggara -1.78 5.10 0.00 -0.35 0.58 -0.35 0.000 -0.07 0.11 20. West Kalimantan -1.24 5.59 0.02 -0.55 0.56 -0.22 0.003 -0.10 0.10 21. Central Kalimantan -0.80 6.29 0.01 -0.33 0.39 -0.13 0.001 -0.05 0.06 22. South Kalimantan -0.50 5.87 0.01 -0.52 0.61 -0.09 0.002 -0.09 0.10 23. East Kalimantan -1.17 3.70 0.01 -0.34 0.59 -0.32 0.002 -0.09 0.16 24. North Sulawesi -0.95 7.93 0.03 -0.42 0.45 -0.12 0.003 -0.05 0.06 25. Central Sulawesi -1.87 7.64 0.01 -0.66 0.50 -0.24 0.002 -0.09 0.06 26. South Sulawesi -1.07 8.44 0.02 -0.96 0.56 -0.13 0.002 -0.11 0.07 27. South East Sulawesi -2.07 7.42 0.01 -0.66 0.62 -0.28 0.001 -0.09 0.08 28. Gorontalo -2.53 8.96 0.00 -0.69 0.60 -0.28 0.000 -0.08 0.07 28. West Sulawesi -1.51 8.40 0.01 -1.33 0.55 -0.18 0.001 -0.16 0.07 30. Maluku -2.60 5.94 0.01 -1.66 0.49 -0.44 0.002 -0.28 0.08 31. North Maluku -0.98 6.52 0.00 -0.68 0.43 -0.15 0.000 -0.10 0.07 32. Papua -2.53 2.96 0.01 -0.45 0.49 -0.86 0.002 -0.15 0.17 33. West Papua -3.07 16.68 0.03 -0.48 0.59 -0.18 0.002 -0.03 0.04
All Province -1.23 5.83 0.01 -0.80 0.54 -0.21 0.002 -0.14 0.09
Elastity of […] to Growth Percentage Change during 2007-2012
Province
Note: * is the change from 2007 to 2011
Page | 16
IV . M A C R O E C O N O M IC P O L IC IE S A N D P O V E R T Y R E D U C T IO N
At the macroeconomic level, the fiscal, monetary, investment and trade policies have moved to the right direction. Though, the social expenditures and product subsidies are still maintained at a minimum level (even increase) similar to the pre-crisis level, the main drawback is a huge allocation on fuel subsidies, a low allocation on infrastructure development and no serious concern on developing agriculture sectors. In the term of monetary policy, Bank of Indonesia has enacted the regulation to support the development of small-medium enterprise sector that might benefit to support the poverty reduction and curb inequalities. Nevertheless, loan distributions provided by commercial banks are biased to service sectors and the western part of Indonesia. Both fiscal and monetary authority is likely well coordinated in mitigating internal and external turbulence. Moreover, to some extent, Indonesia has been liberated financial and trade sectors. All policies have supported the significant decrease of poverty during the last three decades. However, when the poverty rate is approaching a single digit, macroeconomic policies may not directly affect the poverty reduction, the government should focus more on micro policies such as education, social health insurance and financial inclusion etc.
A. Fiscal Policy
There are significant changes in budget allocation starting from 2001 due to changing from the centralized system to more the decentralized system. The share of transfer to local governments is gradually increasing up to 30.9% but the share of development expenditure is sharply decreasing to 7% in 2009 due to budget reallocation. Provinces and local governments now manage 36% of total public expenditures and carry out more than 50% of public investment. In addition, Government of Indonesia (GOI) pays much attention to education and health sectors represented by an increase in budget allocation to both sectors. Education and health consumed 9.78% of budget in 2005 and by 2012 those consumed almost 11.78% of budget. Education spending reached 2.76% of GDP in 2011 and total public health spending was still below 1% of GDP. In general, the expenditure on health, education, social safety net, and product subsidies (fertilizer, fuel, electricity, etc.) are still maintained at a minimum level as same as the pre-crisis level.
Generally speaking, the taxation system is moving in the right direction. The Indonesian value added tax (VAT henceforth) conforms in its design to the best practice in very many respects (Marks, 2003). For example, VAT on capital goods expenditures is creditable against VAT obligations. Indonesia also exempts a wider range of goods and services which are especially consumed by the low income group. The role of indirect taxes, which previously were dominant, has decreased and direct taxes now dominate so that the distortion in economy can be minimized. During 1996-2009, the average proportion of income tax to total revenue (33.38%) exceeded the proportion of VAT (20.73%). During 2010-2012, the average proportion of income tax to total revenue has become 36.5% that exceeded the proportion of VAT (23.6%).
Page | 17
Table 9: Revenue and Expenditure (% of GDP) (1985 – 2012)
Indicators 1985 1995 2005 2011 2012
Total revenue
Tax revenue (% of GDP) 15.64 (1991) 14.02 12.50 11.77 12.33
Income tax (Taxes on income, profits and capital
gains (% of revenue)) 59.20 (1991) 52.23 48.83 35.64 37.84 VAT: Taxes on goods and services (% of
revenue), include general sales and turnover or value added taxes, selective excises on goods, selective taxes on services, taxes on the use of goods or property, taxes on extraction and production of minerals, and profits of fiscal monopolies.
26.81 (1991) 31.64 14.99 29.34 32.83
Trade tax Taxes on international trade (% of
revenue) 5.17 (1991) 4.53 3.14 4.47 4.20
1
Non-tax revenue (Grants and other revenue (% of revenue) -
Grants and other revenue include grants from other foreign governments, international organizations, and other government units; interest; dividends; rent; requited, non-repayable receipts for public purposes (such as fines, administrative fees, and entrepreneurial income from government ownership of property); and voluntary, unrequited, non-repayable receipts other than grants.
5.98 (1991) 10.24 28.57 27.77 23.031
Current expenditure (Gross national expenditure
(% of GDP)) 98.25 101.33 95.85 98.59 98.56
Government expenditure (% of GDP) 11.23 7.83 8.11 8.97 8.93
Revenue surplus/deficit
Cash surplus/deficit (% of GDP) - Cash surplus or deficit is revenue (including grants) minus expense, minus net acquisition of nonfinancial assets. In the 1986 GFS manual nonfinancial assets were included under revenue and expenditure in gross terms.
0.68 (1991) 1.72 -0.13 -1.14 na
Development expenditure (Research and
development expenditure (% of GDP)) na
0.068 (2000)
0.048 (2001)
0.083 (2009) na Total government expenditure
(in $ billion constant 2005 price) 69.13 125.82 179.13 237.85 252.2
Budget deficit (% of GDP) 1.24 1.32 0.52 1.13 1.77
Domestic borrowing (% of Deficit) 1.85 18.89 192.36 113.59 102.23 Foreign financing (External debt stocks (% of
GNI)) 44.35 63.40 52.15 25.96 na
1
the realization of government budget in the semester I-2012 na = not available
Source: World Development Indicators and Ministry of Finance-Republic of Indonesia
Page | 18
in both 2004 and 2005. Confronted with these financial problem, GOI doubled fuel prices in 2005. When oil prices reached a record high in mid-2008, Indonesia faced the same challenge as in 2005. In May 2008, the government increased fuel prices by another 30%. Lately, GOI has also increased fuel prices in 2013.
[image:22.595.87.519.297.504.2]Son (2008) observed that Indonesia spent 5 per cent of gross domestic product on energy subsidies. The massive fuel subsidies reduce fiscal space which means the government has fewer sources to promote economic growth through investment in infrastructure or human capital (Agustina et al., 2008). This would also cause a worsening in the income distribution because, in 2008, the richest income group received fuel subsidies approximately IDR 111,533/month/capita while the lowest income group received fuel subsidies approximately IDR 10,787/month/capita. In terms of government expenditure, the share of subsidies to total government expenditure significantly increases by almost 17%. Subsidies currently account to almost 57% of government expenditure (Dartanto, 2013b).
Table 10: Public Spending on Education and Health (1985 – 2011)
Indicators 1985-94 1995-04 2005-11
% of GDP and % of Total Expenditure
% of GDP
% of Govt Expenditure
% of GDP
% of Govt Expenditure
% of GDP
% of Govt Expenditure Education (Total public
spending on education – average)
0.911
(1989) na 2.03
2 13.973 3.10 16.57
Health (Total health
expenditure – average) na na 2.16 4.53 2.88 5.82 Agriculture related
(fertilizer subsidies) 0.39 1.96 0.03 0.11 na na
Infrastructure 7.10 37.27 2.80 18.78 1.80 11.83
Fuel Subsidies na na 3.04 20.95 2.34 16.51
Anti-poverty programs
(social assistance) na na na na 1.13 6.47
na = not available
Source: World Development Indicators and Ministry of Finance-Republic of Indonesia
Large fuel subsidy reduces the fiscal room, which may be used to promote economic growth and create job opportunities. As a result of the high proportion of subsidies, infrastructure is one of another account that has experienced significant decrease from 1985-1994 to 2005-2012. In 1985 infrastructure consumed more than 37.27% of GDP, while in 2005-2012 it only consumed around 11% of GDP. Whereas as we discuss before, the nature of poverty in eastern part of Indonesia such as Kalimantan, Sulawesi, Maluku, and Papua are mostly influenced by infrastructure problems both caused by the isolation or being damaged by social riots. Reallocating fuel subsidies into infrastructure projects will have double effects in the economy: promoting long run sustainable economic growth while reducing inequality issue.
B. Monetary Policy
Page | 19
Indonesia has also been given independence in conducting its monetary policy, while coordinating with the government in setting the inflation target (Goeltom, 2008).
[image:23.595.89.525.247.558.2]Table 11 illustrates some indicators of Indonesian monetary sector. It is shown that monetary base has significantly decreases after the crises from 48.59% of total GDP (1995) to around 40% of total GDP in 2012. This condition is due to the tight monetary policy conducted by the central bank to control the high level of inflation. Table 11 also shows continuous and significant decrease both for deposit and lending interest rate that will induce more investment from the country. While deposit interest rate and lending interest rate in 1985 were 18% and 21.49% respectively, Bank of Indonesia successfully cut both the interest rates to 5.95% and 11.80%. A low lending rate will increase the opportunity of potential business getting credit from commercial banks.
Table 11: Growth in Money and Inflation (1985 – 2012)
Indicators 1985 1995 2005 2011 2012
Money Supply (M2 - % of GDP) 24.16 48.59 43.25 38.78 40.09
Inflation (Consumer Prices – annual %) 4.73 9.43 10.45 5.36 4.28
Interest rate of borrowing / lending
Deposit interest rate (%) 18 16.72 8.07 6.93 5.95 Lending interest rate (%) 21.49 (1986) 18.85 12.4 14.05 11.80 Real interest rate (%) 21.61 (1986) 8.34 -0.25 3.99 6.96 Investments
Gross Fixed Capital Formation, % of GDP 22.72 28.43 23.64 31.93 33.14 Private (Gross Fixed Capital Formation,
private, % of GDP) na na na na na
Savings
Gross Domestic Savings (% of GDP) 29.71 30.59 29.23 34.18 33.79
Gross Savings (% of GDP) 24.59 28.14 26.04 32.01 31.33
Credit
Domestic credit to private sector (% of GDP) 19.70 53.52 26.43 31.74 34.90
Credit for the poor na na na na na
na = not available
Page | 20
Table 12: Outstanding of Loans of Commercial Banks by Economic Sector (IDR Trillion)
Economic Sector 2002 2005 2008 2011 2012
Agriculture, Livestock, Forestry &
Fishery 2.50 8.37 8.02 8.19 8.78
Mining and Quarrying 0.16 0.62 0.63 1.49 1.63
Manufacturing Industry 8.55 27.15 23.13 19.65 19.91
Electricity, Gas and Water Supply 75.82 0.31 1.53 2.75 2.79
Construction 0.95 6.28 7.00 5.93 5.86
Trade, Hotel, and Restaurant 7.12 33.85 33.66 31.98 33.49
Transport and Communication 1.13 4.57 6.86 5.91 5.89
Financial, Ownership & Business
Services 3.28 16.35 17.16 10.89 11.38
Services 0.50 2.49 2.01 13.22 10.28
Source: Bank of Indonesia
Table 12 confirms a change in the sectoral composition of Indonesian economy from agriculture to industry and services sector. By 2012, the top three sectors in term of loans provided by commercial banks are trade, hotel and restaurant, manufacture, and financial services. Commercial banks allocated almost 64.7% of total outstanding loans to these three sectors. Despite significant growth in loans for agriculture sector, services sector surprisingly has surpassed the agriculture sector in 2011, implying that service sector has become more promising than agricultural sector in the last two decades. Unbalanced sectoral credit allocation may contribute to the rising inequality in Indonesia.
From Table 13, it is obviously shown that there is imbalance between the distributions of outstanding loan among region in Indonesia. From the last decade, the banking sector put most of their financial resource into three provinces, DKI Jakarta, East Java and West Java. The total credit allocated into three provinces contributed more than 50% from the national credit. At the extreme case, the credit allocated in DKI Jakarta is more than 150 folds of credit allocated in Maluku. Unbalanced credit allocation might contribute a rising inequality both between region and also within region. The government should adapt policy for the banking sector to allocate their proportion of credit to the rural area such as in the eastern part of Indonesia.
After the era of crisis in 1998, Bank of Indonesia as the monetary authority in Indonesia has recorded several achievement such as a fully control on inflation and price stability. Bank of Indonesia has also implemented some regulations which are concordance with poverty alleviation program. In 2012 considering that small medium enterprise has played an important role in the Indonesian economy, Bank of Indonesia has issued Bank Indonesia Regulation (PBI) no. 14/22/2012 in which commercial banks has to allocate 20% of total loans to the small medium enterprise sector. This regulation is expected to boost the size of SME in Indonesia that will result in more jobs and less inequality.
Page | 21
[image:25.595.86.528.153.586.2]Improving access to financial services in the eastern part of Indonesia will provide a greater opportunity of business sectors to expand their business. The business expansion will boost economic growth as well as employment creation.
Table 13: Outstanding of Loans of Commercial Banks by Provinces (IDR Billion)
2002 2005 2008 2011 2012 2002 2005 2008 2011 2012
Nanggroe Aceh
Darussalam 1,948 4,431 10,358 21,162 23,695 0.72 0.77 0.97 1.13 1.02
North Sumatera 11,863 30,235 54,835 89,838 111,006 4.37 5.25 5.12 4.79 4.77
West Sumatera 4,214 8,167 15,532 29,030 33,765 1.55 1.42 1.45 1.55 1.45
Riau 8,475 12,837 25,048 46,013 55,201 3.12 2.23 2.34 2.45 2.37
Jambi 2,588 4,872 9,719 19,360 23,762 0.95 0.85 0.91 1.03 1.02
South Sumatera 5,353 9,969 19,849 44,256 56,045 1.97 1.73 1.85 2.36 2.41
Bangka Belitung 618 1,422 2,839 6,512 7,780 0.23 0.25 0.27 0.35 0.33
Bengkulu 689 1,810 4,934 9,745 12,346 0.25 0.31 0.46 0.52 0.53
Lampung 3,953 9,445 18,704 34,895 40,456 1.46 1.64 1.75 1.86 1.74
Banten 10,078 23,573 44,258 96,783 132,373 3.71 4.10 4.13 5.16 5.69
DKI Jakarta 94,649 192,759 352,811 543,749 665,289 34.86 33.50 32.95 28.96 28.59
West Java 34,062 74,325 136,454 242,687 300,201 12.55 12.92 12.74 12.93 12.90
Central Java 24,353 48,434 84,789 142,910 174,777 8.97 8.42 7.92 7.61 7.51
D.I. Yogyakarta 2,482 6,183 10,415 16,693 20,250 0.91 1.07 0.97 0.89 0.87
East Java 31,835 66,487 118,067 202,915 254,712 11.73 11.55 11.03 10.81 10.94
Bali 6,090 10,945 19,444 38,093 50,256 2.24 1.90 1.82 2.03 2.16
West Nusa Tenggara
Barat 1,583 3,554 7,056 13,808 17,055 0.58 0.62 0.66 0.74 0.73
East Nusa Tenggara 1,214 2,616 5,527 10,972 13,351 0.45 0.45 0.52 0.58 0.57
West Kalimantan 2,769 6,051 12,044 25,773 33,745 1.02 1.05 1.12 1.37 1.45
Central Kalimantan 1,649 3,258 6,710 19,414 22,011 0.61 0.57 0.63 1.03 0.95
South Kalimantan 2,605 6,373 13,352 25,347 31,183 0.96 1.11 1.25 1.35 1.34
East Kalimantan 3,874 11,129 21,428 48,085 62,433 1.43 1.93 2.00 2.56 2.68
North Sulawesi 1,968 4,371 10,131 18,706 21,668 0.72 0.76 0.95 1.00 0.93
Gorontalo 408 1,011 2,091 5,110 6,372 0.15 0.18 0.20 0.27 0.27
Central Sulawesi 1,381 3,302 6,766 13,806 17,485 0.51 0.57 0.63 0.74 0.75
South Sulawesi 8,168 16,256 30,846 56,288 68,858 3.01 2.82 2.88 3.00 2.96
Southeast Sulawesi 803 1,654 4,125 9,275 11,853 0.30 0.29 0.39 0.49 0.51
North Maluku 191 604 1,499 3,550 4,301 0.07 0.10 0.14 0.19 0.18
Maluku 356 915 2,475 5,753 6,533 0.13 0.16 0.23 0.31 0.28
Papua 1,289 2,904 5,249 11,691 15,287 0.47 0.50 0.49 0.62 0.66
West Papua - - 2,166 4,468 6,141 - - 0.20 0.24 0.26
West Sulawesi - 691 1,954 3,470 4,317 - 0.12 0.18 0.18 0.19
Riau Island - 4,884 9,300 17,198 22,818 - 0.85 0.87 0.92 0.98
Total 271,508 575,467 1,070,775 1,877,355 2,327,325 100 100 100 100 100
Value in IDR Billion Share to Total National (%)
Province
Source: Bank of Indonesia
V . A D J U S T M E N T P O L IC IE S A N D P O V E R T Y R E D U C T IO N
Page | 22
[image:26.595.82.532.153.313.2]responses as well as macro-prudential policies for management of capital inflows and banking liquidity.
Table 14: Balance of Payment Indonesia 2002-2011
Indicator Year
2002 2005 2006 2008 2009 2011
Internal
GDP growth (% yoy) 4.38 5.68 5.48 6.01 4.63 6.46
Inflation (% yoy) 5.9 17.11 6.60 11.06 2.78 3.79
External
Export (Million US $) 59,16 86,99 103,5 139,60 119,64 200,78 Import (Million (US $) 35,65 69,46 73,86 116,69 88,71 166,01 Current Account (Million
US $) 23,51 17,53 29,64 256,29 208,36 366,79
Reserves (Million US $) 30,754.34 32,774.19 40,697 49,164 60,369 103,380
Source: Bank of Indonesia
Table 14 shows the status of internal and external balance of Indonesia during 2002-2011 as described by economic growth and rate of inflation. GDP growth shows increase continuously, with the exception of 2009 due to global crisis. In 2011, economic growth reached 6.5%, the highest economic growth during the past ten years, while inflation was a mild 3.79%. The inflation rate generally shows decreasing trend from 2002-2011, with the exception of year 2005 when GOI increase the price of subsidized fuel. On the external side, Indonesia’s balance of payments (shown by current account) charted a respectable surplus that expanded the international reserves position and contributed to appreciation in the rupiah exchange rate from 2002 - 2011.
From the Government side, fiscal policy sought to deliver an enlarged stimulus while safeguarding fiscal sustainability. At the sectoral level, the Government worked hard to boost the quality of economic growth through improvements to the investment climate, accelerated construction of infrastructure, stronger competitiveness in industry and exports and greater national food resilience, including measures to stabilize prices.
A. Financial Liberalization
In 1983 Indonesian banking system implemented a new deregulation, marked the beginning of financial liberalization in Indonesia. Table 15 shows how the liberalization in the financial sector could contribute to decrease the lending rate from 21.49% in 1985 to 11.79% in 2012. Nevertheless, interest rate spread (lending rate minus deposit rate) is still quite high. The financial liberalization and directed lending schemed by GOI had influenced the interest spread. Directed lending policy can reduce profitability of banks, so that banks may charge higher interest rates on other commercial loans thus raising overall spread (Dagva, 2006). The high interest rate spread could signify a number of structural and other problems, such as a lack of competition in banking industry, scale diseconomies, and high operating costs.
Page | 23
However, the increasing economic growth led by the financial liberalization may not be directly perceived by Indonesian poor.
[image:27.595.91.521.236.426.2]Financial liberalization increasing access to financial may go to those who work in formal sector. Meanwhile, most of Indonesian poor work in informal sector or even unemployed. Thus, complementary policy like microfinance institution for the poor is really needed. This micro financing scheme may help the expansion of the micro or small medium enterprises (MSMEs) thus could increase employment creation. Finally, one thing to be considered by GOI regarding financial liberalization is that more freedom of action of banks and other financial intermediaries can increase the opportunities to take on risk, thereby increasing financial fragility (Bank of Indonesia, 2010).
Table 15: Trends in Interest Rate and Its Spread (%) (1985 – 2012)
Description 1985 1995 2005 2011 2012
Deposit rate 18.00 16.72 8.08 6.93 5.95
Lending Rate 21.49* 18.85 14.05 12.40 11.79
Interest rate spread 6.10* 2.13 5.97 5.47 5.85
Real deposit rate 9.56 7.29 -2.37 1.53 1.67
Real lending rate 11.56* 9.42 3.60 7.05 7.51
Gross Domestic Savings (% of GDP) 29.71 30.59 29.33 34.38 33.79 Gross Domestic Investment, net inflows
(% of GDP) 27.96 31.93 25.08 32.94 35.34
Foreign Direct Investment (% of GDP) 0.35 2.15 2.92 2.27 2.26 Stock Traded, total value (% of GDP) 0.004** 7.13 14.66 16.49 10.44
Source: World Development Indicators Note: * is the 1986 value; ** is the 2008 value.
Related to financial inclusion issue, the number of MSMEs is around 51.3 million units or 99.91% of the business unit totals. MSMEs could absorb 97.1% of total workers and its contribution to GDP was up to 55.6%. Nevertheless, around 60% of Indonesia population including these MSMEs has no financial access. Thus, policies carried by GOI are by giving credit to them by commercial banks and non-bank financial institution. There is also program named People’s Business Loan (Kredit Usaha Rakyat /KUR). These aimed at making them more financially included. While the exclusion of people from financial services will only perpetuate their poor lives, financial inclusion will link the previously excluded group with the formal economy and they will eventually contribute more to a country’s economic growth.
B. Trade Liberalization
Economic theory offers many reasons to expect a country’s trade liberalization to stimulate its economic growth, such as by reaping economies of scale, improving performance in the face of new competition, and benefiting from better inputs and technologies available from abroad. Trade liberalization could affect the poor of countries. However, none of these outcomes is guaranteed, so ultimately whether trade does or does not stimulate countries’ incomes is an empirical matter.