Munich Personal RePEc Archive
Performance measure of a port-valley
system: Data availability and their limits
in freight transport and logistics
Verny, Jérôme and Gbaguidi, David Sedo
MOBIS - NEOMA Business School, African School of Economics
April 2014
Online at
https://mpra.ub.uni-muenchen.de/55480/
Performance measure of a port-valley system:
Data availability and their limits in freight
transport and logistics
y
Verny Jérôme
zand Gbaguidi David
xFirst draft, April 2014
Abstract
This article seeks to measure the performance of a complex geoe-conomic system such as a “port-valley”. Public and private decision-makers involved in the development of a port-valley system need inno-vative methodological advances in freight transport data collection and production. This research …ts into a development process of modelling frameworks in order to overcome di¤erent economic geography problems in freight transport and logistics. Within these frameworks, using de-scriptive statistics and time series analysis techniques, the purpose to be undertaken will allow for e¢cient and robust indicators which will con-tribute to measure the performance of this type of geoeconomic system. The study of these spatial and temporal phenomena will be inspired by works in macroeconomics and evolutionary biology in order to provide a general framework that will simplify all stakeholders’ decision-making process. In the empirical studies, we will focus our attention on mod-elling: the dynamics of tra¢c registered by the seaports of a valley; the synergy of the economic sectors present in a valley and; the main activ-ities of stakeholders involving in speci…c transport and logistics sector of this valley. However, gaps in terms of availability of data in the …elds of economic geography make it di¢cult to implement this kind of study and indirectly to measure the e¢ciency in stakeholders’ decision-making process. The construction of a database that will re‡ect current and his-torical situations of the port-valley’s activities stands out as a preliminary and inevitable step.
Keywords: Port-valley system, Spatial-temporal freight data, Markov switching model, Multi-table models.
yThis paper contains results gained from the "RISC" project, a European project funded
by the European Union, the French ministry of research and the Upper-Normandy region. Many thanks are due to the MOBIS Research Institute team for their contribution to the RISC project.
zMOBIS Research Institute - NEOMA Business School. 1 rue du Maréchal Juin - 76825
Mont-Saint-Aignan cedex - FRANCE ; jerome.verny@neoma-bs.fr
xMOBIS Research Institute - NEOMA Business School. 1 rue du Maréchal Juin - 76825
1
Introduction
Many scienti…c studies have helped to get a thorough knowledge of seaports policies, the logistics organization in the hinterland of major seaports and the problematic of the ports competitiveness (Aronietis and al. 2010; DevPort, 2013; Malchow and Kanafani, 2001; Magala and Sammons, 2008; OECD, 2010). In recent decades, these studies showed that the lack of dynamism of a "port cor-ridor" system could be analyzed through di¤erent explanatory factors. These factors are linked to regional, national and international economic conditions, but also to the regulations set place in each seaport area. From an economic geography point of view, strong correlations tend to emerge between tra¢c of goods recorded by major seaports, the volumes of logistics activities of main ports-valleys, their potential e¤ective population and wealth (IRSIT, 2004). In addition, their nodality turns them into key actors in the international trade network. Indeed, ports-valleys appear as multi-modality places which are facil-itating convergence between the modes of inland transport and allowing a con-nection of economic systems with local speci…cities in the globalization process (Frankel, 1999; Hayuth, 1987; Rodrigue, 1999).
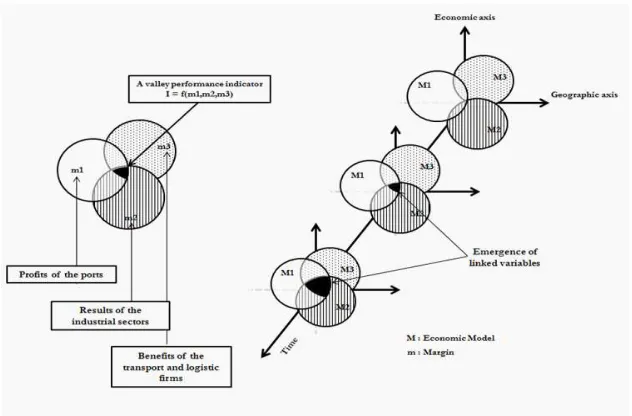
Figure 1. Analytic and organization dynamics of a geo-economic system
The intricacies of these entanglements a¤ect directly or indirectly the sea-ports economic performance terms as well as the competitiveness of their respec-tive hinterlands (Verny, 2007). The …gure 1 also reveals the need to take into account interactions among the decisions of each practitioner (local or foreign) in the dynamic of this geoeconomic system. Moreover, even if these di¤erent territorial actors perceive the activities that are occurring therein as a result of their e¤orts and/or their fundamental strategic choices, the importance of the number of the geoeconomic factors may a¤ect their decision-making process and make their expectations and/or forecasts more di¢cult and uncertain. Fur-thermore, under the impact of potentially international goods and services de-mand acceleration, the use of port-valley system continues to assert itself. This acceleration in the pace of global demand highlights the limits in terms of in-frastructure and logistics performance. Thus, it emphasizes on their inability to facilitate the convergence between supply and demand of their respective foreland and hinterland. This inability of some ports-valleys to allow an ade-quate delivery of increasingly volumes of goods appears as a real limit to their economic development.
increasingly in the determination of a port-valley performance. The evolution of this impact (from growth regimes to crisis episodes and vice versa) could be seen as another crucial element having a signi…cant in‡uence on the relative performance of a port-valley system (Fleming and Hayuth, 1994). Similarly, some historical and geographical conditions allowed the emergence of territorial disparities that economic, demographic and/or consecutive ecological changes contribute to strengthening.
2
Empirical framework
Based on these general …ndings, this paper proposes a series of spatial economet-rics analytical frameworks to understand the internal changes in the organization of activities within a geoeconomic system such as a port-valley. This will bring out the relationship between these changes and the economical states of both the local market of a port-valley system and those related to the speci…cities of competing systems. The idea is essentially to provide an analysis clarifying the complex interactions between macroeconomic circumstances and microeco-nomic strategies of the studied system actors. Because of the diversity of issues characterizing the existing transport and logistic activities within a geoeconomic system, di¤erent modeling approaches can be implemented (…gure 2).
2.1
Regime switching in the maritime vessel tra¢c
dy-namic
In order to explore some of the fundamental problems linked to seaports ac-tivities, such as the evolution of types of freight tra¢c, a …rst empirical study framework (Modeling 1) can be used. In this modeling framework, one can focus on understanding the factors in‡uencing the pace of development of all activities around the seaport (Bottasso and al., 2013; Debrie and Guerrero, 2008). These economic geography analyses can be performed using time series methods such as simple linear regression models like OLS or complex nonlinear parametric speci…cations (Time Varying Parameter (TVP), Markov Switching (MS), etc.). In these modeling frameworks, the evolution of the maritime tra¢c categories can be studied to determine the potential gains/losses of activity which could face the ports of a particular valley (e.g. Le Havre and Rouen in the Seine valley case) within a competitive port-valley system1 (e.g. the North-West coast of Europe).
1For instance, we could consider the tra¢c evolution of both Rouen and Le Havre, the
The study of such issues could be in the context of an a priori absence of information considering a class of models describing situations where the observations belonging to a particular tra¢c regime is presupposed unknown. One of the real contributions of this type of regimes switching models known as “Markov Switching models” is that they allow the description of situations in which the environment states are formally distinct from each other and, at every moment, candidates to explain the economic phenomenon under consideration. The distinctive feature of the majority of these kinds of regime-switching models is probably all assumptions made about the mechanism that governs the change itself.
The analyses considered in the context of our study could be implemented under the guise of models for which the distribution of observations with respect to plans is not known (Hamilton, 1989, 1994, 1995). Based on this assumption, the di¤erent states of the system can be speci…ed in the context of probabilistic models of Markov type. In this class of models, which consider the fact that regimes change following unknown transition probabilities, di¤erent speci…ca-tions can be tested essentially in two main reasoning angles (Gbaguidi, 2011). First, the argument could focus on the short-term relationship that emerges between the di¤erent seaports tra¢cs dynamics. Secondly, the reasoning could be expanded at long-term relationships that may exist between these maritime tra¢c variables.
Following these two angles, regime switching models could be estimated, based on the idea that changes in the dynamics of each tra¢c variable are inde-pendent of each other. On one hand, the aim would be to consider that regime changes in the freight tra¢cs dynamics of a particular seaport are independent by using a Markov Switching-Vectorial AutoRegressive models (MS-VAR). On the other hand, one can considers a case in which the regime changes in the freight tra¢cs of this particular seaport may be driven by those of one or all of its competitors (Otranto, 2005). This second speci…cation refers to more com-plex regime switching models called Multi-Chain Markov Switching-Vectorial AutoRegressive models (MC-MS-VAR).
Over a sampling period, a set of parameters characterizing the individual but also collective dynamics of (i) containerized, (ii) liquid bulk, (iii) oil or (iv) dry bulk and (v) conventional general cargo freight tra¢cs, recorded by the sea-ports could be estimated on an annual basis. Results that would emerge from such estimations could help to better visualize a port-valley choices impacts on its performance. Similarly, this empirical study will seek to identify plans (reg-ulatory, etc.) that could explain speci…c trajectories of the system’s economic performance in relation to those of competing systems. Insofar as the dynamics of these performances can be correlated to changes in the hinterlands of these seaports, this study also aims to verify the claims of the literature concerning the existence of (i.e. French, Belgian, Dutch, Franco-Belgian or Belgian-Dutch) eco-nomic activities clusters and the impacts of such complementarities between the
seaports of these potential clusters on the activity of a benchmark port-valley.
2.2
Synergy between a port-valley economic sectors
The second framework considered in the empirical study (Modeling 2) proposes an approach in which the study will focus on the analysis of a set of the port-valley system’s strategic sectors. Indeed, with a territorial coverage of a wide range of production and distribution …rms involved in various …elds and comple-mentary activities, territories comprising the port-valley system are inherently conducive to the deployment of industrial and commercial sectors both “old” (i.e. automotive, construction) and innovative (waste, new energy).
For instance, the waste industry …rms’ deployment within the valley terri-tories can reveal this valley real strength to meet tomorrow challenges. The actors of this sector could cover a wide range of expertise which allows them to treat various waste types (e.g. hazardous waste, infectious medical waste risks, waste equipment, electric and electronic waste from building and public works, the ultimate waste, green waste). Furthermore, the eco-design develop-ment by the private sector in order to limit the material waste should facilitate the products recycling in the future (Gold and Seuring, 2011). A renewed ef-fort in the waste collection and transport optimization through (i) collaborative operations with the logistics sector, (ii) the deployment of alternative transport modes, and (iii) the development of places of voluntary contribution proximity, appear as local major issues (Mutha and Pokharel, 2009). Similarly, in view of enhancing the residual activity of the port-valley industries, many solutions can be implemented in synergy with logistics (Reverse logistics).
Assuming that transport should not be made empty and that consumers as well as manufacturers can be encouraged to (a) optimize their waste production and (b) register in sorting dynamics, packaging and collection best suited to the requirements of waste management stakeholders, the logistical organization of the valley’s territories, in its forward and reverse settings, should allow to increase the competitiveness of all sectors, including waste in parallel or in support of other traditional industrial sectors (Coudun and Gégout 2006). Based on this observation and on audits conducted with …rms already established or wishing to establish themselves in the valley’s territories, it will determine the current needs in terms of dedicated logistic platforms creation, but to adapt the tax system to the sector particularities, whose is a raw material for industrial products.
issues related to actors’ geographical location strategies in a given industrial sector.
2.3
Micro-economic coverage of a port-valley system
The third empirical framework emphases on the micro-economic performance measure of a port-valley system (Modeling 3). It also aims to establish the map-ping of the organization of services activities in logistics areas and their periodic evolution. Similarly, the impact of features attached to the infrastructure net-work which bene…ts the host community of the port-valley, the organizational e¢ciency of logistics platforms and the quality of services they induce on ter-ritorial development could be analyzed. In this context, it seems relevant to reason at a referential geo-statistical unit level (a …ner division of the territorial system in areas/employment areas of activity) to highlight a number of keys aspects that can characterize speci…c settlement logics of transport and logistics activity categories (Strale, 2013).
This analysis of settlement logics and performance dynamics of the system’s territories, in terms of goods/services production, could be performed using multidimensional descriptive statistics models such as multi-table models. In the …eld of economic geography, the study of a system through the place, in-frastructure, planners and their interactions in a space-time dimension, leads to the production of a complex three-dimensional data (variables x area x time) that can naturally be organized in the form of multiple tables. In statistics, the so-called multi-table methods were speci…cally created to simultaneously analyze multiple data tables. However, although these methods seem perfectly suited to the processing of data incorporating time and space factors, their use in economic geography is, to our knowledge, not yet widespread2. By entering the
interface of statistical and spatial econometric, our modeling frameworks want to assess the extent to which multi-tables analysis methods actually answer the questions asked by economists and geographers within the spatial-temporal studies of a port-valley system.
The proposed methods seem theoretically well suited to the issues raised by geographers and economists. In particular, they allow addressing the problems of spatial and temporal structures identi…cation and studying the permanence of these structures in time and/or space. Similarly, the ability to analyze K data tables simultaneously lets to consider the spatial or temporal permanence of the relationship between economic phenomena and geographical areas. The interest of these multi-table methods is strongly linked to the goal targeted by the study and the degree of accuracy desired by economist/geographer at the exploitation of results. Thus, a major challenge is the absolute necessity to formulate precisely the objective during their implementation. To the variety of possible questions responds a variety of possible ways of looking at the data set
2Despite the complexity of their underlying theoretical foundations, the ability of these
- variables x area x time -, and therefore the choice of perspective is a critical element for the analysis.
Among those multi-table methods, one could focus mainly on the three indexes-tables structuring method (in French: Structuration des Tableaux A Trois Indices de la Statistique, or STATIS) (Lavit, 1988; Lavit and al., 1994). The latter is in fact considered with multiple factor analysis (in French: Analyse Factorielle MULTiple, or AFMULT) as a primary method of simultaneous ordi-nation of several tables whose essence is Euclidean (Bove and Di Ciaccio, 1994). These methods have been recently presented by Dazy and Le Barzic (1996) in a book on evolutionary data analysis in the …eld of socio-economics. Similarly, we could focus on the analysis of Multiple Co-Inertia (in French: Analyse de Co-inertie Multiple, or ACOM), whose basic principles are similar to those of the Generalized Canonical Analysis (in French: Analyse Canonique Généralisée) (Carrol, 1968; Kettering, 1971; Chessel and Hana…, 1996). The general principle of these methods is to de…ne at …rst the common structure, called “compromise”, of a set of K tables, then to study the variability of this structure through each table3.
Figure 2. Modeling a port-valley transport and logistics activities
3If the tables do not have the same number of rows and columns, they are not directly
3
Data, discussion and perspective
The di¤erent estimates of these econometric models are designed to identify the existence of potential episodes of cyclical or structural breaks in the develop-ment of geoeconomic system activities. Similarly, the impledevelop-mentation of these statistical methods helps to understand the reasons and e¤ects of transport and logistics institutions geographical relocations operated in a given sampling pe-riod. Moreover, this type of analysis leads to the development of a mapping series regarding socio-economic performance, by transport and logistics activ-ity, across di¤erent employment areas of the port-valley system. Fitting in this context of a port-valley activities modeling, and without addressing in detail the issues inherent in conducting such a study, this article focuses in particular on issues related to availability and limitations of data.
3.1
Importance of freight data for decision-making
What do we need in addition, if we already have freight data? Today, through interconnected digital networks, it seems very easy to collect freight data. But in some cases, these data are often con…dential for reasons of reliability and/or commercial competition. For instance, the seaports do not share statistics based on individual productions, shipping lines or other means which would make agents activities easily discernible. Although one can consider that economic agents and institutions have access to a wealth of freight data on di¤erent areas of their activities, the collection and manipulation of these data require large investments of time, e¤ort and resources as well human and material4.
For a majority of public and private actors the question of how data can be used to improve the quality of decisions is a central point in the process of strate-gic and operational choices of an organization. In economic geography, the use of economic and …nancial data relating to the transport and logistics activities by the main actors involved in the process of territorial development becomes increasingly signi…cant. Most of the research works have been listed in frames called rational approaches to decision making as they assume the use of such data to highlight the causes and/or consequences of the choices implemented by the economic agents. However, these approaches based on the use of infor-mation extracted from data have been criticized because data and inforinfor-mation are immediately considered as facts or truths. Similarly, some researchers con-sider that the way to collect data, both historically and theoretically implicitly provides oriented information on the public and private decision-makers.
In addition, the context of data collection can signi…cantly a¤ect their quality and resulting interpretations. Therefore, special care should be taken when using data for a purpose other than that for which they were originally collected. Furthermore, although there are plenty of tools and techniques to help making better information from the data, many policymakers are often « drowned » in the abundance of these data. To extract a maximum of information from the
4Similarly, these methods are relevant for qualitative data describing economic agents’
available data in an attempt to facilitate economic decision-makers, one needs a structured statistical approach. In this context, one has to de…ne the data that will be required for analyses purposes, how they are collected, analyzed or interpreted, but also what the main contributions of these analyses can be in economic agents’ decision-making process.
3.1.1 Methodologic bases for freight data identi…cation
Despite the availability of a wide range of di¤erent data in some …eld of opera-tional research, a signi…cant number of decision-makers are underinvesting in the level of analysis necessary for processing the data. Various statistical institutes produce data at a much faster stage that very few statisticians are truly able to manage and develop. The need to store such large amounts of data, implying the involvement of increasingly growing it, leads organizations to be overwhelmed with data and parallel to this, the usefulness of the data collapses. In 2008, the round table organized by the International Transport Forum and the OECD in Boston on the economic bene…ts of expanded transport (planning tools, macro, meso and micro-economic evaluations) revealed the gap between data available and imperfections of the analytical frameworks used to further prevent regular analysis in the context of empirical studies in economic geography.
In fact, one of the most striking features in the context of information analy-sis is that policymakers focus too much on the data control and not enough on the transformation of the latter into information and knowledge that will lead to statistical and economical signi…cant results. Literature addressing the issues of decision-making and use of information are multidisciplinary and cover top-ics such as economtop-ics, management, social sciences or information technology. Several subjects draw their own point of view5 (Kennerley and Mason, 2008).
Extracting quality information from data should be the main objective of each decision maker. The use of information to improve decision-making and opera-tional performance is a topic that receives considerable attention from academic and institutional actors. The process of decision-making on the basis of data should to be the easiest way to maximize the e¢ciency in the decision-making path.
This rational view of decision-making is implicit in a large majority of eco-nomics studies. The fundamental assumption in this rational approach is to assume that agents have reliable data to help to retrieve adequate information and knowledge to facilitate their decision making process. Basically, the conver-sion of data into information and then into knowledge is supposed to streamline the choices that are made. In line with these arguments and following the “cause to e¤ect” dogma, many statistical tools, based on recent technological advances allowing the conversion of data into meaningful information, have been developed. These tools and techniques are expected to improve the return on
5For instance, many literatures addressing the Information Systems (IS) focus on their own
investment made in collecting information.
However, for many researchers knowledge and decision are not only rational processes. Even if it appears important to consider the rational model, it may be useful to discuss the weaknesses of this rational view of decision-making by confronting it with alternative approaches. In general, the process of decision-making is not purely linear or typically sequential and more complex set of actions should be implemented in any procedural logic using data to help the decision makers to evaluate their choices. While relying on predictive models but away from the rationality assumption in socio-economic interactions, dif-ferent points of view examine the issue of bias and emotion in the economic agents decision-making process (Angeletos and La’o, 2009; Shiller, 2005; Sims, 2006). In a dynamic environment, it appears important to build models that can quickly be restructured to take into account changes in the system and improve the decision maker knowledge as generally, each step of the decisional corpus can be carried independently.
In order to know the type of data needed to provide a basis for decision-making, the main point that needs to be addressed remains the full and e¤ective availability of data regarding the considered problematic. Not only the type of data a¤ects the nature of the decision, but in many circumstances, the data may determine the time of the decision. In addition, the development of statistical techniques shows that the type and amount of data collected prede…ne the model that will be used to understand an entity or phenomenon about which a decision must be made.
3.1.2 Freight data choice, collection and analysis in the decision making process
In economic geography, variables such as tra¢cking of goods, storage areas of goods, the number of …rms in a sector, the location of these companies or their turnover are fundamental descriptive elements to understand the performance of a port-valley system. To build such a database, one has to collect the data from the various identi…ed sources. This collection stage can be divided into two steps; one will have to de…ne more speci…cally the problematic, type and/or volume of data to be collected, and the other focuses speci…cally on the mode of data collection itself.
contribu-lack of data will signi…cantly in‡uence the perspicacity of the information they are supposed to provide to the analyst/decision maker.
Once speci…ed, it seems important to consider the purpose of the analysis because the use of data is part of a proactive/predictive modeling framework in the e¢ciency of the decision-making process. The data should then enable the deployment of predictive abilities of the economic system in order to manage risk and promote e¤ective integration of changes, whether structural or cyclical, a¤ecting the system. This predictive ability of the model promotes a “robust” identi…cation of the states in which the economic system is waterproof/resistant to threats and disruptions/socio-economic crises faced by the decision-makers. The predictive model is thus asking a two-stage process. One is to browse the past with a view to consider the future on the basis of existing data. The other is to propose a regular update procedure of the model basics over time to over-come cognitive biases and inaccuracies. In this context, data covering a longest period and the periodic reviews of the models appear essential for assessing the organizational performance of an economic system. Many researchers have noted that the e¤ectiveness and the quality of the decision-making process are signi…cantly correlated with a provision of real-time data. Similarly, models of dynamic systems appear as powerful tools that help to identify the complexity of real economy activity and describe the scope of the decision.
After collecting the needed data produced through a process ensuring their reliability, the next stage is to trying to answer the question of what the data tell us. At this stage, based on existing statistics technics, freight data start to turn into information. The statistical analysis tools used can dissect data while providing clari…cations on the information contained therein. Finally, the data interpretation is a key step in the decision-making process. The aim is to convert freight data in intelligible terms so that they become information.
3.2
Ontological indicators of the system performance
The three analytical approaches considered in the empirical study of a port-valley system can lead to part of the main expectations that may be issued by regional, national and European public authorities in terms of territorial development policies. These approaches provide a strategic perspective that is to be able to boost the quality and contribution of the various economic spheres that composed a port-valley system. Moreover, this empirical study, divided into three parts, each corresponding to the speci…c modeling frameworks, should lead to the extraction of a group of indicators whose ontological intricacies and aggregation should result to the identi…cation of a measure of the port-valley’s overall performance (…gure 3).
These ontological indicators could be used as statistical support to the real-ization of an Information System both Geographic and Economic (ISGE) char-acteristic of the studied port-valley’s activities (industrial, transport, logistics, regulatory, ecological, etc.). To achieve the issues covered by such an empirical
study, it may be appropriate and essential to build a sub-regional network of professionals which can initiate processes of economic collaboration and territo-rial reorganization to achieve a synergistic e¢ciency between the industterrito-rial and logistical actors of the geoeconomic system.
Figure 3. De…ning a port-valley performance measure
the various empirical studies that will be implemented.
Map 1. The Northern range’s ports-valleys
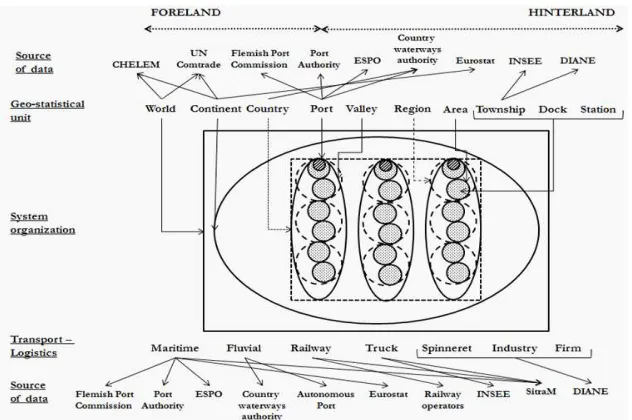
Figure 4. Elements of the MOBIS database
4
Conclusion
References
[1] Aglietta, M.: 2013, Réviser la gouvernance du capitalisme pour relancer la croissance des pays occidentaux,CEPII, Politique économique, Billet du
12 décembre 2013.
[2] Angeletos, G-M. and La’o, J.: 2013, Sentiments,Econometrica, Economet-ric Society, Vol. 81(2), pp. 739-779.
[3] Aronietis, R., Monteiro, F., Van de Voorde, E., Vergauwen, B. and Vanel-slander, T.: 2010, Les ports contemporains: développements compétitifs et stratégies des acteurs, Proceedings of le premier Colloque international sur les ports maghrébins: entre volonté et réalité, 2-3/02/2010, Bou-Ismail, Algeria.
[4] Bottasso, A., Conti, M., Ferrari, C., Merk, O. and Tei, A.: 2013, The impact of port throughput on local employment: Evidence from a panel of European regions,Transport Policy, Elsevier, Vol. 27(C), pp. 32-38. [5] Carrol, J. D.: 1968, A generalization of canonical correlation analysis to
three or more sets of variables, Proceeding of the 76th Convention of the
American Psychological Association: 3, 227-228.
[6] Chessel, D. and Hana…, M.: 1996, Analyses de la co-inertie de K nuages de points,Revue de Statistique Appliquée, Vol. 44, pp. 35-60.
[7] Coudun, C. and Gégout, JC.: 2006, The derivation of species response curves with Gaussian logistic regression is sensitive to sampling intensity and curve characteristics,Ecological modelling, Vol 199(2), pp. 164-175. [8] Dazy, F. and Le Barzic, J.F.: 1996, L’analyse des données évolutives,
méth-odes et applications, GERI, ed. Technip, Paris. 225 p.
[9] Debrie, J. and Guerrero, D.: 2008, Re-spatialiser la question portuaire : pour une lecture géographique des arrière-pays européens, in l’espace géographique, n. 1, 2008, tome 37, pp. 45-56.
[10] DevPort: 2013, Le passage portuaire : Approches interdisciplinaires des ‡ux de marchandises transitant par les ports,Rapport d’étude, Publications de l’Université du Havre, 92 p.
[11] Fleming, D.K. and Hayut, Y.: 1994, Spatial characteristics of transporta-tion hubs: centrality and intermediacy, Journal of Transport Geography, Vol. 2(1), pp. 3-18.
[13] Gbaguidi, D.: 2011, Expectations Impact on the E¤ectiveness of the In‡ation-Real Activity Trade-o¤, Theoretical and Practical Research in Economic Fields, ASERS Publishing, Vol. 0(2), pp. 141-182.
[14] Gold, S. and Seuring, S.: 2011, Supply chain and logistics issues of bio-energy production,Journal of Cleaner Production, Vol 19(1), 32-42. [15] Hamilton, J.: 1989, A New Approach to the Economic Analysis of
Non-stationaty Time Series and the Business Cycle,Econometrica, Vol. 57, pp. 357-84.
[16] Hamilton, J.: 1994, Rational Expectations and the Economic Consequences of Changes in Regime, in Macroeconometrics: Developments, Tensions, and Prospects, edited by Kevin D. Hoover, Boston: Kluwer Academic Pub-lishers, pp. 325-344.
[17] Hamilton, J.: 1995, State-Space Models,Handbook of Econometrics, Vol 4, edited by R. Engle and D. McFadden, North-Holland.
[18] Hayuth, Y.: 1987, Intermodality: Concept and Practice,London: Lloyd’s of London Press Ltd.
[19] IRSIT: 2004, Les villes portuaires en Europe: Analyse comparative,Étude
réalisée pour l’Institut de recherche en stratégie industrielle et territoriale.
[20] Kennerley, M. and Mason, S., 2008, The Use of Information in Decision Making: Literature Review for the Audit Commission,Centre for Business Performance, Cran…eld School of Management.
[21] Kettering, R.J.: 1971, Canonical analysis of several sets of variables, Bio-metrika, Vol. 58, pp. 433-451.
[22] Lavit, Ch.: 1988, Analyse conjointe de tableaux quantitatifs, Masson, Paris. 240 p.
[23] Lavit, Ch., Escou…er, Y., Sabatier, R. and Traissac, P., 1994, The ACT (STATIS method), Computational Statistics and Data Analysis, Vol. 18, pp. 97-119.
[24] Magala, M. and Sammons, A., 2008, A New Approach to Port Choice Modelling,Maritime Economics and Logistics, Vol. 10 (1-2), pp. 9-34. [25] Malchow, M. and Kanafani, A., 2001, A disaggregate analysis of factors
in‡uencing port selection,Maritime Policy & Management, Vol. 28(3), pp. 265-277.
[27] OCDE: 2010, Sea Port Infrastructure: Investment Spending,International Transport Forum, Paris.
[28] Otranto, E.: 2005, The multi-chain Markov switching model, Journal of Forecasting, John Wiley & Sons, Ltd., Vol. 24(7), pp. 523-537.
[29] Rodrigue, J.-P.: 1999, Globalization and the synchronization of transport terminals,Journal of Transport Geography, Vol. 7, pp. 255-261.
[30] Shiller, R. J.: 2005, Behavioral Economics and Institutional Innovation,
Cowles Foundation Discussion Papers 1499, Cowles Foundation for Re-search in Economics, Yale University.
[31] Sims, C. A.: 2006, Rational Inattention: Beyond the Linear-Quadratic Case, American Economic Review, American Economic Association, Vol. 96(2), pp. 158-163.
[32] Strale, M.: 2013, Une typologie empirique des plates-formes logistiques et de leurs activités,Revue d’Économie Régionale et Urbaine, Armand Colin, 264 p.
[33] Verny, J.: 2007, The importance of decoupling between freight transport and economic growth: the role of distances,European Journal of Transport
and Infrastructure Research, Vol. 7, pp. 113-128.