Munich Personal RePEc Archive
Technological progress with segmented
factor markets and welfare implications
for the urban poor
Mukherjee, Soumyatanu and Zafar, Sameen
University of Nottingham
April 2014
Online at
https://mpra.ub.uni-muenchen.de/55297/
Technological Progress with Segmented Factor Markets and
Welfare Implications for the Urban Poor
Soumyatanu Mukherjee*, Sameen Zafar**
*
CREDIT & GEP; Room B49, School of Economics, University of Nottingham, University Park, Nottingham NG7 2RD;Email:[email protected].
**
CREDIT; Room B51, School of Economics, University Of Nottingham, University Park, Nottingham NG7 2RD;Email:[email protected].
This Draft – April 2014
Abstract:
This analysis, in terms of a four-sector static general equilibrium framework, models the urban informal sector for a typical developing economy with labour market distortion in the form of unionised urban sector labour market and capital market segmentation between urban informal and formal credit markets. It has been highlighted in different literature that growth experience in the South Asian countries like India or Pakistan during liberalised regime have primarily been driven by the productivity take-off in the traded sectors. This theoretical analysis offers another attempt to predict the implications of technological progress in the traded formal sectors on informal wage, taking into consideration that real wage is a reasonable benchmark to measure the well-being of the economically marginalised people living under informal arrangements. The key model propositions are further exemplified by a sensitivity analysis using plausible ranges of parameter values for India. We also provide empirical evidence using data on twenty-seven Indian States (including one Union Territory) between 1989 and 2010 on informal wages, capital stocks in informal and formal zones and value-additions in the formal segment to substantiate the model prediction on informal wage depicted in our numerical exercise, which shows that the growth in informal wage could reasonably be linked to the productivity surge in the formal sectors, while greater capital accumulation in the informal units over the formal counterparts has further aggravated this upswing in informal wages.
Keywords:Poverty; Technological Progress; Informal Wage; General Equilibrium.
JEL Classifications:E26; F11; F16; J46; I32; O17.
Acknowledgments:
1. Introduction:
It is well-known that in a developing economy the ‘informal sector’ hosts a substantial part of the workforce in unregistered activities, primarily characterised by ease of entry and unregulated markets. As suggested by many authors (Agenor (1996), Schneider and Enste (2000) and the references therein) more than 70% of the workforce is engaged in the informal sectors of a less developed country (LDC). In South Asian countries like India and Pakistan a significant proportion (about 85% in non-agricultural activities in India for example) of the working population are engaged in the informal sectors1.
Here we define ‘informal’ sector as the unregulated sector where minimum wage laws are not maintained, pertaining to non-traded items in the economy, comprising of own-account enterprises as well as many subcontract firms producing various parts and semi-processed components for the parent formal sector firms. This definition allows us to focus on the economic conditions of the majority of the workforce in LDCs like India and Pakistan.
As shown in different papers (Chaudhuri 2001; Koizumi and Kopecky 1977, 1980; Findlay 1980) liberalising a developing economy may result in technological progress as a peer-effect (such as an inflow of foreign capital usually leads to transfer of technology from the foreign producers to the destination sector of the recipient country). Such productivity improvement can lead to rise in per capita income of the host country (Chaudhuri 2005; Mukherjee (in press)). In fact, the most important determinant of the boom in Indian growth during liberalised regime has primarily been the productivity improvement in the organised sectors (Kathuria et al. 2013, Guha-Khasnobis and Bari 2003; Marjit, 2005). Such a technological change should have some impact on informal activities, wages and employment. The way production is organised between the formal and informal segments should also be affected.
A large part of such employment opportunities is generated in the urban or semi-urban areas where majority of the workforce is economically marginalized. The social consequence of such overall rise in growth rate must be reflected on the quality of life of these poor people. While it is difficult to assess such an impact at the micro level and in terms of various indicators of poverty and human development, we feel that informal wage and employment are good indicators to link productivity improvement in the traded formal sectors and urban poverty, given that most of the urban workforce in a typical developing economy (such as India or Pakistan) are absorbed in this segment. Poor unskilled workers are not suffering from unemployment; but their problem is the abysmal wages offered to them which they often find insufficient to meet their minimum daily needs. Therefore as argued in Kar and Marjit (2009), Marjit and Kar (2009) and others we also think informal wage is the reasonable benchmark to measure the conditions of living of these poor people.
2. The Existing Literature and Major Research Gap:
1
The key hypothesis we want to analyse is how informal wage responds following a productivity take-off in the formal/organised sectors of the economy. Goldberg and Pavcnik (2003) and Marjit, Ghosh and Biswas (2006) etc. have explored the asymmetric impact of reform policies on the size of the informal sector. However LDCs like India and Pakistan are also plagued by capital market segmentation among the organised formal and non-organised informal sectors. It has been shown theoretically (Marjit 2003; Marjit and Kar 2004; Marjit, Kar and Acharyya 2007; Marjit, Kar and Beladi 2007; Marjit and Kar 2008 a, b; Marjit Kar and Maity 2008) that informal wage can change depending on various degrees of capital mobility between formal and informal sectors. These studies use simple general equilibrium structure to answer a critical question – how do exogenous policy changes in the formal sector affect the wage and employment conditions in the informal sector? Marjit and Kar (2009) assessed the implication of a tariff-cut in the organised formal sector on informal wages, bringing the notion of different degrees of capital mobility between informal and formal segments of the economy and how they affect the outcome on informal wage. However while that paper attempted to check trade policy induced relative price effects on real informal wage, the current paper highlights the productivity issue explicitly.
It should be mentioned that Marjit and Kar (2008) explored the link between labour productivity growth and informal wage, emphasising the role of capital mobility between formal and informal segments of the economy. However it has been illustrated in different literature that informal sector firms are attached to the formal sector firms on a contractual basis, where the formal sector firms are generally farming out a part or whole of their production to the informal sector firms to avoid different regulations and associated costs since the latter firms enjoy the advantage of cheaper labour supply, while the informal firms are also dependent on formal firms for marketing their products and in particular for the supply of credit from the formal sector firms since the formal firms, most often have an advantage over the informal firms in the credit market. So it would be unrealistic to assume like Marjit and Kar (2008, 2009) that the informal sector produces internationally traded final good and capital is sector-specific, and thus the informal and formal credit markets are completely disintegrated even in the short-run. This is because the informal sector money-lender borrows capital from the formal credit market for re-lending. So a part of the formal credit enters into the informal credit market. Therefore the ‘zero mobility’ case in Marjit and Kar (2008, 2009) paper is unlikely to happen in reality.
show that technological progress leads to opposite wage movement independent of relative factor-intensity ranking between organised (formal) and non-organised (informal) labour sectors. But the simple two-sector set-up in Beladi et al. (2012) was not quite generic to portray the conditions of urban informal sector in a developing economy. It would be more realistic to classify the urban informal sector as comprising of an industrial segment that uses labour and capital to provide an intermediate input such as leather and rubber products, electrical equipment etc. to the formal sector firm, being tied to the formal firm by the system of subcontracting; another part can be treated as the informal service sector producing non-traded services such as street-vendors with almost no use of capital. These possibilities have been considered in Kar and Marjit (2009) and we have adopted this set-up as we believe their production-structure is quite generic and plausible to map the urban informal sector for a poor developing economy. However Kar and Marjit (2009) did not consider any dualism in domestic capital market. The dominant feature of dualism in the capital market is the fragmented interest rate structure, featuring lower allocation of loanable capital to the informal sector at a higher relative rental rate. The informal producers do not have access to credit from formal institutions and, therefore, have to depend on the informal credit market, where rental cost of capital is exorbitantly high. We are going to incorporate this issue in our model and hence this will become our point of departure from Kar and Marjit (2009).
3. The Model:
Consider a static general equilibrium model for a small, open developing economy with four sectors: two urban formal sectors and two urban informal sectors. Among the two informal sectors, one is an informal service sector (sector 1) providing non-traded services by the unskilled (surplus) labour of the economy. Another sector (sector 2) is within the industrial set-up, producing a non-traded intermediate input using unskilled labour and capital for the formal export sector. Within the formal segment, the export sector (sector 3) uses skilled labour2, capital and the intermediate input in the production process. Skilled wages are pegged at a higher level by prior negotiations with labour unions through collective bargaining3. Sector 4 is the tariff-protected import-competing sector of the economy using skilled-labour and capital in its production process. Now countries like India and Pakistan export primary agricultural products and also of high-skill products like computer software (particularly India); while they are the net importers of relatively more capital-intensive but less skill-intensive manufacturing products. Therefore we assume that sector 4 is the most capital-intensive sector in the economy. In the Heckscher-Ohlin-Subsystem (HOSS) formed
2
Here by ‘skilled’ we do not mean only human capital. In fact the labourers in the formal sectors are distinguished from the informal sector workers in terms of productivity. So by ‘skilled labour’ we mean the combination of wage-earners, mangers, supervisors and clerical job-performers in the organised sector. And by ‘skilled wage’ we mean total wages and salaries paid to them, which includes the payments to the managers and supervisors.
3
by the two formal sectors, sector 4 is relatively capital-intensive compared to sector 3 in physical and value terms.
The following notation is used:
W= competitive informal wage rate for unskilled labour (ܮത);
ܹௌ∗= Unionised skilled wage rate in formal segment of the economy;
ܴ =rate of interest in the informal credit market;
ݎ=rate of interest in the formal credit market;
ܽ= amount of the݆thfactor used to produce 1 unit of the݅thgood(݆= ܮ,ܵ,ܭ;݅= 1,2,3,4);
ܽଶଷ =per-unit requirement of the non-traded intermediate input in the export sector;
ܭഥ=total stock of capital in the economy;
ܵ̅= stock of skilled labour in the economy;
ܭଵ =available capital in informal sector;
ܲ =domestic prices of non-traded goods(݅= 1,2);
ܲ∗ =internationally given prices of traded goods(݅= 3,4);
ݐ= ad-valorem rate of tariff imposed on good 4.
ߠ =cost-share of factor݆in the production of good݅;
ߣ =share of sector݅in the total employment of factor݆;
∧= proportional change.
Price-unit cost equality in competitive product markets entail:
ܹܽଵ =ܲଵ (1)
ܹܽଶ+ܴܽଶ =ܲଶ (2)
ܹௌ∗ܽௌଷ+ݎܽଷ+ܲଶܽଶଷ =ܲଷ∗ (3)
ܹௌ∗ܽௌସ+ݎܽସ =ܲସ∗(1 +ݐ) (4)
We assume the following functional relationship betweenܴandݎ:
Here ߩ denotes the degree of imperfection of the informal credit market;ߩ> 1implies that
ܴ >ݎ. This is because the informal moneylenders generally borrow funds from the formal sector at the market rate of return ݎ, re-lend it to the informal borrowers and by this way maximises net interest income4. Therefore it is realistic to assume that informal interest rate is positively related to and steeply higher than the formal interest rate. The lower the number of alternative sources of credit to the borrowers in the informal sector, the higher is the degree of imperfection in the informal credit market and thereby the power of the informal sector lenders to mark up interest rate in the informal credit market over the one in formal capital market (i.e., greater value ofߩ).
Using (5), Equation (2) can be written as
ܹܽଶ+ߩݎܽଶ=ܲଶ (2.1)
Equations (1), (2.1), (3), (4) are the price-unit cost equality conditions for the informal service sector, intermediate input producing sector, the export (formal) sector and the import-competing manufacturing sector, which is relatively capital intensive compared to the vertically integrated export sector.
We also assume that amount of credit allocated to the informal sector is a positive function of the return differential between the two capital markets. Therefore as long asߩ > 1,informal capital market exists and thus the dichotomy between the two credit markets exists.
ܭଵ =ܭଵ(ܴ−ݎ) =ܭଵ{ݎ(ߩ− 1)}. So when (ܴ−ݎ) ≥ 0,ܭଵᇱ(. ) ≥ 0. (6)
So full utilisation of informal credit implies:
ܽଶܺଶ = ܭଵ{ݎ(ߩ− 1)} (7)
The two urban formal sectors use the formal credit. The equilibrium in the formal credit market ensures that5
ܽଷܺଷ+ܽସܺସ =ܭഥ−ܭଵ{ݎ(ߩ− 1)} (8)
The full employment of unskilled labour implies:
ܽଵܺଵ+ܽଶܺଶ = ܮത (9)
The full employment condition for skilled labour implies
ܽௌଷܺଷ+ܽௌସܺସ = ܵ̅ (10)
The demand-supply equality condition for the non-traded input gives:
ܽଶଷܺଷ =ܺଶ (11)
4
Soݎcould also be interpreted as the opportunity cost of lending credit to the moneylender.
5
Also we assume that per-unit requirement of the intermediate input in sector 3 is constant. It rules out the possibility of substitution between the non-traded intermediary and other factors of production in sector 3. This is not totally unrealistic assumption. For example, one pair of shoes produced in the informal sector does not change in quantity when it is marketed by the formal sector as a final commodity. Thus there remains a fixed proportion between the use of the intermediate input and the quantity of the final commodity produced and marketed by the formal sector. Gupta (1994), Chaudhuri (2005), Chaudhuri et al. (2006) have used this assumption.
The four price variables can be solved in the following way:ݎ is determined from Equation (4) given the unionised skilled wage and exogenous price of the importable. Givenݎ,one can determine ܲଶ from Equation (3) and given the policy-parameter ߩ, substituting ݎ and ܲଶ in Equation (2.1) one can obtainܹ.Finally from Equation (1)ܲଵ is found substitutingܹ.Once factor prices are known, factor-coefficients ܽs are also known. Now using the value of
ݎand givenߩ,we can findܭଵ(. )from Equation (6). Then simultaneously solving Equations (8) and (10) we get ܺଷ and ܺସ. Then ܺଶ is solved from Equation (11)6. Substituting ܺଶ in Equation (9),ܺଵ will be solved.
4. Comparative Static Exercises7.
First let us assume the productivity parameters are such that only sector 4 (the import-competing and relatively capital-intensive segment of the formal zone) experiences technological progress by ߙ> 0. Then the implication on informal workers can be summarised in the following proposition.
Proposition 1:
In the absence of any reform in the informal credit market, a productivity take-off in the relatively capital-intensive import-competing formal segment unambiguously reduces commodity prices and wages in both informal sectors. The informal sector producing intermediate input for the export sector is more likely to contract in terms of both output and employment; whereas the non-traded service sector is more likely to expand. However if government would intervene to undertake a reform policy which would reduce the mark-up power of the informal money-lenders, that could help the workers in intermediate input
producing sector.
Intuitive Explanation: If the relatively capital-intensive import-competing formal segment (sector 4) undergoes technological progress (uniform or factor-specific) by ߙ > 0, it will raise only the rental to capital (given the fixed skilled wage); given that the production
6
Note that Equation (7) is not an independent equation.
7
functions in these two sectors are of variable-coefficient type, this will encourage a Rybczynski-type effect in the Heckscher-Ohlin Subsystem (HOSS) formed by sector 3 and sector 4 following which the relatively capital-intensive sector 4 expands but the export sector (sector 3) contracts. So the demand for non-traded intermediate input falls given supply. This will shrink the price of the intermediate input(ܲଶ);whereas rental costs paid by the informal producers rise. As a result from the zero-profit condition of sector 2 (the intermediate input producing sector), it is clear that competitive unskilled wage rate should fall. At the same time, since intermediate input is used in a fixed proportion in the export sector production, which cannot be supplemented by other factors of production in sector 3, this implies that sector 2 must shrink as well (complementary relationship between this two sectors). Hence sector 2 will release unskilled labour which will be absorbed in sector 1, but at a lower competitive wage than before. We call it the ‘first round’ effect.
However asݎrises(ܴ−ݎ) =ݎ(ߩ− 1)goes up as well. This will lower the supply of capital to the formal capital market. This will induce a Rybczynski effect in the HOSS which would tend to expand sector 3 and sector 2 (by complementarity assumption explained above) and we call it as ‘second round’ effect. But this ‘second round’ effect is entirely the by-product of the ‘first round’ effect. Therefore the ‘first round’ effect would likely to dominate and both sector 3 and sector 2 would likely contract as a consequence.
In fact, it can readily be seen from our framework that if government would intervene aiming to reduce the degree of imperfection in informal credit market and hence the informal rental return (by reducing ߩ) in this scenario, that would tend to reduce the capital-cost of intermediate input producers and thus would help the workers in sector 2. But in the absence of any such reform, rental cost of intermediate input producers would always rise unambiguously following technological improvement in sector 4. As a result some of the industries in sector 2 would shut down and the rest will try to survive using less capital-labour ratios in per-unit of production. This implies that only those unskilled workers who are relatively more productive will remain in sector 2 and the rest will join sector 1. This is welfare reducing from various points:
a) The downward pressure on wages of informal workers has clear impact on aggravating poverty in the urban area. This is because a large share (above 78%) of the urban poor in India and Pakistan works in the informal sector and any reduction in the wages of the informal workers may increase significantly on the incidence of poverty.
b) Sector 2 contracts in terms of both output and employment; so workers are forced to leave the unregulated manufacturing firms and take up insecure non-traded service sector jobs with lower earnings and hence greater likelihood of poverty.
When only the export sector undergoes technological progress by ߙ > 0, following proposition is imminent from our model.
If only the export sector would undergo productivity improvement byߙ> 0,ceteris paribus, product prices and competitive real wages of the informal workers will go up in both informal sectors. Also the intermediate input producing sector would expand in terms of both output and employment. A government policy of capital-market reform in the informal sector
would encourage this wage-improvement even more in this scenario.
Intuitive Argument: Since now return to capital in the formal sector, ݎ, is already determined from the zero-profit condition for sector 4; the technological progress in sector 3 would lead to an increase in price of the intermediate input. So from the zero-profit condition of sector 2 it is imminent that the real informal wage would increase. Now producers in the intermediate input producing sector will substitute capital for the costlier labour in the production. Given the endowment of capital in the economy, this will create relative shortage in capital-availability and therefore a subsequent ‘Rybczynski-type’ effect in the HOSS. Under our reasonable assumption that sector 4 is relatively more capital-intensive than sector 3 in physical and value terms, sector 4 will contract while sector 3 will expand and given the complementary relationship between sector 3 and sector 2, sector 2 will expand as well. As a result unskilled labourers will move from sector 1 to sector 2 and sector 2 will expand both in terms of output and employment.
Now a government policy to reform the informal credit market would reduce
ܴby reducingߩ.From the zero-profit condition for the intermediate input producing sector, it is clear that it will pronounce the informal wage increase even more.
4.1 Uniform Technological Progress by ࢻ> in All Traded Sectors and Informal Wage Response – A Sensitivity Analysis for India.
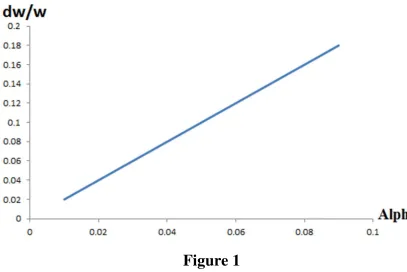
Now we examine implication of a uniform technological progress by ߙ in both export and import-competing formal sectors on the informal wage (not taking into account any government policy of credit market reform in the informal sector). So each of the two formal sectors undergo uniform technological improvement by ߙ. We will show this using a sensitivity analysis for India. Totally differentiating Equations (1), (2.1), (3) and (4); applying envelope conditions and using Cramer’s rule, allowing for both sectors 3 and 4 to undergo productivity improvement byߙ > 0the key equation of change will become:
ܹ = ఈ
ఏమయఏಽమቄ1 −
(ఏ಼యାఏ಼మఏమయ)
ఏ಼ర ቅ (12)
We use Equation (12) to quantify the relationship between productivity change in the formal segment and changes in informal wage. We assign the following parameter values for the initial equilibrium according to the assumptions in the model in a close approximation to the actual data for India8.
ߠଶ = 0.3;ߠଷ= 0.4;ߠଶଷ = 0.1(fixed);ߠସ = 0.5.
8
Figure 1
Note that the relationship between technological progress in the formal sectors and change in informal wage is positive. So given the parameter values we have adopted for initial equilibrium, when the formal segment of the economy (i.e., both sectors 3 and 4 in our model) undergoes technological improvement by 5% or 8% the model predicts that informal wage would increase by about 10% and 16% respectively.
This is because in our model when both formal sectors experience uniform technological
progress by α>0, the relatively capital-intensive sector 4 would demand more capital to
expand which would push up the return to capital in both informal and formal sectors which would lead to the ‘first round effect’ mentioned before. At the same time the relatively capital un-intensive sector 3 is also experiencing technological progress and they would expand by saving on capital cost and demanding more of the non-traded intermediary from sector 2. In this scenario when capital accumulation in the informal sectors rise in the ‘second-round effect’, it would further help to expand both sector 3 and sector 2, nullifying the ‘first round effect’. Sector 2, would only expand by substituting labour for capital, which would increase the demand for informal workers in sector 2 and the informal wage. This positive impact on informal wage depends crucially on how much sector 3 has been able to save on its capital costs of production. As we will show in our numerical analysis in Table 1, a small decrease in capital cost share in sector 3 would increase the growth in informal wage. Therefore lower capital availability in the formal segment vis-à-vis the informal sectors should be crucial for the upsurge of informal wage in response to uniform technological progress by equal percentage in all the traded formal sectors of the economy. This fact is further supported in our empirical section.
adopt ߙ= 0.08 in case of India (Kathuria et al. 2013). As expected, if the cost share of capital in the export sector goes down just by 7.5% from the initial equilibrium value, the informal wage rises by 23% whereas in initial equilibrium, the increase in informal wage was about 16%. If cost share of capital in sector 4 goes up by 10%, then the subsequent Rybczynski-type effect in the HOSS will benefit the informal workers in terms of wages and employment.
Table 1 – Effect ofࢻ =.ૡunder Parametric Assumptions
Simulation Rounds
ߠଶ
= 1−ߠଶ
ߠଷ ߠସ ߠଶଷ(fixed) ܹ
Sim1 (Initial Equilibrium)
0.3 0.4 0.5 0.1 0.16
Sim 2 0.3 0.37 (↓) 0.5 0.1 0.23 (↑)
Sim 3 0.3 0.4 0.55(↑) 0.1 0.25 (↑)
5. Empirical Evidence for India:
In this section we are going to provide some evidence from the liberalisation experience in India. For informal units, there exist surveys conducted by ‘National Sample Survey Organization’ (NSSO), Government of India. In particular, given our concerns in this paper, we have used data from various rounds of this survey on average yearly wage and fixed assets formation in Non-Directory Manufacturing Enterprises (NDMEs) in the urban sector, because of their strong interlinkages with urban formal sectors for 1989-90, 1994-95, 2000-01 and 22000-010-11 across twenty-six Indian States and one union territory (Chandigarh). For the formal units, we have taken data on formal sector net value added and net capital accumulation on these years for these twenty-seven cross-sectional units from Annual Survey of Industries (ASI), Government of India. The informal sector real wages have been constructed by deflating the nominal wages using 2001-02 Consumer Price Index; the informal real fixed assets (proxy for capital accumulation in the informal sector) and the real capital accumulation in the formal sectors have been formed by deflating the nominal figures using 2001-02 Wholesale Price Indices (WPI) for Machinery and Machine Products; while the formal sector real value-added (VA) has been constructed by deflating the nominal figures using 2001-02 WPI for Manufactured products.
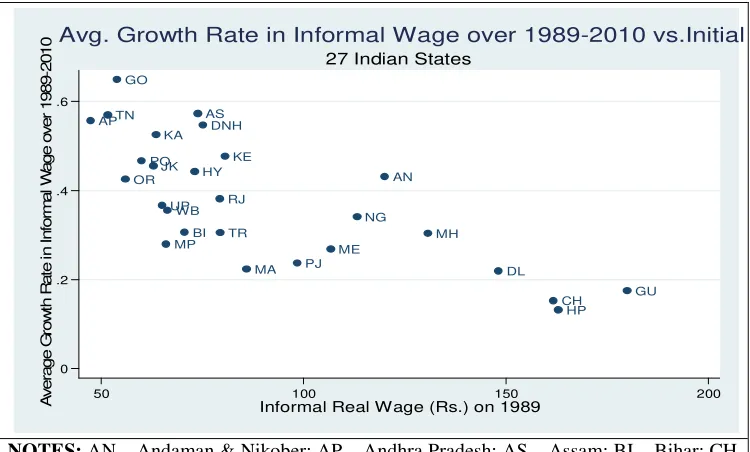
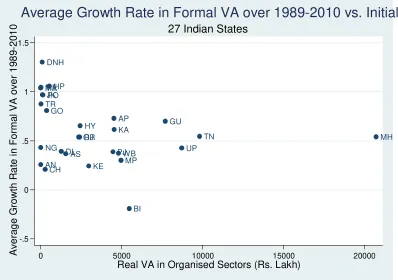
It is clearly seen from our data that average growth rates of real wages in the NDMEs over 1989-20109have been fairly positive for all twenty-seven cross-sectional units (Figure A1 in Appendix II). Real VA in the formal sectors has exhibited positive trends (see Figure A2 in Appendix II) in almost all Indian States (except Bihar), including the U.T. Chandigarh, during this period. Interestingly, relative capital accumulation in the informal sector (i.e., real
9
FA formation in NDMEs) vis-à-vis that in the formal units also exhibited positive average growth rates (Figure A3 in Appendix II) over this period for almost all States. Table A1-A2 (Appendix II) offers detailed descriptive statistics for the variables under consideration10. According to the relationship suggested by our theoretical model depicted in Figure 1 of the main text, it is possible for the informal wages to rise when there is growth in the formal segment following uniform technological progress, while a rise in fixed assets formation in informal sectors over the formal segment should expedite the growth in informal wage. To test this hypothesis we use panel fixed effects (FE) model to take into consideration the possible State-specific effects, where our dependent variable is the real informal wage (ݓ)
and the regressors are formal VA (ݒܽ) and difference in real fixed assets formation (equivalent to capital accumulation) in informal vis-à-vis formal sectors (݂݇݅݇); where all varibles are expressed in logarithms. After the so-called ‘within transformation’, the model looks like:
(ݓ௧−ݓതതതప) =ߚଵ(ݒܽ௧ −ݒܽതതതതప) +ߚଶ(݂݇݅݇௧−݇ଓ݂݇തതതതതതప) + (߳௧−߳ഥప) (13)
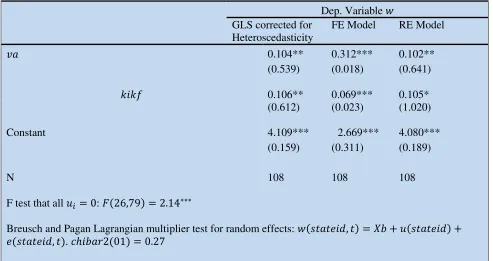
We present the results for Generalised Least Squares (GLS) model (heteroscedasticity corrected), Random Effectes (RE) model and the Fixed Effects (FE) model in Table 2.
10
Table 2 – Regression Results
The Breusch and Pagan Lagrangian multiplier test for random effects certainly suggests that there are no random effects and therefore our heteroscedasticity corrected GLS would have been preferred in this case. However it is evident from the F-test that the twenty-six dummies (implicitly used) are jointly significant at 1% which of course directs us to switch to FE model from the GLS one. We have also used the robust version of Hausman test (which takes ‘cluster-robust’ standard errors) and found that the ‘Sargan-Hansen statistic’ is significant at 1% level; which confirms our selection of the FE model over the RE model. Also it is evident from Table A4 that the estimated elasticities are more precise in FE model compared to the other two models. Now in our FE regression, we have found that both the estimated elasticities are positive and statistically significant at 1% level. Results suggest a 1% growth in formal VA is associated with a 0.3% increase in real wage in the urban NDMEs over 1989-2010, while a 1% growth in real capital accumulation in informal units vis-à-vis formal zones is associated with a 0.07% increase in informal real wage. The growth in value-added in the organized sectors and in real fixed assets formation in the urban NDMEs over the real capital accumulation in the organized segment of the Indian States have been our empirical approximations in this context. This supports the relationship suggested by our model in Figure 1 which predicts that if all the traded formal sectors undergo uniform productivity improvement by equal percentage amount, then informal real wage could increase, provided substantial amount of capital is also re-allocated from the formal segment to the informal units.
Dep. Variableݓ GLS corrected for
Heteroscedasticity
FE Model RE Model
ݒܽ 0.104** 0.312*** 0.102**
(0.539) (0.018) (0.641)
݂݇݅݇ 0.106** 0.069*** 0.105*
(0.612) (0.023) (1.020)
Constant 4.109*** 2.669*** 4.080***
(0.159) (0.311) (0.189)
N 108 108 108
F test that allݑ = 0:ܨ(26,79) = 2.14∗∗∗
Breusch and Pagan Lagrangian multiplier test for random effects:ݓ(ݏݐܽݐ݁݅݀,ݐ) =ܾܺ+ݑ(ݏݐܽݐ݁݅݀) +
݁(ݏݐܽݐ݁݅݀,ݐ).ܿℎܾ݅ܽݎ2(01) = 0.27
Hausman Test: Sargan-Hansen statistic = 20.195***
6. Concluding Remarks:
It is quite well-established that recent growth in Indian economy is fuelled primarily by upsurge in productivity in the traded sectors which has been quite substantial over the recent years. Given that informal activities comprising the majority of the urban workforce who are economically marginalized, we investigate: how a technological progress in the traded sectors of the economy would affect the informal wage with segmentation in factor markets? In our simple general equilibrium model in the traded formal sectors wages are pegged at a higher level than the competitive wages by prior negotiations with labour unions; while dualism in the capital market is characterised by the fragmented interest rate structure, featuring lower allocation of loanable capital to the informal sector at a higher relative rental rate. We have provided a sensitivity analysis of our model using plausible ranges of parameter values for India and also provided empirical evidence from Indian data across twenty-seven States (including one U.T.) over 1989-2010. Our sensitivity analysis supports the fact that a uniform productivity take-off by equal percentage in all the traded formal/organised sectors could potentially help the informal workers if the vertically integrated export sector could save more on their capital cost of production; in other words, less capital will be allocated in the formal segment of the economy vis-à-vis the informal units, which has also received support in our empirical section. We have addressed the crucial policy-question whether and under what economic conditions the benefit of productivity improvement in the traded sectors would trickle down to the marginalised workforce of urban area living in so-called ‘informal sectors’ through the impact on their real wages and employment conditions.
References:
1. Agenor, P.R. (1996), ‘The Labor Market and Economic Adjustment’, IMF Staff
Papers32, pp. 261 – 335.
2. Beladi, Hamid, Chaudhuri, Sarbajit and Yabuuchi, Shigemi (2008), ‘Can International Factor Mobility Reduce Wage Inequality in a Dual Economy?’ Review of
International Economics16, pp. 893 – 903.
3. Beladi, Hamid, Vina, Lynda De la and Marjit, Sugata (2012), ‘Technological Progress with Segmented Labor Markets’,Review of Development Economics16(1), pp. 148 – 152.
4. Chaudhuri, S. (2003), ‘How and how far to liberalize a developing economy with informal sector and factor market distortions’,J. Int. Trade & Economic Development
12(4), pp. 403-428.
5. Chaudhuri, S. (2005), ‘Labour Market Distortion, Technology Transfer and Gainful Effects of Foreign Capital’,The Manchester School73(2), pp. 214–227.
7. Ethier, Wilfred J. (2005), ‘Globalization, globalisation: Trade, technology, and wages’,International Review of Economics & Finance14(3), pp. 237–258.
8. Findlay, R. (1978), ‘Relative Backwardness, Direct Foreign Investment and the Transfer of Technology: a Simple Dynamic Model’,Quarterly Journal of Economics
92, pp. 1–16.
9. Findlay, Ronald and Jones, Ronald W. (2000), ‘Factor Bias and Technical Progress’,
Economics Letters68, pp. 303 – 308.
10. Goldberg, P and N Pavcnik (2003): ‘The Response of the Informal Sector to Trade Liberalisation’,Journal of Development Economics72(2), pp. 463–496.
11. Guha-Khasnobis, B. and Faisal Bari (2003), ‘Sources of Growth in South Asian Countries’ in Isher Judge Ahluwalia and John Williamson (Eds.), The South Asian
Experience with Growth, Oxford University Press.
12. Gupta, M. R. (1994) ‘Duty-Free Zone, Unemployment and Welfare: a Note’,Journal
of Economics59, pp. 217–236.
13. Jones, Ronald W. (1965), ‘The Structure of Simple General Equilibrium Models’,
Journal of Political Economy73, pp. 551 – 572.
14. Jones, Ronald W. (1971), ‘A Three-factor Model in Theory, Trade and History’, in Bhagwati, J., et al. (eds.), Trade, Balance of Payments and Growth, North-Holland, Amsterdam.
15. Jones, Ronald W. (1996), ‘International Trade, Real Wages and Technical Progress: The Specific-factors Model’, International Review of Economics and Finance 5, pp. 113 – 124.
16. Jones, Ronald W. (2003), ‘Joint Outputs and Real Wage Rates’, International Review
of Economics and Finance12, pp. 513 – 516.
17. Jones, Ronald W. (2006), ‘‘Protection and Real Wages’: The History of an Idea’,
Japanese Economic Review57, pp. 457 – 466.
18.Kar, S. and Marjit, Sugata (2009), ‘Urban Informal Sector and Poverty’, International Review of Economics and Finance18, pp. 631–642.
19. Kathuria, Vinish, Rajesh S.N. Raj and Kunal Sen (2012), ‘Productivity Measurement in Indian Manufacturing: A Comparison of Alternative Methods’ Journal of
Quantitative Economics11 (No.s 1 & 2).
20. Kathuria, Vinish, Rajesh S.N. Raj and Kunal Sen (2013), ‘The effects of economic reforms on manufacturing dualism: Evidence from India’ Journal of Comparative
Economics41, pp. 1240–1262.
21. Koizumi, T. and Kopecky, K. J. (1977), ‘Economic Growth, Capital Movements and the International Transfer of Technical Knowledge’, Journal of International
Economics7, pp. 45–65.
22. Koizumi, T. and Kopecky, K. J. (1980), ‘Foreign direct investment, technology transfer and domestic employment effects’, Journal of International Economics 10, pp. 1–20.
23. Krugman, Paul R. (2000), ‘Technology, trade and factor prices’, Journal of
International Economics50, pp. 51 – 71.
25. Marjit, S. and S. Kar (2004), ‘Pro-Market Reform and Informal Wage: Theory and the Contemporary Indian Perspective’,India Macroeconomics Annual 2004-05, pp. 130-156.
26. Marjit, S, S Kar and H Beladi (2007), ‘Trade Reform and Informal Wages’,Review of
Development Economics11(2), pp. 313-320.
27. Marjit, S., Kar, S. and R Acharyaa (2007): ‘Agricultural Prospects and Informal Wage in General Equilibrium’,Economic Modelling, 24(3), pp. 380-385.
28. Marjit, S., and Kar, S. (2008), ‘Labor Productivity Growth, Informal Wage and Capital Mobility – A General Equilibrium Analysis’, in Ravi Kanbur and Jan Svejnar (Eds.)Labour Markets and Economic Development, NY: Routledge, 2008.
29. Marjit, S., and Kar, S. (2008), ‘Productivity and Wage in the Informal Sector’ in
Footprints of Development and Change:Ch 5(V K R V Rao Centenary Volume), New
Delhi: AF.
30. Marjit, S., Kar, S. and D. Maity (2008), ‘Labour Market Reform and Poverty – The Role of Informal Sector’ in Bhaskar Dutta (ed.), Issues in Development (NY: World Scientific Press).
31. Marjit, S., and Kar, S. (2009), ‘A Contemporary Perspective on the Informal Labour Market: Theory, Policy and the Indian Experience’, Economic and Political Weekly
Vol. XLIV, No. 14, pp. 60 – 71.
32. Mukherjee, Soumyatanu (2012), ‘Revisiting the Apparent Paradox: Foreign Capital Inflow, Welfare Amelioration and ‘Jobless Growth’ with Agricultural Dualism and Non-traded Intermediate Input’;Journal of Economic Integration, 27(1), pp. 123-133. 33. Mukherjee, Soumyatanu (2014), ‘Liberalization and ‘Jobless Growth’ in Developing Economy – Some Extended Results’;Journal of Economic Integration(forthcoming). 34. Norback, Pehr-Johan (2001), ‘Cumulative effects of labor market distortions in a
developing country’,Journal of Development Economics65(1), pp. 135-152.
35. Schneider, F. and Enste, D.H. (2000), ‘Shadow Economies: Size, Causes, and Consequences’,Journal of Economic Literature38, pp. 77 – 114.
Appendix II
NOTES:AN – Andaman & Nikober; AP – Andhra Pradesh; AS – Assam; BI – Bihar; CH – Chandigarh; DL – Delhi; DNH – Dadra-Nagar-Haveli; GO – Goa; GU – Gujrat; HP – Himachal Pradesh; HY – Haryana; JK – Jammu & Kashmir; KA – Karnataka; KE – Kerala; MA – Manipur; ME – Meghalaya; MH – Maharashtra; MP – Madhya Pradesh; NG – Nagaland; OR – Orissa; PJ – Punjab; PO – Pondicherry; RJ – Rajasthan; TN – Tamil Nadu; TR – Tripura; UP – Uttar Pradesh; WB – West Bengal.
Figure A2 AP AS BI GO GU HY HP JK KA KE MP MH MA ME NG OR PJ RJ TN TR UPWB AN CH DNH DL PO 0 .2 .4 .6 A v e ra g e G ro w th R a te in In fo rm a l W a g e o v e r 1 9 8 9 -2 0 1 0
50 100 150 200
Informal Real Wage (Rs.) on 1989 27 Indian States
Figure A3 Descriptive Statistics: AP AS BI GO GU HY HP JK KA KE MP MH MA ME NG OR PJ RJ TN TR UP WB AN CH DNH DL PO -.5 0 .5 1 1.5 A v e ra g e G ro w th R a te in F o rm a l V A o v e r 1 9 8 9 -2 0 1 0
0 5000 10000 15000 20000
Real VA in Organised Sectors (Rs. Lakh)
27 Indian States
Average Growth Rate in Formal VA over 1989-2010 vs. Initial
AP AS BI GO GU HY HP JK KA KE MP MH MA ME NG OR PJ RJ TN TR UP WB AN CH DNH DL PO -.5 0 .5 1 1.5 A v e ra g e R a te o f C h a n g e in R e la ti v e K A o v e r 1 9 8 9 -2 0 1 0
-200 0 200 400 600
Relative KA Informal Vs. Formal 1989 (Rs. Lakh)
27 Indian States
Table A1:
Year Obs. Log (real informal wage)
Log(formal VA) Log (KA inf – KA formal)
mean std mean std mean std
1989 27 4.43 0.38 6.50 2.66 1.70 2.77
1994 27 4.99 0.24 6.89 2.64 0.15 3.07
2000 27 5.27 0.20 6.98 2.67 4.15 3.04
[image:20.595.72.501.80.193.2]2010 27 5.56 0.28 8.29 2.42 2.77 2.96
Table A2: No. of Observations
Variables Avg. Growth Rate in
Informal RW (%) over 1989-2010
Avg. Growth Rate in Formal VA over
1989-2010 (%)
Avg. Growth in Relative KA, Informal Vs. Formal, 1989-2010
(%)
Mean S.E. Mean S.E. Mean S.E.