Open Journal of Geology, 2017, 7, 374-394 http://www.scirp.org/journal/ojg
ISSN Online: 2161-7589 ISSN Print: 2161-7570
Geochemistry of Host and Altered Rocks in the
Nahran Area, Tarom Zone (NW Iran):
Implication for Determining of Mineralization
Processes in the Alteration Environment
Nasrin Bayrami Tosanloo
1, Hamid Reza Peyrowan
2*, Seyed Jamal Sheikhzakariee
1,
Ali Reza Jafari Rad
11Department of Geology, Science and Research Branch, Islamic Azad University, Tehran, Iran 2Soil Conservation and Watershed Management Research Institute, Tehran, Iran
Abstract
The Nahran area is located in the Northeast of Zanjan in the Northwest of Iran. This area with 20,000 km2 is part of the Tarom volcanic-plutonic zone which
lies between the longitudes 49˚7'7.8"E and 36˚41'25.74"E near to the Nahran vil-lage. The Nahran altered zone is part of large-scale syncline, which is oriented from Sirdan to Altinkosh with an axial length of 9 km. A systematic study of petrographical and geochemical data of Nahran samples reveals they are ande- site, trachyandesite to dacite composition and have metaluminous to peralumi- nous and calc-alkaline affinity. Four alteration zones of propylitic, medium and advanced argillic and silicific zones could be identified in the area. According to our finding, combination of both supergene and hypogene process has an effective role in the development of alteration in the Nahran alteration zone.
Keywords
Tarom, Nahran, Alteration, Hypogene, Supergene
1. Introduction
The Tarom Mountains, which cover most of the Zanjan quadrangle, are western extention of central Alborz Mountain. According to structural divisions of Iran proposed by Nabavi (1976), this area is part of western Alborz structural zone (Alborz-Azerbaijan zone) [1]. The Nahran alteration zone is located approximate-ly 100 km northeast of the city Zanjan and covers 20,000 km2 area within the
Ta-rom volcano-plutonic zone (Figure 1). This zone lies between the longitudes How to cite this paper: Tosanloo, N.B.,
Peyrowan, H.R., Sheikhzakariee, S.J. and Rad, A.R.J. (2017) Geochemistry of Host and Altered Rocks in the Nahran Area, Ta- rom Zone (NW Iran): Implication for De-termining of Mineralization Processes in the Alteration Environment. Open Journal of Geology, 7, 374-394.
http://doi.org/10.4236/ojg.2017.73026
Received: September 14, 2016 Accepted: March 27, 2017 Published: March 30, 2017
Copyright © 2017 by authors and Scientific Research Publishing Inc. This work is licensed under the Creative Commons Attribution International License (CC BY 4.0).
49˚7'7.8"E and 36˚41'25.74"E near to Nahran village. The Nahran alteration zone is cutted by Nahran River and can be traced as long-scale white narrow ribbon along the footage of Tarom Mountains. The Nahran alteration zone is mainly hosted by Paleogene tuffs, which have been intruded by younger acidic trusions
N. B. Tosanloo et al.
and widely affected by hydrothermal alteration. Alteration haloes are important in mineral exploration, as they increase the size of the target mineralized zone. For example, some of the altered host rocks in the Tarom contain anomalous concen-trations of gold, which are far-removed from the mineralized veins. Despite to their economic importance for alunite and kaolinite, the Nahran alteration zone is less studied so far and there are many unknown genetic processes involved in the development of alteration areole. This study normally focuses on the alteration zone of Nahran area with the aim of identifying the compositions of source rock (protolith) and the nature of physicochemical changes during alteration [2].
2. Methodology and Analytical Procedures
In this research, extensive field works include preparation of new geological map were combined with systematic and random sampling to aim multidisciplinary approach of this research. After petrographical observation, 25 samples were sele- cted for geochemical analysis. Trace and Minor element for selected samples were analyzed using combined ICP-AES and inductively coupled plasma mass spectro-metry (ICP-MS) methods, at the Geological Survey of Iran. However, major ele-ments were determined by wavelength dispersive XRF, using an automated Phi-lips PW 1480 spectrometer in the Geological Survey of Iran.
3. Discussion
3.1. Geology of Nahran Kaolinite-Alunite District
The Nahran altered zone is located in the NWW border of a large-scale, syncline which oriented from Sirdan to Altin Kosh with an axial length of 9 km. The Dip of layer planes ranges between 40 to 60 towards the NE (Figure 2). The larg in-trusion massif (Kohe Ghajar) is a which situated in the contact zone of Nahran alteration and extent southeastern to Sirdan, Hasan Abad and Kamar roud villages (Figure 3). In the Nahran area, there are several huge alunite deposite within the Eocene volcano-clastic rocks. It is considered that the emplacement of larg in-trusion massif (Kohe Ghajar) into Eocene volcano-clastic rocks promotes the hydrothermal alteration and alunite formation. The alteration areole with 2 km long and 1 km width and with average thickness of 265 m have developed within the black to grey tuffs of E and EK1 unitin the proximity of quartz monzonite and quartz syenite of intrusion massif of the Kohe Ghajar [3][4]. In the Nahran area, there are regular hydtothermal alteration zonations from bottom to top including:
1) Propylitic unit which observed in the proximity of intrusion massif and bottom of the Nahran altered zone within the andesitic tuffs.
2) Medium argillic alteration unit with 210 m thickness.
3) Advanced argillic alteration unit containing quartz bearing alunite with 25 m thickness.
Figure 2. Geological cross-section of Sirdan-Altin Kosh syncline (after., Navaii., 1983).
respect to other neighbor region such as Yuzbashi Chay and Sirdan areas. How-ever, their low silica content suitable for exploration of silica rock [5][6].
3.2. Classification and Nomenclature of Less Altered Host Rock
Several rock classification diagrams are used for classification and nomenclature of less altered extrusive rocks of the Nahran area. They are including:-Middlemost (1994) classification:
According to Na2O + K2O vs. SiO2 diagram of Middlemost [7] [8] [9], the
sam-ples fall in the andesite, trachyandesite and near to dacite boundary line field (Figure 4).
-Winchester and Floyd (1977) classification:
The Zr/TiO2*0.0001 vs. Nb/Y diagrams of Winchester and Floyd (1977) [10] is
more accurate then Na2O + K2O vs. SiO2 diagrams since Zr and Ti are not mobile
elements. According to this diagram all samples fall in the andesite, Trachy-ande- site and dacite regions (Figure 5).
3.3. Determination of Magmatic Series
N. B. Tosanloo et al.
Figure 3. Geological map of Kohe Ghajar Nahran-Altin Kosh.
evuloved from same parent magma. In order to determination of magma series of Nahran volcanic rock several different diagrams are used as follow:
-Miyashiro (1974) diagram:
The FeOt/MgO versus SiO2 diagram can be discriminate alkaline and
subalka-line rocks. Geochemical classification using Miyashiros (1974) scheme categorises the composition of the Nahran volcanic rock fall in the calc-alkaline field (Figure 6).
-AFM diagram (Irvin and Baragar, 1971):
The “AFM” (Alkalis-ΣFeO-MgO) diagram proposed by Irvin and Baragar (1971) can be discriminate tholeiitic, calc-alkaline or Shoshonite affinity of Subalkaline rocks [12]. On the AFM diagram, the Nahran samples plot within the calc-alka- line field. One sample plot on the tholeiit field (Figure 7).
-K2O versus SiO2 diagram Peccerillo and Taylor (1976):
Figure 4. Na2O + K2O vs. SiO2 diagram of Middlemost (1994).
[image:6.595.210.537.407.712.2]N. B. Tosanloo et al.
Figure 6. The FeOt/MgO versus SiO2 diagram of Miyashiro (1974).
Figure 7. AFM diagram (Irvin and Baragar, 1971).
into low-K, medium-K and high-K associations. In the K2O versus SiO2 diagram
the Nahran volcanic rocks shows calc-alkaline, high calc-alkaline and shoshonite affinity (Figure 8).
[image:7.595.245.502.404.644.2]The volcanic rocks divided to peraluminous, metaluminous and peralkaline on the basis of the molecular proportions of AI, Ca, Na and K, expressed in the form A/CNK > 1, A/CNK-1, A/CNK < 1, respectively. The Nahran volcanic rock has metaluminus and peraluminus affinity (Figure 9 and Figure 10).
3.4. Tectonic Setting of Nahran Volcanic Rocks
In order to define the tectonic setting of Nahran volcanic rocks several tectonic discriminate diagram have been used they are include:
-The FeO(t)-MgO-Al2O3 ternary diagram.
The FeO(t)-MgO-Al2O3 ternary diagram proposed by Pearce et al. (1977) and
can be discriminate volcanic rocks of different tectonic setting include: 1) islands of mid ocean spreading center, 2) orogenic, 3) mid ocean ridge, 4) oceanic isl-ands and 5) continental setting (Figure 11).
The Nahran volcanic samples plot in the orogenic and islands of mid ocean spreading center fields.
-The TiO2-MnO*10-P2O5*10 ternary diagram.
Mollen (1983) used TiO2-MnO*10-P2O5*10 to discriminate between tectonic
[image:8.595.181.538.405.716.2]setting for volcanic rocks from different tectonic setting include: 1) OIT (oceanic island tolleiite), MORB (mid ocean ridge basalt), IAT (island arc tolleiite), CAB (calc-alkaline basalt) and OIA (oceanic island andesite) (Figure 12). The Nahran volcanic rocks fall in the oceanic island alkaline basalt and calc-alkaline basalts.
N. B. Tosanloo et al.
Figure 9. The Na2O-Al2O3-K2O ternary diagram.
[image:9.595.212.538.406.717.2]Figure 11. The FeO(t) − MgO − Al2O3 ternary diagram, Pearce et al. (1977).
Figure 12. TiO2 − MnO*10 − P2O5*10 ternary diagram, Mollen (1983).
3.5. Spider Diagrams
The spider diagrams are used for determination of the petrological process and comparison of different tectonic setting. The rare earth element concentration in the Nahran rocks are normalize to a common reference standard such as chon-derite, primitive mantle and MORBs, in order to recognization of magma evolu-tion process such as fracevolu-tional crystallizaevolu-tion, partial melting and magma assimi- lation.
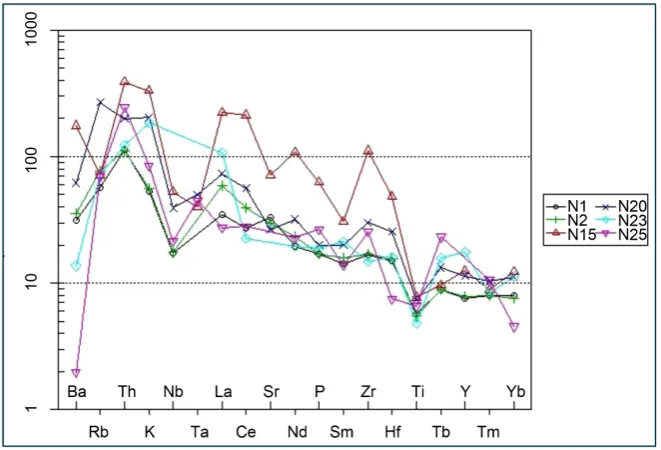
[image:10.595.235.513.343.581.2]N. B. Tosanloo et al.
Thampson et al. (1980; 1984) [13] [14] are used common chonderites values to proposed a chonderite normalized spider diagrams. Thompson (1982) [15] propo- sed that normalization to chondrite values may be preferable to primitive mantle compasation since chondrite value are directly measured rather estimited. In this diagram, compatibility increase from left to right. Chonderite normalized spider pattern of Nahran volcanic rocks show relative enrichment in the incompatible element respect to chonderite (Thamson, 1982) [15]. Relative enrichment in the incompatible element indicates parent magma was not primary magma and di-rect product of mantle melting. As mentioned above partial melting of parent rocks was medium. The concenterations of LILE depend to aqueous fluid phases in contrast concenterations of HFS element controlled by chemical composition of source rocks and magmatic evolution reactions and crystal-melt processes, respectively. The LILE enrichment of Nahran volcanic rock in the Chonderite normalized diagram indicate role of crustal contamination in the magmatic evo- lution. The LILE and HFS amount of Nahran volcanic rock show lowest differ-ence which indicates medium partial melting of source region of parent magma (Figure 13).
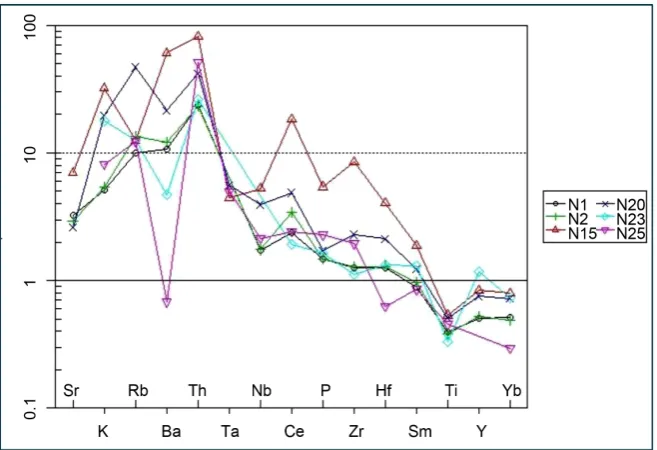
[image:11.595.209.540.490.715.2]-Normalization of Nahran volcanic rocks to mid ocean ridge basalts (MORB). Pearce (1983) determine normalizing values of MORB and provided most ap-propriate pattern for evolved basalt, andesite and mid ocean ridge basalts [16]. The element are ordered so that the most mobile elements (Sr, K, and Ba) are placed at the left of the diagram and in order of increasing incompatibility (Rol-linson, 1993) [17]. MORB normalized spider pattern of Nahran volcanic rocks show relative enrichment in the LILE respect to HFS elements. The LILE and li-thophile elements (especially Th) enrichment indicate the role of crustal conta- mination or other primary magma contaminative processes in the magma evolu- tion. The diagram show descending pattern from mobile to immobile elements
and more of 10 times enrichment in Ba, Rb, Th and K respect to MORB. The re- lative depletion in the Nb, has been explained by retention of a refractory phase in the source in which those elements are highly compatible, such as rutile. How-ever, it can be in related to melting or fractional crystallization of Nb bearing mineral phases (Figure 14).
-Normalization Nahran volcanic rock to Primary mantle.
Wood et al. (1979) are used estimated composition of mantle before continen- tal crust formation as mean for comparing composition variations between basic lavas and intrusions [18] [19] [20]. In this diagram, elements are arranged in order of increasing compatibility with respect to a small percentage melt of the mantle. Primary mantle normalized pattern for Nahran volcanic rocks show des- cending trend with relative enrichment in the compitable element. The week en- richment in the Cs and K indicate negligible crustal contamination and low crystal fractionation. Negative Nb anomaly is typical of continental crust rocks and de- monstrate role of contamination process in the magma evolution. According to Wilson (1989) [21] enrichment of U, K and Th respect to primary mantle may indicate mantle metasomatism by released fluids from subducting slab (Figure 15).
3.6. Chemical Classification of Different Alteration Units
Different alteration units can be distinguished and discriminated based on che- mical features. Hydrothermal fluid changes of major and minor elements in the host rocks of the Nahran alteration zone. For classification of altered rocks used different diagram include:
-AKF diagram.
[image:12.595.210.539.490.715.2]The AKF diagram discriminate Argillic, Advanced Argillic and sericitic zones. the advanced argillic restricted to A side (aluminium silicate) in the AKF diagram
N. B. Tosanloo et al.
Figure 15. Spider plot-Primordial mantle (Wood et al. 1979).
which indicate intense leaching of Fe, Mg, Mn, Na, K and concentration in the SiO2 and Al2O3 respectively. This concentration in the SiO2 and Al2O3 led to
ad-vanced argillic and silicic alterations plot in the same field in the AKF diagram (Mus-Kao-Mont field). In the AKF diagram, the intermediate argillic an sericitic alteration are restricted to center of diagram in the Mus-Mont-Ch field. The host rock and some sample from margin of argillic zone are plotting on AKF ternary diagram. It shows that all samples fall in serecitic field. This is due to abundant of fresh feldespat in the host rock and abundance of chlorite in the propylitic al-teration zones. The most of Nahran altered rocks is located in the intermediate and advanced argillation field. The middle part of Nahran is intermediate argillic. The silicic cap rock represent the advanced argillic alteration which indicate high leaching of alkaline, earth alkaline and other fero-manyasiom elements (Figure 16).
-The Q-P binary diagram.
Cunney et al. (1989) proposed a classification scheme for altered rocks based upon their cation proportions. The Q and P parameters are defined as:
(
)
Q=Si 3− K+Na+2 3Ca .
(
)
P= −K Na+Ca .
The advantage of Q-P diagram respect to De La Roche diagram is using of some of active element in the alteration zones as Ca in the cation calculation. The inter-mediate argillic alteration filed is in the center of Q-P diagram and divided to K metasomatism (arrow number 4) and Na metasomatism (arrow number 1) parts. The sodic metasomatism is happen contemporaneously or following the dequa-rtzfication. Advanced argillic alteration represents an extreme form of base leach-ing where rocks have been stripped of alkali and feroman izian elemets elements and concentration SiO2 and Al2O3 of by very acidic fluids active in high
Figure 16. Opportunity altered samples of Nahran in the diagram AKF.
samples plotted in the upper part of Q-P diagram. From bottom of Q-P diagram to upper part the alkali, earth alkali and feromanyasian elements decrease and Si and Al content increase. The study of variation of Q-P parameter in the Nahran altered rock indicates that the host rocks show Na-metasomatismed intermedia- te argillic alteration associated with dequartzfication. However, there is dequa-rtzfication after intermediate argillic alteration and advanced argillic and silicic alteration in the Nahran area (Figure 17).
-The Na-K diagram.
Cunney et al. (1989) proposed a Na-K diagram which can discriminate dif-ferent alterations zones such as argillic, potassic, Sodic and Dequartzification al-terations. This diagram on the basis of Na and K variations divided to segment. The K-metasomatism field restricted to left segment of diagram, where the K in-crease and Na dein-crease. The right segment of diagram shows Na-metasomatism field where the Na increase and K decrease. The argillic alteration field restricted to lower part of Na-K binary diagram that indicated high Na and K leaching conditions of altered rocks. However, the intermediate argillic samples plotted in the lower part of diagram whereas advanced argillic samples due to high Na and K leaching is plotting in the center of diagram. Peyrovan (1992) [2] divided ar-gillic alteration field to three parts such as:
N. B. Tosanloo et al.
Figure 17. The position of Nahran alteration zone in the diagram Q-P, Cunney et al. (1989).
3) Weak argillic alteration with Na + K content between 4% to 6%.
The dequartzification filed is restricted to right segment of Na − K diagram where the Na + K content of samples are more of 7. In the Na + K diagram, the Nahran alteration samples located in argillation field toward the K-metasomat- ism and Na-metasomatism field this consistent with high leaching of Na and K by hydrothermal and supergene fluids (Figure 18).
3.7. Determination of Mineralization
In order to evaluate of chemical characteristics of fluids associated with alteration episodes several discriminate diagrams have been tested for Nahran samples. Ac-cording to studies [22] [23], the Ba + Sr/Ce + Y + La, Zr/Ti and Cr + Nb/Ti + Fe ratios could be used for determine the role of Hypogene and Supergene processes in the genesis of Kaolins.
-The Ba + Sr versus Ce + Y + La binary diagram.
Figure 18. The position of Nahran alteration zone in the diagram Na-K, Cunney et al. (1989).
which represent effect of hypogene and supergene processes in the kaolin minera-lization (Figure 19).
-The Ti + Fe versus Cr + Nb binary diagram.
The Ti + Fe versus Cr + Nb binary diagram can be used to distinguish super-gene from hyposuper-gene kaolinization [24]. The supergene kaolin deposit has high content of Cr and Nb (Cr + Nb > 100) respect to hypogene deposits. The Cr during the supergene alteration could be substitute of Ti4+ and Fe3+ in the geotite
lattice. Nb is known to be concentrated in Ti minerals as well, due to the similar ionic radii. The preferred concentrations of Fe and Ti in the supergene kaolins led to enrichment of Ti + Fe (Ti + Fe > 1 wt%) supergene kaolins. Therefore, the high Ti + Fe and Cr + Nb represent supergene kaolin deposits. The Nahran Kao-lins show both hypogene and supergene kaolan deposits in the the Ti + Fe versus Cr + Nb binary diagram (Figure 20).
-The Zr/Ti diagram.
N. B. Tosanloo et al.
Figure 19. The Ba + Sr versus Ce + Y + La binary diagram, (Maiza et al., 2005).
Figure 20. The Ti + Fe versus Cr + Nb binary diagram, (Marfil et al., 2005; Dill et al.,
Nahran Kaolin samples fall in the both supergene and hypogene field (Figure 21).
-The Pb – Ba + Sr – Ce + Y + La ternary diagram.
The Pb – Ba + Sr – Ce + Y + La ternary diagram are used for determination of physic-chemical properties of mineralization fluids. Pb is derived from decom-position of K-feldspar in the bedrock; however, it is very low in the weathering zone. Pb does not substitute for other cations in the APS (aluminium, Phos-phate, sulphate) minerals but can replace Ba in barite. The Pb represent of plumbogummite [24]. Plumbogummite was not detected in the Nahra deposit. All Nahran samples lay away from Pb and arrange parallel to the Ba + Sr – Ce + Y + La side in the Pb – Ba + Sr – Ce + Y + La ternary diagram. The proximity of some samples to Ba + Sr side indicates their hypogene source and supergene for Ce + Y + La side adjacency samples (Figure 22).
-The SO3/P2O5 discriminate diagram.
[image:18.595.235.518.305.716.2]In the SO3/P2O5 discriminate diagram, high SO3 content indicate sulfide rich
[image:18.595.221.521.310.477.2]Figure 21. The Zr/Ti diagram.
N. B. Tosanloo et al.
hydrothermal fluids. SO3 rich kaolins are typical of hypogene alteration, whereas
in the Supergene deposits P2O5 is also more abundant and increases with the
de-gree of alteration. The SO3/P2O5 diagram show the alteration in the Nahran area
sormed from both hypogene and supergene fluids (Figure 23).
4. Conclusion
The Nahran area is located in the Northeast of Zanjan in the Northwest of Iran. This area with 20,000 km2 is part of Tarom volcanic-plutonic zone which lies
[image:19.595.212.539.538.716.2]between the longitudes 49˚7'7.80"E and 36˚41'25.74"E near to Nahran village. Based on mineralogical studies, several alteration units and seven alteration zones of propylitic-chloritic intermediate argillic, advanced argillic, aluinte and silicic zones are identified in the Nahran area. The geochemical studies indicate host rocks of Nahran alteration area are andesite, trachy-andesite and dacite which have high-K calc-alkaline and shoshonite affinity. These rocks represent most similarity to orogenic and islands of mid ocean spreading center basalts (oceanic island alkaline basalt and calc-alkaline basalts). The Nahran volcanic rocks have metaluminus and peraluminus affinity. Chonderite normalized spid-er pattspid-ern of Nahran volcanic rocks shows relative enrichment in the LREE re-spect to HREE with positive Eu anomaly. In the Primitive mantle and MORB normalized diagram, the Nahran volcanic rocks display relative enrichment in the compitable element. These indicate the role of crustal contamination or oth-er primary magma contaminative processes in the magmatic evolution of Na-hran volcanic rocks. The study of variation of Q-P parameter in the NaNa-hran al-tered rock indicates that the host rocks show Na-metasomatismed intermediate argillic alteration associated with dequartzfication. Diagram Na-K, showing argil-lic Potassic and Sodic alteration which represents the exit of potassium and so-dium from the rock environment is by hydrothermal solutions. In order to eva-luate chemical characteristics of fluids associated with alteration episodes, several discriminate diagrams such as Ba + Sr/Ce + Y + La, Zr/Ti and Cr + Nb/Ti + Fe have been tested for Nahran samples. These diagrams indicate both supergene
and hypogene process have an effective role in the development of alteration in the Nahran area. In the SO3/P2O5 discriminate diagram, high SO3 content
indi-cates sulfide rich hydrothermal fluids.
References
[1] Nabavi M.H., (1976) The history of the Geological Survey of Iran, Geological Survey of Iran, 109 Page.
[2] Peyrowan, H.( 1992) petrography, petrology and Geochemistry of intrusive igneous rocks in the North Abhar with special reference to mineralization, Msc thesis, teacher training university, Tehran, Iran.
[3] Geological survey of Iran 1969. Explanatory text of the Zanjan Quadrangle Map, 1: 250000, No.D4.
[4] Geological survey of Iran 1975. Explanatory text of the Qazvin – Rasht Quadrangle
Map, 1: 250000, Nos.E3, E4.
[5] Hirayama,K., Zahedi, M. Hoshmandzadeh,A. 1964. Geology of the Zanjan area: The Tarom district,western part , No.8, Geol.Survey of Iran.
[6] Hirayama, K. Haghipour, A. Hajian, J. 1965. Geology of the Zanjan area:The Ta-rom district,eastern part. No.28, 33p. With Map 1:100000. Geol.Survey of Iran. [7] Middlemost E.A.K., 1975, The basalt clan. Earth Sci. Rev., 11, 337-364. [8] Middlemost E.A.K., 1985, Magmas and magmatic rocks. Longman, London. [9] Middlemost E.A.K., 1989, Iron oxidation ratios, norms and the classification of
vol-canic rocks. Chem. Geol., 77, 19-26.
[10] Winchester J.A. and Floyd P.A., 1977, Geochemical discrimination of different magma series their differentiation products using immobile elements. Chem. Geol., 20, 325-345.
[11] Kuno H., 1968, Differentiation of basalt magmas. In: Hess H.H. and Poldervaart A. (eds.), Basalts: The Poldervaart treatise on rocks of basaltic composition, VOL. 2. Interscience, New York, pp. 623-688.
[12] Irvine T.N. and Baragar W.R.A.,1971, A guide to the chemical classification of the common volcanic rocks. Can. J.Earth Sci., 8, 523-548.
[13] Thompson R.N., Morrison M.A., Hendry G.L. and Parry S.J., 1984, An assessment of the relative roles of crust and mantle in magma genesis: an elemental approach. Phil. Trans. R. Soc., A310, 549-590.
[14] Thompson R.N., 1984, Dispatches from the basalt front. 1. Experiments. Proc. Geol. Ass., 95, 249-262.
[15] Thompson R.N., 1982, British Tertiary volcanic province. Scott. J. Geol., 18, 49-107. [16] Pearce J.A., 1983, Role of the sub-continental lithosphere in magma genesis at active
continental margins. In: Hawkesworth C.J. and Norry M.J. (eds), Continental ba-salts and mantle xenoliths. Shiva, Nantwich, pp. 230-249.
[17] Rollinson, Hugh. R. (1993), Using Geochemical Data, Longman Scientific & Tech-nical.
[18] Wood D.A., Joron J.L., Treuil M., Norry M. and Tarney J., 1979a, Elemental and Sr isotope variations in basic lavas from Iceland and the surrounding ocean floor. Contrib. Mineral. Petrol., 70, 319-339.
N. B. Tosanloo et al.
77-97.
[20] Wood D.A., Joron J.L., Treuil M., 1979c, A re-appraisal of the use of trace elements to classify and discriminate between magma series erupted in different tectonic set-tings.Earth Planet. Sci. Let., 45, 326-336.
[21] Wilson M., 1989, Igneous petrogenesis. Unwin Hyman, London.
[22] Marfil, S. and Maiza, P. (2012) Geochemistry of Hydrothermal Alteration in Vol-canic Rocks, Universidad Nacional del Sur—INGEOSUR—CIC de la Provincia de Buenos Aires—CONICET Argentina.
[23] Maiza P. J., Pieroni D., Marfil S. A.,"Geochemistry of hydrothermal kaolins in the SE area of Los Menucos, Province of Rlo Negro, Argentina", In: Dominguez, E.A., Mas, G.R., Cravero, F. (Eds.), 2001, A Clay Odyssey Elsevier, Amsterdam (2003) 123-130
[24] Marfil, S. A. Origin of kaolin deposits in the “LosMenucos” area, RõÂo Negro Province, Argentina, Clay Minerals (2005) 40, 283±293
Submit or recommend next manuscript to SCIRP and we will provide best service for you:
Accepting pre-submission inquiries through Email, Facebook, LinkedIn, Twitter, etc. A wide selection of journals (inclusive of 9 subjects, more than 200 journals)
Providing 24-hour high-quality service User-friendly online submission system Fair and swift peer-review system
Efficient typesetting and proofreading procedure
Display of the result of downloads and visits, as well as the number of cited articles Maximum dissemination of your research work