http://www.scirp.org/journal/jwarp ISSN Online: 1945-3108
ISSN Print: 1945-3094
Pennar (Somasila) to Cauvery (Grand Anicut)
Inter Basin Water Transfer Impact Assessment
on Land Use/Land Cover Environment
S. V. J. S. S. Rajesh, B. S. Prakasa Rao, K. Niranjan
Dept. of Physics, Dr. L. B. College, Dept. of Geo-engineering, Andhra University College of engineering, Department of Physics, Andhra University, Visakhapatanam, Andhra Pradesh, India
Abstract
As a part of the National Water Development Authority (NWDA) proposal, the linking between Pennar and Cauvery is put forth with a single purpose of conserving water to the maximum extent possible. The present study covers with land use/land cover (LU/LC) along the alignment study area 17215.68 sq∙km. All the details of these features have been studied using IRS-P6, LISSIII data to analyze the effect of land use and land cover. The land use and land cover data are classified into 9 categories such as crop land, current fallow, forest, plantations, built-up land, water bodies, scrub land, sandy area and others. The total area going to be capsized is 17215.68 sq∙km out of which 10105.96 sq∙km is proposed command area. The 244 villages have to be reha-bilitated due to this canal whereas about 4597 villages will enjoy the fruits of this canal in the form of drinking water, ground water recharge and as an ad-ditional source of irrigation as well. The study indicated current fallow land of 5340.14 km2 and 6307.98 km2 of cropland can be brought under cultivation which is more than what NWDA estimated land that can be benefitted.
Keywords
Land Use and Land Cover, Command Area, Rehabilitated, IRS-P6, LISS-III
1. Introduction
In today’s world, water has become a very vital ingredient for the sustenance of life on the planet earth. To have support for the life of all floras and faunas, wa-ter is quintessential. Scarcity of wawa-ter not only leads to havoc on the plant and animal life but at the same time, it may lead to conflicts between states and countries. Owing to ever increasing pressure of population on land for meeting How to cite this paper: Rajesh, S.V.J.S.S.,
Prakasa Rao, B.S. and Niranjan, K. (2017) Pennar (Somasila) to Cauvery (Grand Ani- cut) Inter Basin Water Transfer Impact Assessment on Land Use/Land Cover Envi- ronment. Journal of Water Resource and Protection, 9, 393-409.
https://doi.org/10.4236/jwarp.2017.94026
Received: February 11, 2017 Accepted: March 28, 2017 Published: March 31, 2017
Copyright © 2017 by authors and Scientific Research Publishing Inc. This work is licensed under the Creative Commons Attribution International License (CC BY 4.0).
the growing demand for food, fuel and fiber, a sizeable area of erstwhile barren, fallow and marginal lands and forests in the country has been brought under cultivation. To meet the growing demand for water, it is indispensable that water should be preserved and harvested. Populations growing alongside river basins cause a greater increase in the demand for water for agriculture, industrial and basic needs. Places where water is surplus suffer from floods and from droughts and famines where water is scarce. Under such conditions, it was conceived that if water could be transferred from one basin to another, it may prove to be of greater use to meet the demand for water, particularly in urban areas. That is why the linking of rivers with the help of canals has been brought forward so as to provide water to the population deprived of this most important source of life. Inter basin transfer of water is not a new concept, Rao [1]. Many researchers discussed on harvesting excess water in a basin and its pros and corns at length, Reddy [2], Biyani & Gupta [3], Radhakrishna [4], Sharma [5], Jain, Vijay Kumar & Panigraphy [6], Prakasa Rao et al.[7]. Some of the expert studies on the pro-posal of linking of rivers and its consequences are those of Gurzar [8], Prabhu [9], Radhakrishna [10], Eadara et al.[11], Vidyasagar Rao [12], Gupta & Desh-pande [13], Lakshmi et al.[14], Rao et al.[15].
The concept of interlinking of rivers in India was brought forward in 1973 for the first time, stating that the Perennial Rivers of the Himalayas could be linked with the Peninsular Rivers on the Southern part of India so that every part of the country is provided with water not only for human needs but also for agriculture and industrial needs. Canal study area is falling in Nellore and Chittoor districts of Andhra Pradesh, Tiruvallur, Kancheepuram, Vellore, Tiruvannamalai, Villu-puram and Cuddalore districts of Tamil Nadu and Pondicherry.
The existing sources of irrigation are mainly seasonal tanks and wells/dug wells in the study area. Experts argued over the issue both in favor and against the concept. Intellectuals who supported the linking of rivers stated it is unavoida-ble whereas those who opposed the concept quoted; it is not much useful consi-dering the expenditure that is to be incurred on such projects. However National Water Development Authority (NWDA) foresees that interlinking of river basins must be carried out not just to meet all the water demands but also for sustaining sub-surface water reserves in a healthy condition. Information on land use/land cover provides a better understanding of the cropping pattern and spatial distri-bution of fallow lands, forests, grazing lands, wastelands and surface water bo-dies, which is vital for developmental planning, Philip and Gupta [16], Krishna
et al.[17], Vijaykumar et al.[18], B. S. Bishit et al. [19] Naik et al. [20]. In view of the pressure exerted by increasing population, need for mitigating increasing demand of land resources, appropriate scientific land-use planning and land ma- nagement strategies could provide the alternative for the sustainable develop-ment of any region Saxena et al.[21].
[27], Minakshi et al.[28], Brahmabhatt et al.[29].
It is appropriate to use powerful methodology such as GIS combined with Remote Sensing to make the planning of use task of interlinking of rivers easier and effective Krishnaveni et al. [30]. Many investigations were done with Re-mote Sensing & GIS inputs for studying various land features and the changes Lo [31], Raghava Swamy et al.[32], Civco [33], Rao et al. [34], Murthy & Ven-kateswar Rao [35], Weicheng Wu et al. [36].
This information is also vital to oversee, design the Land use and for detecting the changes in the environment as well. Remote sensing and GIS are effective’s tools for land cover and vegetation mapping Skidmore et al.[37]. The observa-tion of the physical cover that includes vegetaobserva-tion both natural and planted is defined as land cover.
An endeavour is made in this study so as to map out the land use/land cover in order to obtain comprehensive information about the potentials and limita-tions of the uses of the present study area. The attempt is also towards under-standing the environmental impact of the project on the present study area. As-sessment of environmental impact is considered very crucial at the early stages of planning of irrigation projects to identify expected negative impact and ways to subdue the problem. Many river channeling projects which have the bases and measures adopted correspondingly in order to protect the ecosystem and human rehabilitation. With the growing population such type of projects and inter linking of rivers are essential for domestic and development of food grains (Ray et al.
[38], Louis and Magpili [39], Wildlife Institute of India [40]).
The total diverted water of 8565 Mm3 from the Somasila dam is proposed through the link to meet command area enrooted (3048 Mm3). Other than this the total domestic and industrial water requirement of the area (1105 Mm3), transmission losses (557 Mm3) and Transfer to Cauvery (3855 Mm3). The areas under each of the branches so measured were adjusted to match with the gross command area of 840,218 ha after deducting the forestland.
2. Study Area
The study area of the Pennar (Somasila)-Cauvery (Grand Anicut) link canal is 17215.68 km2 which corresponds to the link canal and the command area. It is covered in 53 SOI sheets of 1:50,000 scales. The canal is bounded between 10˚43'57"N - 14˚36'52"N latitude and 78˚44'2"E - 80˚18'12"E longitude. Figure 1 shows the link canal (Center line), study area buffer of 20 km on both sides and the proposed command area.
Figure 1. Location map of the study area.
Tamil Nadu states. The existing Somasila dam is located just downstream of the confluence of Cheyyeru River and Kallettivagu River with Pennar River. Grand Anicut is located on the border of Tiruchchirappalli and Thanjavur districts of Tamil Nadu.
un-classified crystallines, rocks of Archean group along with rocks of Undividied Dhalwar group (Ar) and Mesoic-Cainozoic rocks (ep Pc).
Methodology
The basic water resources data of link alignment and other salient features are collected from NWDA (National Water Development Authority), website
http://www.nih.ernet.in, available. The methodology comprises the use of
geos-patial data namely SOI (Survey of India) topo-sheets on 1:50,000 scale of 1969 and Indian Remote Sensing Satellite IRS P6 (LISS III sensor data) digital data. The template is used to format your paper and style the text. All margins, col-umn widths, line spaces, and text fonts are prescribed; please do not alter them. You may note peculiarities. For example, the head margin in this template measures proportionately more than is customary. This measurement and others are deliberate, using specifications that anticipate your paper as one part of the entire journals, and not as an independent document. Please do not revise any of the current designations.
Land use/land cover, rocky outcrops and forest cover changes are derived from LISS-III data (Table 1). The rocky out crops are demarcated from the sa-tellite image which is shown Figure 2. The mosaic of LISS III data information is given below. The SOI topo-sheets are rectified using ERDAS IMAGINE 9.2. Then the images covering study area is rectified with equally distributed GCPs based on the topo-sheets. Rest of the images is projected based on the rectified image. Drainage and villages are vectorised using ArcGIS 9.3 with integrated tools of the GIS software products for building complete GIS applications.
3. Visual Land Use Classification
[image:5.595.206.542.648.733.2]The visual interpretation has been carried out based on the data acquired from standard FCC (False color composite) imagery of IRS-P6, LISS-III for land use and land cover. The land use and land cover are interpreted separately putting into use the interpretation keys. Then the ground truth information is obtained taking into consideration the scheme drawn previously and traverse plan. The ground data has been collected as per the stipulated Performa so that a mini-mum of 10% of the specified area is covered. The areas which were doubtfully interpreted at the preliminary stages have been verified specifically. Basing on the data of ground truth, the changes have been effected and classes along with the boundaries have been refined after which the estimation of areas falling un-
Table 1. IRS-P6, LISS III-Data.
Figure 2. Study area and proposed alignment draped on satellite data.
der different classes has been carried out using planimatric measurements so has to fulfill the statistics of stipulated land use.
data are classified into 9 categories that is crop land, current fallow forest, plan-tations, built-up land, water bodies, scrub land sandy area and others (Table 2).
3.1. Current Fallow
Current fallow land is used for agriculture, but not on a continuous basis. The land is allowed to rest at intervals, not generally for less than one year for various
(c)
Table 2. Land use/land cover classes of the study area.
Classes area (kmNellore 2) area (kmChittoor 2)
Chengal Pattu area (km2)
North Arcot area (km2)
South Arcot area (km2)
Tiruchhirapalli
area (km2) Thanjavur area (km2)
Total Area (km2)
Percentage (%)
Current fallow 328.67 290.58 1359 469.89 2098.66 780.19 13.15 5340.14 31.01 Crop land 217.01 472.08 1596.76 536.10 2728.50 733.86 23.67 6307.98 36.65 Forest 649.94 947.52 464.69 10.19 454.34 429.03 9.32 2965.03 17.22 Water bodies 147.50 65.94 444.90 113.08 434.30 108.26 8.37 1322.35 7.68 Built-up land 5.35 24.77 224.28 30.50 139.40 32.24 456.54 2.66
Scrub land 2.89 20.57 248.58 126.72 0.81 399.57 2.32
Sand area 17.08 3.47 9.20 29.75 0.17
plantations 5.50 5.50 0.03
others 50.50 130.66 18.73 53.59 112.79 22.55 388.82 2.26
17215.68 100%
reasons such as rain fall and irrigation facilities. These lands are appeared in light red to cyan in colour with varying shape size. An area of 5340.14 sq∙km is occupied by these lands throughout the study area out of which 2907 sq∙km fall in the command area.
3.2. Crop Land
Cropland is that land with standing crop. Crops may be either Kharif or Rabi or both, where food, fiber alongside other commercial and horticultural crops are cultivated. All those lands either irrigated or un-irrigated or current fallow fall under this category. Crop lands are cultivated by the time when the satellite pic-ture is taken. They are indicated in bright red to red in colour, although the shape and size vary from place to place. The total area of crop land is 6307 km2 in the study area whereas the command area comprises of 4336 km2 of the total area of cropland.
3.3. Forest
It is an area that bears an association of trees and other vegetation types which are capable of producing timber alongside other forest products. These areas ap-pear in dark red to red of different sizes. The size is non continual as well as un-even that occupies hill slopes and medium relief within the stipulated regions. The area of forests in the study area is precisely 2965 sq∙km in this total area ap-proximately 895 sq∙km of forest fall in the command area.
3.4. Water Bodies
1322.35 sq∙km in the study area wherein about 1048 sq∙km of water bodies come under the command area. Most of the water bodies come under irrigated tanks.
3.5. Scrubland
A scrubland has a very less density of vegetative canopy and is a result of both biotic and abiotic influences. A scrub is a stunted tree of a bush /shrub. Scrub lands are easily deteriorated because of erosion and they are generally found at high locations except on mountainous regions. Scrub lands, basing on the mois-ture cover on the surface, appear in light yellow to brown and greenish blue. These lands are indicated in different sizes with pattern either concentrated or dispersed. Scrub lands occupy an extent of 400 sq∙km approximately in the study area.
3.6. Built-Up Land
Built-up land can be defined as an area used for human habitation developed due to nonagricultural use. It has a cover of buildings, transport and communi-cations, utilities associated with water alongside vegetation as well as vacant lands. All the villages and towns in the area are under this class. They appeared in light brown colour. An area of 457 sq∙km approximately is occupied by built up land in the study area.
3.7. Sandy Area
An area where there is an accumulation of sand which is naturally deposited or transported by natural agents is known as sandy area. These areas are found ei-ther in the form of sand dunes, beaches or channel islands of a river/stream. They appear in white colour. The total area of sand in the study area is 29.75 sq∙km.
3.8. Plantations
Areas under agricultural tree crops such as tea, coffee, rubber, coconut, areca nut, citrus fruits, orchards as well as other horticultural nurseries are known to be plantations. These are planted by adopting specific agricultural management techniques. They appear in dark red to red of different sizes. The total area of plantations is 5.50 sq∙km.
3.9. Others
All those lands which can be treated as miscellaneous due to their nature of oc-currence, physical appearance and other characteristics are called others. These constitute all such land forms which do not fall in any of the above cited catego-ries. They are such as bridges, major roads, gorges, railroads etc. The study area comprises to an extent of 338.82 sq∙km under this class in the study area.
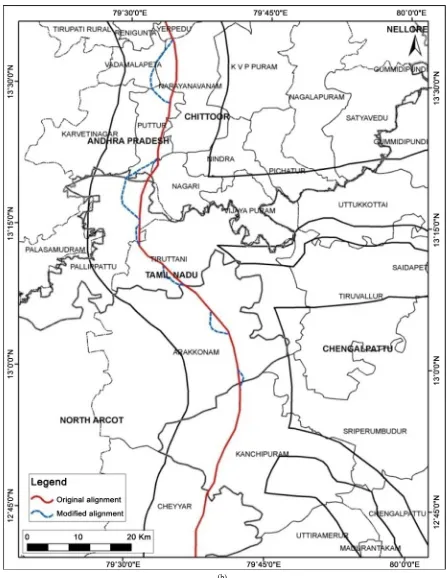
4. Alignment Modification
the image. The alignment direction is examined closely with topographic features, hilly terrain, croplands, settlements and reserved forest. Accordingly changes in the alignment are suggested at 10 locations. These locations are shown in the Figure 4(a) & Figure 4(b) in two parts for clarity of display. A change in the di-
[image:12.595.87.540.130.742.2](b)
Figure 4. (a) Alignment modification of the Pennar-Cauvery link canal; (b) Alignment modification of the Pennar- Cauvery link canal.
[image:13.595.93.540.66.644.2]km) in Venkatagirimandal. A similar diversion is suggested at Devarukona to Kuntakalva (9.11 km).
The original alignment is cutting across Velikonda hill and Krishnapuram protected forest, hence a diversion is suggested from uppukonda near Gollapalle village in Srikalahastimandal and at 140 m contour to join at Vikrutamala village in Yeripedumandal (28.88 km). In Narayanavanammandal the original align-ment is through Narayanavanam reserved forest, hence a change in the direction of the alignment is indicated from Suddakaka village to Ramakrishnapuram (12.73 km). The alignment again cut across hilly terrain (400 m elevation) near Krishna Samudram and hence a change in the alignment direction is put forth from Krishna Samudram to Pentakandigai (12.75 km) in Chengalpattu taluk. The ori- ginal alignment passes through Arakkonam town hence a small change in the di- rection is suggested from Kaimur village to Perumuchchi (5.88 km).
Another small diversion is taken to bypass 3 villages and joins original align-ment at Pullalur (3.3 km) village. A similar change in the alignalign-ment is shown to bypass 3 more villages from Katteri village to Kalpakkam village. Finally by mo- difying the alignment it is noted that 21 villages are being bypassed. The modifi-cation effects save approximately 39 sq∙km area of reserved forest which was to be lost with the prior alignment modification. Hilly terrain of 58 sq∙km area re-mains intact due to the modification and the burden of cutting and flattening of this terrain can be saved which proves to be cost effective for that reason.
5. Environmental Impact
The environmental impact due to the canal alignment is both advantageous as well as disadvantageous in the aspects pertaining to forest, settlements, roads and crop lands. Buffer of one kilometer is overlaid along the alignment so that all those villages which have to be rehabilitated for the construction of the canal could be demarcated.
The canal will be beneficial to about 4597 villages as drinking water is pro-vided alongside recharging the ground water levels and providing an additional source of irrigation. Remote sensing study elucidates that a large extent of area of about 5340 sq∙km falls under Current fallow land class. With the advent of the canal all this Current fallow land can be irrigated and additional water can be supplied to those lands in which single crop is formed due to inadequacy of wa-ter for double crop. It is 1,164,812 ha derived from the real time data as against the NWDA projections of 840,218 ha.
There are about 244 villages which will be impacted by the canal along its length of 483 km also there are 5 tribal villages in the enrooted. For a length of 81 km, the canal runs through hilly area. About 112.36 sq∙km of forest canopy will disappear because of the canal construction. About 149 sq∙km area of crop land will be af-fected in the plains due to alignment of the canal and its water longing.
6. Conclusions
remedy environmentally as well as socio economically so as to subdue the defi-ciency of water in the region where occurrence of rainfall is uneven and drought conditions prevail. The study explains the Pennar-Cauvery link canal which is proposed by National Water Development Authority (NWDA). The total study area is 17215.68 sq∙km whereas the command area comprises of 10105.96 sq∙km of the total area. According to the study, 244 villages falling within the limits of canal alignment have to be rehabilitated while the canal is constructed.
The canal is a boon to 4597 villages located in the study area which will be provided with abundant amount of water for drinking as well as irrigation. IRS-P6, LISS-III data disclosed that current fallow land to an extent of 5340 sq∙km could be transformed into productive land by virtue of the canal. Number of towns and villages will be benefited by the canal as they will be equipped with sufficient water supply for domestic as well as industrial purposes.
Therefore, it can be concluded out of the study that the link canal will be ca-pable of turning most of the waste land into a cultivable one, providing water to those lands which are deprived of water for agriculture. The canal will also em-power all the towns and the villages on its course with considerable amount of water, besides enhancing the levels of ground water on either side of its course, as a result of which there will be a noticeable reduction in floods in the donor basin.
By modifying the alignment, it is noted that 21 villages are being saved. The modification effects save approximately 39 sq∙km area of reserved forest which was to be lost before the alignment was modified. Hilly terrain of 58 sq∙km area remains intact due to the modification and the burden of cutting and flattening of this terrain can be saved, which proves to be cost effective for that reason.
Acknowledgements
The authors are grateful to Dr. Neeli Srinivas and Dr. N. Bhaskar for their sup-port to cary out the work.
References
[1] Rao, K.L. (1975) India’s Water Wealth. Orient Longman, New Delhi.
[2] Reddy, M.S. (2003) Linking of Rivers in India—Retrospect and, Prospect. Journal of Applied Hydrology, 16, 14-30.
[3] Biyani, A.K. and Gupta, S.K. (2004) River Linking: More a Bane. Current Science, 87, 277-278.
[4] Radhakrishna, B.P. (2003) Linking of Major Rivers of India—Bane or Boon? Cur-rent Science, 84, 1390-1394.
[5] Sharma, R.K. (2006) Linking Indian Rivers. Current Science, 90, 1589.
[6] Jain, S.K., Kumar, V. and Panigraphy, N. (2008) Some Issues on Interlinking of Ri- vers in India. Current Science, 95, 728-735.
[7] Prakasa Rao, B.S., Vasudeva Rao, P.H.V., Jaisankar, G., Ammineedu, E., Satyaku-mar, M. and Koteswara Rao, P. (2010) Intelinking of River Basins: A Mega Har-vesting Plan—A Review. Journal of Indian Geophysical Union, 14, 31-46.
84, 1381-1382.
[9] Prabu, S. (2003) Inter-Linking of Rivers—Taskforce to Look into All Aspects. [10] Radhakrishna, B.P. (2004) Man-Made Drought and the Looming Water Crisis. Cu-
rrent Science, 87, 20-22.
[11] Eadara, A. and Karanam, H. (2013) Slope Studies of Vamsadhara River Basin: A Quantitative Approach. Variations, 3, 184-189.
[12] Vidyasagar Rao, R. (2003) Inter-Basin Water Transfer—A Vital Necessity But a Dis- tant Reality. Special Volume, Vol. XVI, No. 4A.
[13] Gupta, S.K. and Despande, R.D. (2004) Water for India in 2050: First Order Assess- ment of Available Options. Current Science, 86, 1216-1224.
[14] Lakshmi, A.S., Saran, S., Srivastav, S.K. and Murthy, Y.K. (2014) Geospatial Model-ling Approach for Interlinking of Rivers: A Case Study of Vamsadhara and Nagavali River Systems in Srikakulam, Andhra Pradesh. The International Archives of Pho-togrammetry, Remote Sensing and Spatial Information Sciences, XL-8, 124-132.
https://doi.org/10.5194/isprsarchives-XL-8-127-2014
[15] Rao, B.S., Srinivas, N., Rao, N.B., Rajesh, S.V. and Pernaidu, P. (2012) Geological and Environmental Issues of the Proposedink Canal (Inchampalli to Nagarjunasa-gar) of Godavari to Krishna Rivers Adopting Remote Sensing and Geographical In-formation System (GIS). Journal of Geology and Mining Research, 4, 75-85. [16] Philip, G. and Gupta, R.A. (1990) Channel Migration Studies in the Middle Ganga
Basin, India Using Remote Sensing Data. International Journal of Remote Sensing, 10, 1141-1149. https://doi.org/10.1080/01431168908903953
[17] Krishna, N.D.R., Westinga, W. and Huizing, H. (1999) Monitoring Land Cover Changes Using Geoinformatics in Some Communal Lands of Zimbabwe. Proceed-ings of International Conference on Geoinformatics: Beyond 2000, Dehradun, March 1999.
[18] Kumar, V., Rai, S.P. and Rathore, D.S. (2004) Land Use Mapping of Kandi Belt of Jammu Region. Journal of the Indian Society of Remote Sensing, 32, 323-328.
https://doi.org/10.1007/BF03030857
[19] Bisht, B.S. and Kothyari, B.P. (2001) Land-Cover Change Analysis of Garur Ganga Watershed Using GIS/Remote Sensing Technique. Journal of the Indian Society of Remote Sensing, 29, 137-141. https://doi.org/10.1007/BF02989925
[20] Naik, D.R., Bosukonda, S. and Mrutyunjayareddy, K. (2011) Reservoir Impact As-sessment on Land Use/Land Cover and Infrastructure—A Case Study on Polavaram Project. Journal of the Indian Society of Remote Sensing, 39, 271-278.
https://doi.org/10.1007/s12524-011-0086-2
[21] Saxena, K.G., Rao, K.S. and Kothyari, B.P. (1990) Social Forestry in a Broad Pers-pective of Integrated Resource Management and Sustainable Production. Interna-tional Journal of Ecology and Environmental Sciences, 16, 15-26.
[22] Gautam, N.C. and Narayanan, L.R.A. (1983) Landsat MSS Data for Land Use/Land Cover Inventory and Mapping: A Case Study of Andhra Pradesh. Journal of the In-dian Society of Photo-Interpretation and Remote Sensing, 11, 15-27.
[23] Sharma, K.P., Jain, S.C. and Garg, P.K. (1984) Monitoring Land Use and Land Cove Changes Using Landsat Images. Journal of the Indian Society of Remote Sensing, 12, 115-121.
[24] Jaiswal, R.K., Saxena, R. and Mukherjee, S. (1999) Application of Remote Sensing Technology for Land Use/Land Cover Change Analysis. Journal of the Indian So-ciety of Remote Sensing, 27, 123-128.
No. CS (AR)-222, National Institute of Hydrology, Roorkee, 45 p.
[26] Tiwari, A.K., Kudrat, M. and Machandra, M.L. (1996) Remote Sensing and GIS: In-dispensable Tools for Regional Ecological Studies. Tropical Ecology, 37, 79-92. [27] Palaniyandi, M. and Nagarathinam, V. (1997) Land Use/Land Cover Mapping and
Change Detection Using Space Borne Data. Journal of the Indian Society of Remote Sensing, 25, 27-33. https://doi.org/10.1007/BF02995415
[28] Chaurasia, M.R. and Sharma, P.K. (1999) Landuse/Land Cover Mapping and Change Detection Using Satellite Data—A Case Study of Dehlon Block, District Ludhiana, Punjab. Journal of the Indian Society of Remote Sensing, 27, 115-121.
https://doi.org/10.1007/BF02990807
[29] Brahabhatt, V.S., Dalwadi, G.B., Chhabra, S.B., Ray, S.S. and Dadhwal, V.K. (2000) Landuse/Land Cover Change Mapping in Mahi Canal Command Area, Gujarat, Using Multi-Temporal Satellite Data. Journal of the Indian Society of Remote Sens-ing, 28, 221-232. https://doi.org/10.1007/BF02990813
[30] Krishnaveni, M., Prakashvel, J. and Kaarmegham, J. (2003) GIS and Visualization Capabilities for Interlinking of Indian Rivers. Map Asia Conference 2003.
[31] Lo, C.P. (1981) Land Use Mapping of Hong of Kong from Landsat Images: An Eva- luation. International Journal of Remote Sensing, 2, 231-252.
https://doi.org/10.1080/01431168108948359
[32] Raghav Swamy, V., Goutam, N.C., Rao, D.P. and Nagaraja, R. (1992) Land Use/ Land Cover Mapping and Monitoring Urban Sprawl Using IRS Data. A Few Exam-ples. In: Karale, R.L., Ed., National Resources Management System (NNRMS), De-partment of Space, Bangalore, 120-127.
[33] Civco, D.L. (1993) Artificial Neural Networks for Land Cover Classification and Mapping. International Journal of Geographical Information Systems, 7, 173-186.
https://doi.org/10.1080/02693799308901949
[34] Rao, D.P. (1999) Remote Sensing Applications for Land Use and Urban Planning: Retrospective and Perspective. Proceedings of ISRS National Symposium on Re-mote Sensing application for Natural Resources Retrospective and Perspective, Ban- galore, 19-21 January 1999, 287-297.
[35] Murthy, K.S.R. and Venkateswara Rao, V. (1997) Temporal Studies of Land Use/Land Cover in Varaha River Basin, Andhra Pradesh, India. Journal of the In-dian Society of Remote Sensing, 25, 145-154.
[36] Wu, W., Lambin, E.F. and Courel, M.-F. (2002) Land Use and Cover Change Detec-tion and Modeling for North Ningxia, China. Map Asia, 288-292.
[37] Skidmore, A.K., Bijker, W., Schmidt, K. and Kumar, L. (1997) Use of Remote Sens-ing and GIS for Sustainable Land Management. ITC Journal, 1997-3/4, 302-315. [38] Ray, S.S., Dadhwal, V.K. and Navalgund, R.R. (2002) Performance Evaluation of an
Irrigation Command Area Using Remote Sensing: A Case Study of Mahi Com-mand, Gujarat, India. Agricultural Water Management, 56, 81-91.
[39] Louis, G.E. and Magpili, L.M. (2002) Representing Inequities in the Distribution of Socioeconomic Benefits and Environmental Risk. Environmental Monitoring and Assessment, 79, 101-119. https://doi.org/10.1023/A:1020221530393
Submit or recommend next manuscript to SCIRP and we will provide best service for you:
Accepting pre-submission inquiries through Email, Facebook, LinkedIn, Twitter, etc. A wide selection of journals (inclusive of 9 subjects, more than 200 journals)
Providing 24-hour high-quality service User-friendly online submission system Fair and swift peer-review system
Efficient typesetting and proofreading procedure
Display of the result of downloads and visits, as well as the number of cited articles Maximum dissemination of your research work