Munich Personal RePEc Archive
Does Schooling Pay? Evidence from
China
La, Vincent
Dartmouth College
11 March 2014
Online at
https://mpra.ub.uni-muenchen.de/54578/
Dartmouth College
Does Schooling Pay? Evidence from
China
Vincent La
March 11, 2014
(Working Paper)
Abstract
1
Introduction
It is a certain ”fact” about the labor market that education is an important influence on wages. Generally, better educated workers earn more than less educated workers. There is already tremendous amounts of literature that examines the link between education and wages in various environments. In a seminal contribution, Mincer (1974) introduces a human capital framework which provided a starting point from which a large literature studying the effect of education on wages spawned. While it is certainly apparent that there is gener-ally a positive correlation between education and wages, one must be careful in interpreting the true effect of education. Education is not randomly assigned across society – indeed, it is certainly plausible that the individuals choosing to achieve more or less education will have other characteristics that can affect their performance in the labor market. These biases could ultimately lead to an overstatement or understatement of the ”true” effect of education.
To isolate the causal effect of education requires an exogenous source of variation in ed-ucational attainment. Many existing studies have utilized different approaches to address the endogeneity. For example, Ashenfelter and Rouse (1998) among several other studies have employed twins/siblings data to control for family background and/or inherent ability. Other papers, use other exogenous factors to instrument for education. Card (1995) uses proximity to a nearby college to instrument for individual educational attainment. Angrist and Kreuger (1991) find that individuals’ season of birth is a valid instrument for individual educational attainment, the idea being that individuals born earlier in the year can attain the minimum legal age for dropping out of school at a lower grade due to the interaction of school start age policies and compulsory education laws. Many other landmark studies have concluded that the “true” return to education is approximately 10 percent.
However, much of the existing literature has focused mostly in the US and Europe. A much smaller subset of the literature has examined the relationship between education and earnings using data from China. At the same time, China is an important country to study this relationship. The Chinese Economic Reform policies in the late 1970’s has paved the way for China’s rapid economic growth. During the same time period, China’s education system was also massively overhauled starting with the implementation of a compulsory education law in 1986. Indeed, since the 1980’s it seems that China’s government has increasingly emphasized the role of education in economic and social development. Thus, it is also im-portant from a policy point of view to empirically verify that first, these education policies have increased individual educational attainment, and second, there are in fact significant returns to education.
Our study will contribute to the relatively nascent literature regarding the causal effect of education on wages in China by using institutional features to instrument for individual educational attainment. First, we will reexamine the estimates provided by Fang et. al (2012). While using China’s Compulsory Education Law as an instrument for educational attainment is free of reverse causality, individuals born later and thus affected by the educa-tion law would have also entered the labor market at a time when China was experiencing massive economic growth. This is a cause of econometric concern because not properly ac-counting for this effect will overestimate the “true” return to education. Indeed, Fang et al (2012)’s results are generally higher than those found in other studies. In fact, in some sub-populations which Fang et al (2012) examines, they report a 51% return to education for males and a 37% return to education for individuals in coastal provinces. Both of these estimates are most likely positively biased.
In addition to using China’s Compulsory Education Law, we consider other possible in-struments for educational attainment. One possibility is the enactment of the Provisions on the Prohibition of Using Child Labor in 1991. The Provisions, which among many other objectives, establishes a minimum working age of 16 which may have induced greater edu-cational attainment. Other possibilities include instruments which have already been used in previous studies of Western countries, such as season of birth, which is also employed by Angrist and Krueger (1991).
To date, we find that OLS estimates imply that an extra year of education is associated with about an 8.4% increases in wages. Furthermore, we find that China’s compulsory schooling law and the Provisions on the Prohibition of Using Child Labor has increased in-dividual educational attainment by 0.82 and 1.15 years, respectively. Using the compulsory schooling law as an instrument, we fail to find statistically significant estimate of the return to education. However, using the Provisions as an instrument, we find that an extra year of education is associated with about a 9% increase in wages. Results differ by sub-populations.
The remainder of this paper is organized as follows. Section 2 delves further into the rel-evant literature and provides a framework for understanding the historical context of the relevant Chinese socioeconomic policies. Section 3 presents the methodology by which we plan to estimate the effect of education on earnings. Section 4 describes the data we are using. Section 5 displays both our OLS and 2SLS estimates. Finally, Section 6 summarizes our results and discusses relevant strategies to possibly extend the literature.
2
Literature Review
This section reviews research that is most pertinent to this study, including research which has used Chinese data or research using features of education institutions to instrument for individual educational attainment.
From the foundation of the People’s Republic of China in 1949 to the late 1970’s when Deng Xiaoping finally rose to power, the former Ministry of Personnel and Ministry of Labour and Social Security centrally determined the wages of all workers. Empirical research done on the return to education during the Maoist era in China has substantiated claims that these Maoist era policies have suppressed returns to education. Using survey data from 800 adults in Nanjing city, Byron and Manaloto (1990) provide OLS estimates from a standard Mincer model which imply the return to education was approximately 4% in 1986. Using data from the 1988 Chinese Household Income Project, Johnson and Chow (1997) report similar estimates (4.01% in rural China, 3.29% in urban China).
Low returns to education in transitional economies are not unprecedented; Fleisher (2005) documents several studies which have independently studied the return to education in other transitional economies, such as Romania, Russia, and Ukraine. In each of these cases, esti-mates for the return to education were low until the transition to market-based economies, after which the returns to education grew and generally approached the world average for industrialized countries.
Empirical research studying the returns to education during the 1990’s and 2000’s have suggested that China followed a similar trend. Zhang et. al (2005) use data from fourteen consecutive annual surveys of urban households conducted by China’s National Bureau of Statistics from 1988 through 2001. They estimate that the return to education in urban China was only 4.0% in 1988, but by 2001, it had risen to 10.2% – very similar to estimates in other industrialized countries.
One potential problem with the literature presented, which hitherto have employed a stan-dard OLS regression using a Mincerian human capital earning function, is the possibility of endogeneity bias. A popular solution has been to instrument for individual educational attainment using educational institutional features. This has widely been used in Western countries where most developed countries have had compulsory education laws.
Other recent papers include Oreopoulos (2006), which exploits provincial level variation in the minimum drop out age specified by compulsory schooling laws in Canada to instru-ment for individual educational attaininstru-ment. Returns to education were estimated to be 12%.
This paper will most closely resemble that of Fang et al. (2012). They estimate the re-turns to an additional year of schooling in 1997-2006, and they account for the endogeneity problem by using the Compulsory Education Law as an instrument. More specifically, using data from the China Health and Nutrition Survey (CHNS), they first create a binary variable indicating whether an individual was less than 15 years old on the law’s effective date in that individual’s province. Thus, they define their “treatment group” as those who were younger than 15 years old on the law’s effective date and their “control group” as those who were older than 15 years old and thus not affected by the law. They use this binary variable as an instrument for education, and they show that the Compulsory Education Law raised overall individual educational attainment by about 0.8 years.
They also employ two levels of analysis. On their first level, they use all observations of people who were born in 1961 or later. However, due to concerns of overall time trends, especially given that China’s economy was growing rapidly during this period, they employ a second level of analysis where they only include people ages 13, 14, 15, and 16 on the law’s effective date. They then compare the two-year treatment cohort (aged 13 and 14 on the law’s effective date) to the two-year control cohort (aged 15 and 16). This diminishes some concerns regarding overall time trends. Their IV estimates report that on average, the return to schooling is approximately 20 percent for one additional year of education. In addition, they explore how returns to education vary by gender, by urban vs rural regions, and by inland vs. coastal provinces.
2.1
Institutional Background
China’s Compulsory Education Law was first established on July 1st, 1986 and is the first Chinese law to stipulate educational policies for the entire country. Among other things, the Law established (China Education Research Network): nine years of education became com-pulsory, children would begin compulsory education at the age of 6, compulsory education would be free for all students, and employment of children still undergoing compulsory edu-cation was outlawed. This means that the typical student who begins compulsory schooling at age 6 would be eligible to leave by age 15. Those under 15 who had already left school by the law’s effective date were required to return to school until they turned 15 (Fang et. al 2012). Thus, those younger than 15 when the law took effect, in particular the cohort of students who would have dropped out of school in absence of the Law, are likely to have received more years of schooling than they otherwise would have.
Shan-dong; October 1, 1986 in Henan; March 1, 1987 in Hubei; January 1, 1988 in Guizhou; and September 1, 1991 in Hunan and Guangxi. However, in China, the new school year generally starts in September and only those who have reached the age of six by September can attend school in that year.
In addition, there is cause for concern for the immediate effectiveness of the Compulsory Education Law. Universal compliance to the Compulsory Education Law was actually a long-term goal set by the Chinese government. In fact, the target deadline for achieving
uni-versal access to primary education was 20151
. By 2011, 4 years before the target deadline, the net enrollment rate of children in primary education was 99.8 percent.
However, at the time of its implementation, enforcement of the law is difficult to assess. Especially in rural areas, where resources were much more limited, there is evidence that compulsory education was not made universally available even after the law was enacted. Punishment for not complying with the compulsory education law could be as mild as verbal admonishment (Xie and Mo 2013). In a more qualitative approach Liu (2003) use a survey of 30 families of dropout students in Weichang county, Hebei province, to investigate reasons for students dropping out prior to completion of compulsory education. While primary level enrollment rates were found to be high, enrollment rates in “Junior Secondary” (years 7-9 of compulsory education) were much lower. Common reasons for dropping out were “Little hope of entering university”, “Cannot afford university even if one could enter university”, and “Parental pressure to drop out”. Connelly and Zheng (2003) further substantiate these claims. Using data from the 1990 Chinese Census, they find that in aggregate, approximately 50% of rural youths ages 10-18 are still in school in 1990. In comparison, approximately 75% of urban youths in the same age range are still in school in 1990. By gender, they find that 73% and 72% of urban boys and girls, respectively are still in school. However, only 55% and 44% of rural boys and girls, respectively are still in school.
The other institutional feature which may serve as a potential instrumental variable is The Provisions on the Prohibition of Using Child Labor. First instituted on April 15, 1991, and later amended in 2002, the Provisions establishes guidelines for hiring young adults. Among other objectives, it established the minimum working age to be 16, one year older than the average age of completion of compulsory education, 15. In addition, enforcement of the Pro-visions was much stricter than enforcement of the Compulsory Education Law (Child Labour Bulletin 2007). At a minimum, employers found to be employing child workers were forced to dismiss the workers at once. Furthermore, employers were fined 5,000 Yuan per child worker per month employed. Repeat offenders faced a much heavier fine and a possibility of getting their business license revoked. Lastly, in 2002, the Provisions were slightly modified to increase the severity of the penalties levied on employers of child laborers. However, the main content remained the same.
It is possible that both the Compulsory Education Law and the Provisions can have a positive effect on individual educational attainment. Even with concerns of effective
ment, it is certainly likely that the Compulsory Education Law increased overall educational attainment. After students have completed compulsory education at an average age of 15, it is likely that due to inability of finding employment until 16, they stay in school one extra year.
3
Methodology
As mentioned previously, to estimate the private returns to education, we will use China’s Compulsory Education Law and The Provisions on the Prohibition of using Child Labor as instruments for individual educational attainment. Our equation of interest is a standard Mincerian model:
ln(W ages) =β0+β1(Schooling) +β2X+µ, (1)
• ln(W ages) is the natural log of annual wages (Renminbi 2006 Yuan)
• Schooling is years of education completed
• X represents other controls (e.g. gender, marital status, etc.)
• µis the error term.
Using instrumental variables may solve the potential problem that education is endogenous. A valid instrument should significantly correlated with the main independent variable, but should not be correlated with other variables that affect the main dependent variable. We believe that both the Compulsory Education Law and The Provisions on the Prohibition of using Child Labor should be statistically significantly correlated with education, and we can explicitly test this in a first stage regression.
Institutional changes have also been generally accepted to be legitimate and free of potential endogeneity bias. Certainly, reverse causality can be ruled out. As Acemoglu and Angrist (2000) argue, institutional changes (such as compulsory schooling laws) may have been de-termined by social forces operating at the time of passage but the institutional changes that affect an individual in childhood should not be affected by future wages.
Another possibility is to use other instruments for individual educational attainment that would not suffer from the potential bias stemming from overall time trends in China. For example, Angrist and Krueger (1991)’s instrument, quarter of birth, is plausibly viable. Although China’s Compulsory Education Law is different than many Western countries’ compulsory education laws in that it specifically enforces 9 years of education as opposed to a minimum dropout age, the effect of the Provisions on the Prohibition of using Child Labor may generate sufficient variation in educational attainment based on individuals’ quarter of birth. Since children are not allowed to work before the age of 16, this might affect a child’s decision to stay in school longer. If this is the case, the minimum age of employment due to the Provisions may functionally serve the same purpose as the minimum dropout age which Angrist and Krueger (1991) exploit in compulsory schooling laws.
4
Data
This study will use longitudinal data from the China Health and Nutrition Survey (CHNS), which is collaboratively maintained by both the Carolina Population Center at the University of North Carolina at Chapel Hill and the National Institute of Nutrition and Food Safety at the Chinese Center for Disease Control and Prevention. The survey is conducted every 2-4 years since 1989. Consistent with the existing literature, we use waves of data collected in 1997, 2000, 2004, and 2006. Data prior to 1997 contain very few observations of individuals would would have been old enough to be affected by the Compulsory Education Law enacted in 1986. CHNS also contains two additional survey waves in 2009 and 2011. However, at this time, some data from these two survey waves are still being processed by CHNS, and thus we do not include data from these two waves in this study. Furthermore, since CHNS is an unbalanced panel data set, the same individual may appear in more than one wave
of the data. To account for this, we have created a sample weight variable to control for this2
.
China consists of 33 provincial-level administrative units. This consists of 22 standard provinces, 4 municipalities (large cities with a status equivalent to a province, e.g. Bei-jing Municipality), 5 autonomous regions (generally a region comprised largely of ethnic minorities, e.g. Xinjiang), and 2 Special Administrative Regions (e.g. Hong Kong). CHNS contains data from 9 of China’s provinces. These 9 provinces account for 44% of China’s total population.
Consistent with the existing literature we will keep only those individuals born in 1961 or later. As we mentioned earlier, Maoist-era policies potentially suppressed returns to ed-ucation. In addition, events such as the Great Leap Forward (1958-1961) and the Chinese Cultural Revolution (1966-1976) marked a time of extreme political turmoil in China. Indi-viduals born in these periods may not be appropriate comparisons due to the very different socioeconomic conditions of their childhoods. Individuals born in 1961 or later would have been younger than 15 by the end of the Cultural Revolution. Furthermore, we will exclude
2For example, an individual who appears in all four waves is assigned a sample weight of 0.25 in the
students currently studying in school since they do not currently have any earnings.
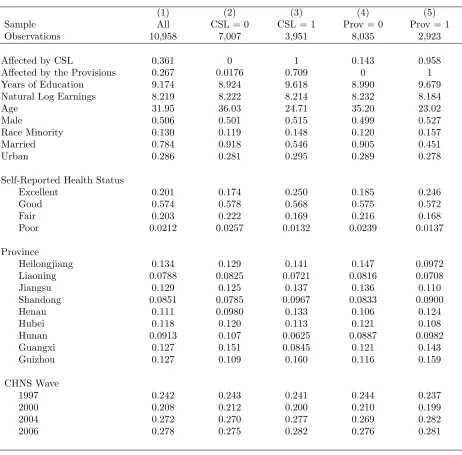
[image:10.612.77.539.215.670.2]To estimate the private returns to schooling, the dependent variable of interest is the natural logarithm of an individuals’ earnings. This will include: annual wages, income from busi-nesses, faring, gardening, fishing, livestock, and retirement benefits. The main independent variable will be completed years of education. Other controls may include: age, gender, ethnic status, marital status, urban residency, province, and self-reported health status.
Table 1: Summary Statistics
(1) (2) (3) (4) (5)
Sample All CSL = 0 CSL = 1 Prov = 0 Prov = 1
Observations 10,958 7,007 3,951 8,035 2,923
Affected by CSL 0.361 0 1 0.143 0.958
Affected by the Provisions 0.267 0.0176 0.709 0 1
Years of Education 9.174 8.924 9.618 8.990 9.679
Natural Log Earnings 8.219 8.222 8.214 8.232 8.184
Age 31.95 36.03 24.71 35.20 23.02
Male 0.506 0.501 0.515 0.499 0.527
Race Minority 0.130 0.119 0.148 0.120 0.157
Married 0.784 0.918 0.546 0.905 0.451
Urban 0.286 0.281 0.295 0.289 0.278
Self-Reported Health Status
Excellent 0.201 0.174 0.250 0.185 0.246
Good 0.574 0.578 0.568 0.575 0.572
Fair 0.203 0.222 0.169 0.216 0.168
Poor 0.0212 0.0257 0.0132 0.0239 0.0137
Province
Heilongjiang 0.134 0.129 0.141 0.147 0.0972
Liaoning 0.0788 0.0825 0.0721 0.0816 0.0708
Jiangsu 0.129 0.125 0.137 0.136 0.110
Shandong 0.0851 0.0785 0.0967 0.0833 0.0900
Henan 0.111 0.0980 0.133 0.106 0.124
Hubei 0.118 0.120 0.113 0.121 0.108
Hunan 0.0913 0.107 0.0625 0.0887 0.0982
Guangxi 0.127 0.151 0.0845 0.121 0.143
Guizhou 0.127 0.109 0.160 0.116 0.159
CHNS Wave
1997 0.242 0.243 0.241 0.244 0.237
2000 0.208 0.212 0.200 0.210 0.199
2004 0.272 0.270 0.277 0.269 0.282
2006 0.278 0.275 0.282 0.276 0.281
found in column (1) includes all individuals in our data. Column (2) only includes those who were not affected by China’s CSL (individuals who were older than 15 at the time of its implementation in their province). Column (3) only includes those who were affected by China’s CSL. Similarly, columns (4) and (5) includes those who were unaffected and affected by The Provisions, respectively.
5
Results
5.1
OLS estimates of the impact of individual educational
attain-ment on earnings
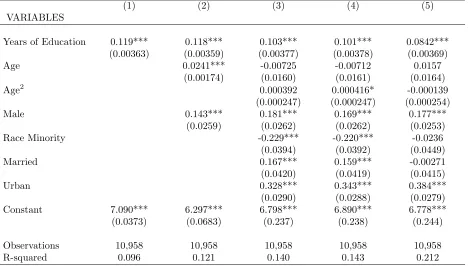
[image:11.612.75.543.376.642.2]Table 2 displays OLS estimates of the effect of years of education on individual wages. These estimates imply that an extra year of individual educational attainment is on average associated with an 8.42% increase in individual wages. These OLS estimates seem to be just a little bit higher than OLS estimates presented in other Western studies (Card 1999); however, they are relatively consistent to OLS estimates presented in Fang et. al (2012).
Table 2: OLS Results. Dependent Variable: Natural Logarithm of Individual Wages (2006 Yuan)
(1) (2) (3) (4) (5)
VARIABLES
Years of Education 0.119*** 0.118*** 0.103*** 0.101*** 0.0842***
(0.00363) (0.00359) (0.00377) (0.00378) (0.00369)
Age 0.0241*** -0.00725 -0.00712 0.0157
(0.00174) (0.0160) (0.0161) (0.0164)
Age2 0.000392 0.000416* -0.000139
(0.000247) (0.000247) (0.000254)
Male 0.143*** 0.181*** 0.169*** 0.177***
(0.0259) (0.0262) (0.0262) (0.0253)
Race Minority -0.229*** -0.220*** -0.0236
(0.0394) (0.0392) (0.0449)
Married 0.167*** 0.159*** -0.00271
(0.0420) (0.0419) (0.0415)
Urban 0.328*** 0.343*** 0.384***
(0.0290) (0.0288) (0.0279)
Constant 7.090*** 6.297*** 6.798*** 6.890*** 6.778***
(0.0373) (0.0683) (0.237) (0.238) (0.244)
Observations 10,958 10,958 10,958 10,958 10,958
R-squared 0.096 0.121 0.140 0.143 0.212
Robust standard errors in parentheses
*** p<0.01, ** p<0.05, * p<0.1
unknown. In the following sections, we present results from instrumental variables regressions which have the potential to eliminate said biases.
5.2
Instrumental Variable estimates for the impact of individual
educational attainment on earnings (Compulsory Schooling
Law)
Our first approach is very similar to that of Fang et. al (2012). We first proceed by using China’s CSL as an instrument for individual educational attainment. The instrument is a dummy variable which equals 1 if the individual was less than 15 years old on the law’s effective date in the individual’s province and equal to 0 otherwise.
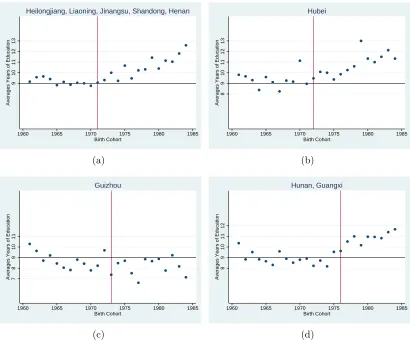
Before we rigorously test whether the compulsory schooling laws affected individual educa-tional attainment in our first stage regressions, we present two figures which graphs average years of education by birth-year cohort.
9
10
11
12
13
Averages Years of Education
1960 1965 1970 1975 1980 1985 Birth Cohort
Heilongjiang, Liaoning, Jinangsu, Shandong, Henan
(a)
8
9
10
11
12
13
Averages Years of Education
1960 1965 1970 1975 1980 1985 Birth Cohort
Hubei
(b)
7
8
9
10
11
Averages Years of Education
1960 1965 1970 1975 1980 1985 Birth Cohort
Guizhou
(c)
8
9
10
11
12
Averages Years of Education
1960 1965 1970 1975 1980 1985 Birth Cohort
Hunan, Guangxi
[image:12.612.101.511.312.657.2](d)
In Figure 1, we divide the provinces into four different groups by the year in which the province implemented the compulsory schooling law. Panel (a), (b), (c), and (d) contain provinces which implemented the compulsory schooling law in 1986, 1987, 1988, and 1991, respectively. In each panel, a horizontal line is drawn at 9 years of education, the minimum years of education stipulated by the compulsory schooling law. Furthermore, a vertical line is drawn at the year when the individual born would have been 15 by the time the compulsory schooling law was implemented in the province. For example, in panel (a), the compulsory schooling law was implemented in 1986, so the vertical line is drawn at year 1971. We notice that in almost all of the provinces, there is a clear cutoff at the point where the vertical line is drawn. To the left – for individuals older than 15 at the time the compulsory schooling law was implemented, there does not seem to be any apparent trend. However, to the right of the vertical line – for individuals younger than 15 at the time the compulsory schooling law was implemented, there seems to be a clear positive trend. The one exception is Guizhou which does not seem to have any trends to the right or left of the vertical line.
6
8
10
12
14
Averages Years of Education
1960 1965 1970 1975 1980 1985 Birth Cohort
Heilongjiang, Liaoning, Jiangsu, Shandong, Henan Hubei Guizhou Hunan, Guangxi
All Provinces
(a)
8
9
10
11
12
13
Averages Years of Education
1960 1965 1970 1975 1980 1985 Birth Cohort
Heilongjiang, Liaoning, Jiangsu, Shandong, Henan Hubei Hunan, Guangxi
All Provinces except Guizhou
(b)
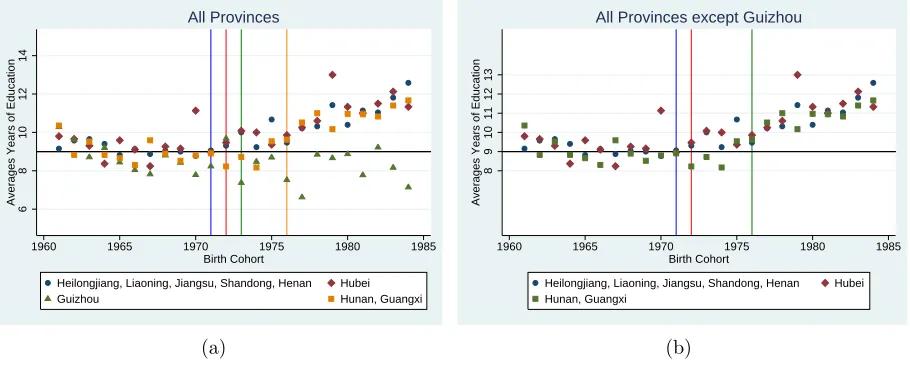
Figure 2: (a) All Provinces overlaid on each other, (b) All Provinces except for Guizhou.
Figure 2 overlays the graphs from figure 1 together. Panel (a) shows all the provinces to-gether, and panel (b) shows all the provinces except for Guizhou. In panel (b), the pattern is much more obvious; there seems to be no trend in individual educational attainment for individuals older than 15 at the time the compulsory schooling law was implemented. How-ever, for individuals younger than 15, there seems to be a very positive trend. It is still unknown as to why Guizhou does not experience a similar pattern. Possible reasons could include that enforcement of the compulsory schooling law in Guizhou was relatively weak compared to the other provinces.
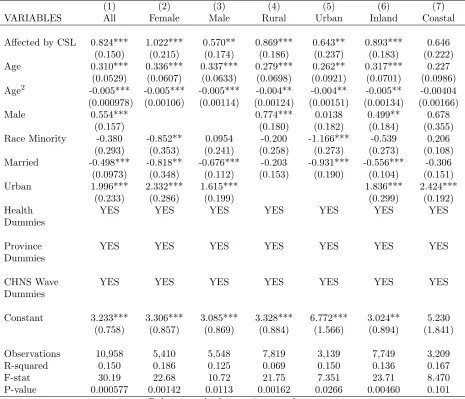
[image:13.612.81.536.295.479.2]completed is very statistically significant.
Table 3: First Stage Results.
Instrument: Compulsory Schooling Law.
Dependent Variable: Completed Years of Schooling. Standard Errors Clustered by Province
(1) (2) (3) (4) (5) (6) (7)
VARIABLES All Female Male Rural Urban Inland Coastal
Affected by CSL 0.824*** 1.022*** 0.570** 0.869*** 0.643** 0.893*** 0.646
(0.150) (0.215) (0.174) (0.186) (0.237) (0.183) (0.222)
Age 0.310*** 0.336*** 0.337*** 0.279*** 0.262** 0.317*** 0.227
(0.0529) (0.0607) (0.0633) (0.0698) (0.0921) (0.0701) (0.0986)
Age2 -0.005*** -0.005*** -0.005*** -0.004** -0.004** -0.005** -0.00404
(0.000978) (0.00106) (0.00114) (0.00124) (0.00151) (0.00134) (0.00166)
Male 0.554*** 0.774*** 0.0138 0.499** 0.678
(0.157) (0.180) (0.182) (0.184) (0.355)
Race Minority -0.380 -0.852** 0.0954 -0.200 -1.166*** -0.539 0.206
(0.293) (0.353) (0.241) (0.258) (0.273) (0.273) (0.108)
Married -0.498*** -0.818** -0.676*** -0.203 -0.931*** -0.556*** -0.306
(0.0973) (0.348) (0.112) (0.153) (0.190) (0.104) (0.151)
Urban 1.996*** 2.332*** 1.615*** 1.836*** 2.424***
(0.233) (0.286) (0.199) (0.299) (0.192)
Health YES YES YES YES YES YES YES
Dummies
Province YES YES YES YES YES YES YES
Dummies
CHNS Wave YES YES YES YES YES YES YES
Dummies
Constant 3.233*** 3.306*** 3.085*** 3.328*** 6.772*** 3.024** 5.230
(0.758) (0.857) (0.869) (0.884) (1.566) (0.894) (1.841)
Observations 10,958 5,410 5,548 7,819 3,139 7,749 3,209
R-squared 0.150 0.186 0.125 0.069 0.150 0.136 0.167
F-stat 30.19 22.68 10.72 21.75 7.351 23.71 8.470
P-value 0.000577 0.00142 0.0113 0.00162 0.0266 0.00460 0.101
Robust standard errors in parentheses
*** p<0.01, ** p<0.05, * p<0.1
in low-skilled labor and would have likely been encouraged to drop out of school earlier to learn relevant trade skills.
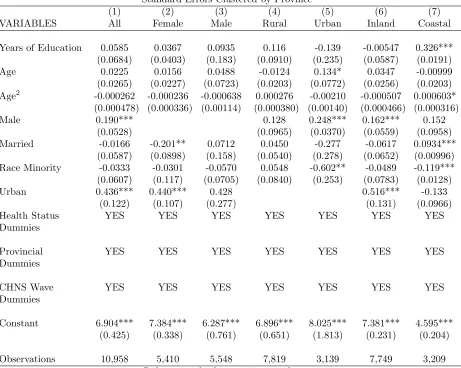
Next, Table 4 presents 2SLS results, estimating the effect of individual educational attain-ment on earnings using the effect of the CSL as an instruattain-ment for individual educational attainment.
Using China’s CSL as an instrument for individual educational attainment, we fail to find overall statistically significant evidence for the effect of education on earnings. As Column 1 of Table 4 suggests, the overall impact of an increase in individual educational attainment by 1 year was, on average, associated with about 5.8% increase in wages. However, this estimate is not significant at any conventional levels of statistical significance.
We acknowledge that column 7 of Table 4 suggests that an increase in individual educational attainment of 1 year in a coastal province is on average associated with 32.6% increase in wages. This estimate should also be viewed with caution as it is much higher than estimates found in the existing literature. Certainly, since the standard errors are quite large, the 95% confidence interval for the estimate on years of education in a Coastal province is (0.026, 0.626); thus, we cannot reject an estimate of a more reasonable estimate such as 11% found for the rural sub-population.
Table 4: Instrumental Variables (2SLS) Estimations.
Instrument: Compulsory Schooling Law. Dependent Variable: Natural Log of Earnings
Standard Errors Clustered by Province
(1) (2) (3) (4) (5) (6) (7)
VARIABLES All Female Male Rural Urban Inland Coastal
Years of Education 0.0585 0.0367 0.0935 0.116 -0.139 -0.00547 0.326***
(0.0684) (0.0403) (0.183) (0.0910) (0.235) (0.0587) (0.0191)
Age 0.0225 0.0156 0.0488 -0.0124 0.134* 0.0347 -0.00999
(0.0265) (0.0227) (0.0723) (0.0203) (0.0772) (0.0256) (0.0203)
Age2 -0.000262 -0.000236 -0.000638 0.000276 -0.00210 -0.000507 0.000603*
(0.000478) (0.000336) (0.00114) (0.000380) (0.00140) (0.000466) (0.000316)
Male 0.190*** 0.128 0.248*** 0.162*** 0.152
(0.0528) (0.0965) (0.0370) (0.0559) (0.0958)
Married -0.0166 -0.201** 0.0712 0.0450 -0.277 -0.0617 0.0934***
(0.0587) (0.0898) (0.158) (0.0540) (0.278) (0.0652) (0.00996)
Race Minority -0.0333 -0.0301 -0.0570 0.0548 -0.602** -0.0489 -0.119***
(0.0607) (0.117) (0.0705) (0.0840) (0.253) (0.0783) (0.0128)
Urban 0.436*** 0.440*** 0.428 0.516*** -0.133
(0.122) (0.107) (0.277) (0.131) (0.0966)
Health Status YES YES YES YES YES YES YES
Dummies
Provincial YES YES YES YES YES YES YES
Dummies
CHNS Wave YES YES YES YES YES YES YES
Dummies
Constant 6.904*** 7.384*** 6.287*** 6.896*** 8.025*** 7.381*** 4.595***
(0.425) (0.338) (0.761) (0.651) (1.813) (0.231) (0.204)
Observations 10,958 5,410 5,548 7,819 3,139 7,749 3,209
Robust standard errors in parentheses
*** p<0.01, ** p<0.05, * p<0.1
5.3
Instrumental Variable estimates of the impact of individual
educational attainment on earnings (Provisions on the
Prohi-bition of Using Child Labor)
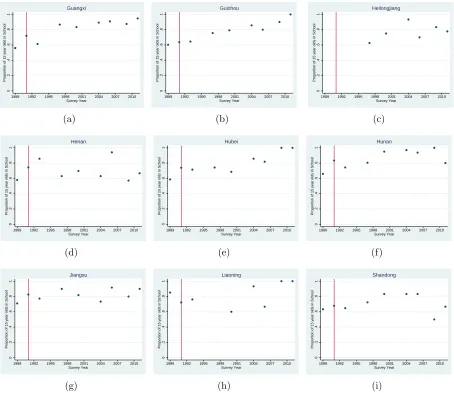
0 .2 .4 .6 .8 1
Proportion of Children Under 16 Working
1989 1992 1995 1998 2001 2004 2007 2010 Survey Year Guangxi (a) 0 .2 .4 .6 .8 1
Proportion of Children Under 16 Working
1989 1992 1995 1998 2001 2004 2007 2010 Survey Year Guizhou (b) 0 .2 .4 .6 .8 1
Proportion of Children Under 16 Working
1989 1992 1995 1998 2001 2004 2007 2010 Survey Year Heilongjiang (c) 0 .2 .4 .6 .8 1
Proportion of Children Under 16 Working
1989 1992 1995 1998 2001 2004 2007 2010 Survey Year Henan (d) 0 .2 .4 .6 .8 1
Proportion of Children Under 16 Working
1989 1992 1995 1998 2001 2004 2007 2010 Survey Year Hubei (e) 0 .2 .4 .6 .8 1
Proportion of Children Under 16 Working
1989 1992 1995 1998 2001 2004 2007 2010 Survey Year Hunan (f) 0 .2 .4 .6 .8 1
Proportion of Children Under 16 Working
1989 1992 1995 1998 2001 2004 2007 2010 Survey Year Jiangsu (g) 0 .2 .4 .6 .8 1
Proportion of Children Under 16 Working
1989 1992 1995 1998 2001 2004 2007 2010 Survey Year Liaoning (h) 0 .2 .4 .6 .8 1
Proportion of Children Under 16 Working
1989 1992 1995 1998 2001 2004 2007 2010 Survey Year
Shandong
(i)
Figure 3: Effect of Provisions by province. Heilongjiang, panel (c), only contains data for survey waves 1997 onwards.
[image:17.612.83.534.74.472.2]Figure 4: Effect of the Provisions in all Provinces
0
.2
.4
.6
.8
1
Proportion of Children Under 16 Working 1989 1992 1995 1998Survey Year2001 2004 2007 2010
Heilongjiang Liaoning Jiangsu Shandong Henan Hubei Hunan Guangxi Guizhou
Effect of the Provisions. All Provinces
Figure 5 displays the effect of the Provisions on schooling by each province. In this figure, we examine the proportion of 15 year old children still in school by each survey wave. A vertical line is again drawn at 1991, the year in which the Provisions were implemented. Figure 6 displays the same effect except separates each individual province into different panels. As Figure 5 and 6 might suggest, it seems that the Provisions also encouraged individual educational attainment – more 15 year old children seem to stay in school after the Provisions were passed.
Figure 5: Effect of the Provisions in all Provinces
0
.2
.4
.6
.8
1
Proportion of 15 year olds in School 1989 1992 1995 1998 2001 2004 2007 2010
Survey Year
Heilongjiang Liaoning Jiangsu Shandong Henan Hubei Hunan Guangxi Guizhou
[image:18.612.149.465.95.327.2] [image:18.612.148.463.486.706.2]0 .2 .4 .6 .8 1
Proportion of 15 year olds in School
1989 1992 1995 1998 2001 2004 2007 2010 Survey Year Guangxi (a) 0 .2 .4 .6 .8 1
Proportion of 15 year olds in School
1989 1992 1995 1998 2001 2004 2007 2010 Survey Year Guizhou (b) 0 .2 .4 .6 .8 1
Proportion of 15 year olds in School
1989 1992 1995 1998 2001 2004 2007 2010 Survey Year Heilongjiang (c) 0 .2 .4 .6 .8 1
Proportion of 15 year olds in School
1989 1992 1995 1998 2001 2004 2007 2010 Survey Year Henan (d) 0 .2 .4 .6 .8 1
Proportion of 15 year olds in School
1989 1992 1995 1998 2001 2004 2007 2010 Survey Year Hubei (e) 0 .2 .4 .6 .8 1
Proportion of 15 year olds in School
1989 1992 1995 1998 2001 2004 2007 2010 Survey Year Hunan (f) 0 .2 .4 .6 .8 1
Proportion of 15 year olds in School
1989 1992 1995 1998 2001 2004 2007 2010 Survey Year Jiangsu (g) 0 .2 .4 .6 .8 1
Proportion of 15 year olds in School
1989 1992 1995 1998 2001 2004 2007 2010 Survey Year Liaoning (h) 0 .2 .4 .6 .8 1
Proportion of 15 year olds in School
1989 1992 1995 1998 2001 2004 2007 2010 Survey Year
Shandong
(i)
Figure 6: Effect of Provisions on educational decisions of 15 year olds by province. Hei-longjiang, panel (c), only contains data for survey waves 1997 onwards.
Although we do not present the analysis here, one addition consideration would be to com-bine the analyses conducted in Figure 3, 4, 5, and 6. More specifically, it is plausible to believe that provinces with different proportions of children younger than 16 pre-1991 will be affected differently by the Provisions post-1991.
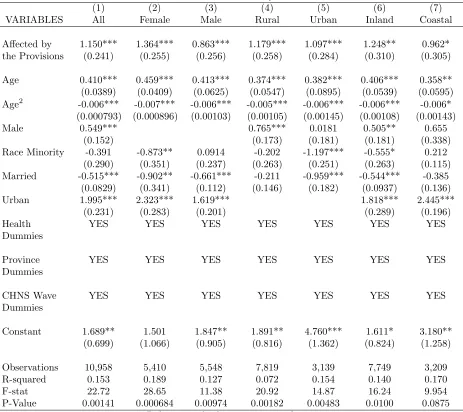
[image:19.612.80.534.75.468.2]the individual was less than 16 at the time of the implementation of the Provisions, and 0 otherwise.
[image:20.612.76.539.251.663.2]The effect of The Provisions on individual educational attainment, as shown in Table 5, seem to be greater than the effect of the CSL, as shown in Table 3. This seems reasonable; as mentioned in Section 2.1, the Provisions were enforced much more strictly than the CSL. In aggregate, our estimates imply that being affected by the Provisions, on average, increased individual educational attainment by about 1.1 years. Results vary by sub-population.
Table 5: First Stage Results.
Instrument: The Provisions. Dependent Variable: Completed Years of Schooling
Standard Errors Clustered by Province
(1) (2) (3) (4) (5) (6) (7)
VARIABLES All Female Male Rural Urban Inland Coastal
Affected by 1.150*** 1.364*** 0.863*** 1.179*** 1.097*** 1.248** 0.962*
the Provisions (0.241) (0.255) (0.256) (0.258) (0.284) (0.310) (0.305)
Age 0.410*** 0.459*** 0.413*** 0.374*** 0.382*** 0.406*** 0.358**
(0.0389) (0.0409) (0.0625) (0.0547) (0.0895) (0.0539) (0.0595)
Age2 -0.006*** -0.007*** -0.006*** -0.005*** -0.006*** -0.006*** -0.006*
(0.000793) (0.000896) (0.00103) (0.00105) (0.00145) (0.00108) (0.00143)
Male 0.549*** 0.765*** 0.0181 0.505** 0.655
(0.152) (0.173) (0.181) (0.181) (0.338)
Race Minority -0.391 -0.873** 0.0914 -0.202 -1.197*** -0.555* 0.212
(0.290) (0.351) (0.237) (0.263) (0.251) (0.263) (0.115)
Married -0.515*** -0.902** -0.661*** -0.211 -0.959*** -0.544*** -0.385
(0.0829) (0.341) (0.112) (0.146) (0.182) (0.0937) (0.136)
Urban 1.995*** 2.323*** 1.619*** 1.818*** 2.445***
(0.231) (0.283) (0.201) (0.289) (0.196)
Health YES YES YES YES YES YES YES
Dummies
Province YES YES YES YES YES YES YES
Dummies
CHNS Wave YES YES YES YES YES YES YES
Dummies
Constant 1.689** 1.501 1.847** 1.891** 4.760*** 1.611* 3.180**
(0.699) (1.066) (0.905) (0.816) (1.362) (0.824) (1.258)
Observations 10,958 5,410 5,548 7,819 3,139 7,749 3,209
R-squared 0.153 0.189 0.127 0.072 0.154 0.140 0.170
F-stat 22.72 28.65 11.38 20.92 14.87 16.24 9.954
P-Value 0.00141 0.000684 0.00974 0.00182 0.00483 0.0100 0.0875
Robust standard errors in parentheses
Table 6: Instrumental Variables (2SLS) Estimations.
Instrument: The Provisions. Dependent Variable: Natural Log of Earnings
Standard Errors Clustered by Province
(1) (2) (3) (4) (5) (6) (7)
VARIABLES All Female Male Rural Urban Inland Coastal
Years of Education 0.0898* 0.0477 0.161 0.0317 0.254*** 0.0722* 0.159
(0.0549) (0.0484) (0.106) (0.0642) (0.0983) (0.0406) (0.143)
Age 0.0142 0.0123 0.0288 0.00676 0.0451 0.0148 0.0249
(0.0283) (0.0243) (0.0561) (0.0231) (0.0585) (0.0251) (0.0533)
Age2 -0.000113 -0.000173 -0.000331 -6.36e-05 -0.000340 -0.000163 -0.000127
(0.000511) (0.000434) (0.000881) (0.000439) (0.00103) (0.000435) (0.00107)
Male 0.174*** 0.191** 0.246*** 0.125** 0.260***
(0.0577) (0.0830) (0.0667) (0.0623) (0.0446)
Married 0.000271 -0.190** 0.117 0.0245 0.102 -0.0164 0.0311
(0.0593) (0.0878) (0.127) (0.0485) (0.164) (0.0699) (0.0608)
Race Minority -0.0215 -0.0207 -0.0641 0.0389 -0.142 -0.00723 -0.083***
(0.0677) (0.0802) (0.0592) (0.0656) (0.126) (0.0856) (0.0313)
Urban 0.373*** 0.414*** 0.317** 0.371*** 0.274
(0.119) (0.136) (0.157) (0.0774) (0.395)
Health Status YES YES YES YES YES YES YES
Dummies
Provincial YES YES YES YES YES YES YES
Dummies
CHNS Wave YES YES YES YES YES YES YES
Dummies
Constant 6.750*** 7.328*** 5.993*** 7.326*** 4.861*** 6.996*** 5.678***
(0.264) (0.404) (0.402) (0.391) (0.654) (0.237) (0.630)
Observations 10,958 5,410 5,548 7,819 3,139 7,749 3,209
Robust standard errors in parentheses
*** p<0.01, ** p<0.05, * p<0.1
As Table 6 shows, using The Provisions as an instrument for individual educational attain-ment yields different results than using China’s CSL as an instruattain-ment. As column 1 shows, in aggregate, the 2SLS estimate implies that an extra year of education is, on average, as-sociated with about a 9% increase in wages. In it of itself, this estimate seems to be very reasonable – it is very similar to estimates produced in Western studies (Card 1999). How-ever, it is only significant at the 10% level.
We note that these estimates should be viewed with caution as these regressions do not necessarily account for overall time trends adequately. Robustness checks on these estimates and instruments are still being considered.
5.4
Instrumental Variable estimates of the impact of individual
educational attainment on earnings (Quarter of Birth)
In this section, we explore the possibility of using quarter of birth as an instrument for in-dividual educational attainment. Table 7 depicts first stage results of quarter of birth as an instrument.
A priori, we believe that the Provisions may have generated some variation in individual educational attainment by quarter of birth. If the effect of the Provisions is significant, then we expect that students will stay in school until age 16. If this is the case, then the Provisions establish a minimum dropout age similar to the compulsory schooling laws that Angrist and Krueger (1991) examine in the United States. Thus, the regressions shown in Table 7 only includes individuals who are affected by the Provisions. This is because we have no reason to believe that individuals not affected by the Provisions would have any variation in individual educational attainment by quarter of birth because there was no previous minimum dropout age.
Table 7: First Stage Regression.
Instrument: Quarter of Birth. Dependent Variable: Years of Education
Standard Errors Clustered by Province
(1) (2) (3) (4) (5)
VARIABLES
Born 1st Quarter -0.158 -0.0932
(0.143) (0.130)
Born 2nd Quarter -0.0581 0.0262
(0.190) (0.170)
Born 3rd Quarter -0.166 -0.118
(0.183) (0.190)
Born 4th Quarter 0.127
(0.128)
Age 1.269*** 1.273*** 1.272*** 1.268*** 1.270***
(0.0680) (0.0639) (0.0647) (0.0672) (0.0633)
Age2 -0.0254*** -0.0255*** -0.0255*** -0.0254*** -0.0254***
(0.00170) (0.00162) (0.00163) (0.00169) (0.00160)
Male -0.184 -0.182 -0.182 -0.183 -0.182
(0.157) (0.158) (0.159) (0.159) (0.158)
Race Minority -0.389* -0.388* -0.391* -0.393* -0.389*
(0.176) (0.175) (0.176) (0.175) (0.177)
Married -0.632*** -0.637*** -0.633*** -0.628*** -0.634***
(0.165) (0.161) (0.159) (0.164) (0.156)
Urban 2.282*** 2.276*** 2.274*** 2.277*** 2.281***
(0.279) (0.277) (0.276) (0.279) (0.278)
Health Status YES YES YES YES YES
Dummies
Provincial YES YES YES YES YES
Dummies
CHNS Wave YES YES YES YES YES
Dummies
Constant -6.945*** -7.053*** -7.060*** -6.986*** -7.086***
(0.644) (0.614) (0.600) (0.683) (0.633)
Observations 2,923 2,923 2,923 2,923 2,923
R-squared 0.303 0.303 0.303 0.303 0.303
F-stat 1.200 0.510 0.0239 0.386 0.985
P-value 0.370 0.495 0.881 0.551 0.350
Robust standard errors in parentheses
*** p<0.01, ** p<0.05, * p<0.1
6
Conclusion
Prohi-bition of using Child Labor was passed which protected youths from harmful labor practices and established a minimum working age of 16. Illiteracy rates in China have dropped from 22.8% during the 1980’s to 7.9% in 2005 (Wang 2011). Over a similar time period, China’s average annual real GDP growth was 9.9% from 1979 to 2011 (Morrison 2012). Yet, both the private and social return to education in China remains an open question.
At the same time, it is important to understand the role of education in economic develop-ment in China. Especially in light of the series of socioeconomic reforms during the 1980’s, understanding China’s case has definite policy implications for other developing countries.
In this paper, we examine two policies implemented at the vanguard of China’s socioeconomic reformation: the Compulsory Schooling Law of 1986 and the Provisions on the Prohibition of using Child Labor of 1991. We first test whether each of these policies affected individual educational attainment. Second, we use the implementation of these policies as instruments for individual educational attainment to estimate the return to education in China.
Our first finding is that it seems that each of these policies did statistically significantly raise individual educational attainment. In aggregate, China’s compulsory schooling law raised educational attainment by about 0.82 years. Similarly, The Provisions raised educa-tional attainment by over 1 year.
Second, we fail to find statistically significant evidence that years of education affected earnings when using the compulsory schooling law as an instrument. This is in stark con-trast to Fang et. al (2012) who find that the return to education was about 20% in aggregate.
Third, we do find slightly statistically significant evidence that years of education affected earnings when using the Provisions as an instrument for individual educational attainment. In aggregate, we find that an extra year of education is associated with about a 9% increase in wages – an estimate that is highly consistent with those presented in other Western studies (Card 1999). Estimates vary considerably across sub-populations.
Fourth, we test the possibility of using quarter of birth as an instrument for individual educational attainment. However, we find no statistically significant evidence that quarter of birth can be a viable instrument in China’s case.
Finally, we conclude that estimates presented in this paper thus far must be viewed with caution. We have several causes for concern and we hope to build on this literature in the following manner. First, we aim to reconcile the stark differences between our results and those of Fang et. al (2012)’s. Although it seems that we have used the same data set, created the instrument equivalently, used the same set of controls, achieved similar first stage re-sults, 2SLS results when using the compulsory schooling law as an instrument are extremely different.
during the time period under consideration, thus we must be cautious in separating year-trend effects as opposed to the causal effect due to education.
Third, we hope to find a plausible strategy for estimating the social returns to education. We had hoped to utilize a strategy similar to that of Acemoglu and Angrist (2000) who ex-ploit state-level differences in compulsory schooling laws to create an instrument to estimate the social returns to education. However, as Figure 1 and 2 might suggest, it doesn’t seem that in China’s case, the province-level differences in the implementation of the compulsory schooling law would have generated sufficient provincial-level variation to use a similar strat-egy.
This study ultimately aims to provide updated results for the causal impact of individ-ual educational attainment on earnings in modern China. Demonstrating the returns to education in China is important from a policy standpoint not only in China but also in other developing countries. More accurate estimates may even ultimately contribute to the literature of cross-country income disparities and how much are due to differences in human capital.
References
[1] Acemoglu, D., and Angrist, J.D. (2000). How Large are Human-Capital Externalities?
Evidence from Compulsory Schooling Laws NBER Macroeconomics Annual. Vol. 15
(2000), pp. 9-59.
[2] Angrist, J.D., and Krueger, A.B. (1991). Does compulsory school attendance affect
schooling and earnings? Quarterly Journal of Economics. 106, 979-1014.
[3] Ashenfelter, O., and Rouse, C. (1998). Income, Schooling, and Ability: Evidence from a
New Sample of Identical Twins Quarterly Journal of Economics. 113(1), 253-284.
[4] Buckles, K., and Hungerman D.M. (2008) Season of Birth and Later Outcomes: Old
Questions, New Answers NBER Working Paper, No. 14573
[5] Byron, R.P., and Manaloto, E.Q. (1990). Returns to education in China Economic
De-velopment and Cultural Change. 38(4), 783-796.
[6] Card, D., (1995). Using Geographic Variation in College Proximity to Estimate the
Return to Schooling. In Christofides LN, Grant Kenneth, Swidinsky R eds. Aspects of
Labor Market Behaviour: Essays in Honour of John Vanderkamp, University of Toronto Press: Toronto Canada, pp. 201-222.
[7] Child Labour Bulletin (2007). Small Hands: A Survey Report on Child Labour in China. Hong Kong
[9] Fang, H., Eggleston, K. N., Rizzo, J. A., Rozelle, S., and Zeckhauser, R.J. (2012). The Returns to Education in China: Evidence From the 1986 Compulsory Education Law.
NBER Working Paper, No. 18189.
[10] Johnson, E.N., and Chow, G.C. (1997). Rates of return to schooling in China. Pacific
Economic Review. 2(2), 101-113.
[11] Liu, F. (2004). Basic education in China’s rural areas: a legal obligation or an individual
choice? International Journal of Economic Development. 24(1), 5-21.
[12] Mincer, J. (1974). Schooling, Experience, and Earnings. Columbia University Press: New York.
[13] Morrison, W. M. (2012) China’s Economic Conditions. Congressional Research Service
Issue Brief for Congress.
[14] Oreopoulos, P. (2006). The Compelling Effects of Compulsory Schooling: Evidence from
Canada.The Canadian Journal of Economics / Revue canadienne d’Economique ,39(1),
22-52.
[15] Song, Y. (2012). Poverty reduction in China: The contribution of popularizing primary
education. China & World Economy, 20(1), 105-122.
[16] Wang, Feng. (2011). The Future of a Demographic Overachiever: Long-Term
Implica-tion of the Demographic TransiImplica-tion in China. Population and Development Review 37
(Supplement. 173-90.
[17] Xie, S., and Mo, T. (2014). The Impact of Education on Health in China. China
Eco-nomic Review.
[18] Zhang, J., Zhao Y., Park, A., Song, X. (2005). Economic returns to schooling in urban