http://www.scirp.org/journal/ijoc ISSN Online: 2161-4695
ISSN Print: 2161-4687
Synthesis of Chiral Schiff Base Metal Complex
Inducing CD and Elucidation of Structure of
Adsorption on Surface of Gold Nanoparticles
Minako Oshima, Minoru Matsuno, Tsutsumi Yuki, Sunaga Nobumitsu, Tomoyuki Haraguchi,
Takashiro Akitsu
*Department of Chemistry, Faculty of Science, Tokyo University of Science, Tokyo, Japan
Abstract
We have prepared supramolecular systems of chiral Schiff base Ni(II), Cu(II), Zn(II) complexes and colloidal gold nanoparticles (AuNP) of 10 nm diame-ters. They demonstrated that direct adsorption of chiral Schiff base metal complex on the surface of AuNP owing to observation of clear induced CD spectra for the first time. We observed and discussed induced CD bands on AuNP from chiral Schiff base Ni(II), Cu(II), Zn(II) complexes.
Keywords
Chiral Schiff Base Metal Complex, Gold Nanoparticle
1. Introduction
Metal nanoparticles including gold nanoparticleshave been a subject of research and applications in various fields because it has unique properties of surface plasmon resonance (SPR). There are many types of plasmonic concepts and ap-plications. For example, the plasmon concept of the refractive index change is applied to the refractive index sensing [1] [2] and then the plasmon concept of hot electron transfer is conductivity and catalysis [3] [4] [5]. In addition, the plasmon concept of plasmon resonance energy transition is applied to SER and SERS [6] [7] [8] [9] [10] and then the plasmon concept of multiphoton photo-luminescence is used to light-emitting systems [11], the concept of magnetic plasmon propagation is used to plasmonic antiferromagnetism [12]. The con-cept of chiral dipole-dipole coupling has been applied to optically active plasmon
[13] [14] [15] [16].
Recently, induced CD on metal nanoparticles from chiral additive molecules
How to cite this paper: Oshima, M., Mat-suno, M., Yuki, T., Nobumitsu, S., Hara-guchi, T. and Akitsu, T. (2017) Synthesis of Chiral Schiff Base Metal Complex Inducing CD and Elucidation of Structure of Ad-sorption on Surface of Gold Nanoparticles. International Journal of Organic Chemi-stry, 7, 153-170.
https://doi.org/10.4236/ijoc.2017.72013
Received: May 19, 2017 Accepted: June 19, 2017 Published: June 22, 2017
Copyright © 2017 by authors and Scientific Research Publishing Inc. This work is licensed under the Creative Commons Attribution International License (CC BY 4.0).
including biomolecules [17] have been attracted much attention in the field of nano-chirality [18] [19] [20], which are beyond conventional framework of chi-rality of micro-matters [21]. In principle, intensity of induced CD increases or decreases depending on parallel and perpendicular arrangement of transition moments of metal nanoparticles and chiral additive molecules, respectively [20]. However, actual situation of supramolecular systems of metal nanoparticles and chiral additives are more complicated. Although some metal nanoparticles exhi-bit chiroptical properties [22], addition of chiral additives onto achiral metal nanoparticles may be significant due to their potential applications for chiral catalysts [23]. Elucidation of the adsorption structure of the gold and the chiral additives and its effects are also an important concern (Scheme 1) [24] [25] [26].
To date we have reported induced CD due to chiral Schiff base metal com-plexes onto various materials, for example, achiral Schiff base metal comcom-plexes
[27], achiral ferrocene [28], metallodendrimers and metal nanoclusters made in them [29] [30], nanoparticles of metal semiconductors [31]. Some chiral Schiff base complexes have large electronic transition dipole moment, but less induced CD can be observed experimentally. As for copper nanoparticles made in metal-lodendrimers [31] [32] disagreement between experimental results [32] and theoretical dipole moment [33] may be attributed to molecular recognition of chiral additives onto particle surfaces [34]. Moreover, some chiral metal com-plexes exhibited weaken induced CD [35] because of arrangement of dipole mo-lecules of both species.
Practically, chiral AuNP catalysts will be expected as candidate materials for organic silanol reaction that has been used as an attractive nucleophile agent mainly. There may be three reaction acts as nucleophile agent of silanol. The first is used as a bond formation or base by nucleophilic reaction of silanol oxy-gen. The second is a specific reaction of the neighboring functional groups that use the interaction between the hydroxyl group and a metal compound. And the third is a molecule conversion utilizing specific reactivity of the silicon-bonded carbon one based on the presence of silanol hydroxyl groups. In this way, silanol
might be attractive as a nucleophile agent. Moreover, the expected co-product must be hydrogen gas in the synthesis process, which is ideal in terms of the en-vironment.
Herein we have successfully observed considerably intense induced CD dem-onstrated onto AuNP in plasmon region due to chiral Schiff base Ni(II), Cu(II), and Zn(II) complexes (compound 1a-1c) for the first time. With a different li-gand complex of by synthesizing eleven compounds (compound 2a-5c) includ-ing compound 1a-1c (Scheme 2), we compared the differences of the induced CD. Using a TD-DFT we predicted adsorption structure.
2. Methods and Experimental Details
2.1. Preparation of Complexes
We prepared eleven compounds has various ligands. Compounds 1a, 1b and 1c were prepared according to the literature procedure [36]. Compounds 2a and 2b were prepared according to the literature procedure [37]. Compound 4 was pre-pared according to the literature procedure [38].
Preparation of 2c: To a solution of salicylaldehyde (0.244 g, 2.00 mmol) dis-solved in methanol (40 mL), (1R,2R)-(+)-1,2-Diphenylethylenediamine (0.212 g, 1.00 mmol) was added and stirred at 313 K for 2 h to give yellow solution of li-gand. Zinc(II) acetate dehydrate (0.220 g, 1.00 mmol) was added to the resulting solution and stirring at 313 K for 2 h to give yellow solution of the complex. Af-ter cooling the solution, this yellow compound was filAf-tered. Yield 0.302 g (61.4%). Anal. Found: C, 56.27; H, 5.25; N, 54.53%. Calc. for C28H22N2O2Zn: C,
59.15; H, 5.42; N, 4.18%. IR (KBr (cm-1)): 1627 (C=N). UV-Vis (diffuse reflec-tance) peak/nm; 391. CD (KBr) peak/nm; 383.
Preparation of 3: To a solution of 2,3-Dihydroxybenzaldehyde (0.276 g, 2.00 mmol) dissolved in methanol(40 mL), (1R,2R)-(+)-1,2-Diphenylethylenedia- mine (0.212 g, 1.00 mmol) was added and stirred at 313 K for 2 h to give brown solution of ligand. Copper(II) acetate monohydrate(0.200 g, 1.00 mmol) was added to the resulting solution and stirring at 313 K for 2 h to give brown solu-tion of the complex. After cooling the solusolu-tion, this brown compound was fil
tered. Yield 0.412 g (77.7%). Anal. Found: C, 65.59; H, 4.61; N, 5.37%. Calc. for C28H22N2O4Cu: C, 65.42; H, 4.31; N, 5.45%. IR (KBr(cm−1)): 1617 (C=N),3417
(OH). UV-Vis (diffuse reflectance) peak/nm; 446, 574. CD (KBr) peak/nm ; 434, 610.
Preparation of 5a: To a solution of 3,5-Dibromosalicylaldehyde (0.560 g, 2.00 mmol) dissolved in methanol (40 mL), (1R,2R)-(+)-1,2-Diphenylethylenedia- mine (0.2122 g, 1.00 mmol) was added and stirred at 313 K for 2 h to give yellow solution of ligand. Nickel (II) acetate tetrahydrate (0.249 g, 1.00 mmol) was added to the resulting solution and stirring at 313 K for 2 h to give orange solu-tion of the complex. After cooling the solusolu-tion, this orange compound was fil-tered. Yield 0.695 g (86.8%). Anal. Found: C, 42.76; H, 2.36; N, 3.44%. Calc. for C28H18Br4N2O2Ni: C, 42.42; H, 2.29; N, 3.53%. IR (KBr (cm-1)):1620 (C=N).
UV-Vis (diffuse reflectance)/nm ; 430, 573. CD (KBr) peak/nm ; 409, 572. Preparation of 5b: To a solution of 3,5-Dibromosalicylaldehyde (0.560 g, 2.00 mmol) dissolved in methanol (40 mL), (1R,2R)-(+)-1,2-Diphenylethyle- nediamine (0.212 g, 1.00 mmol) was added and stirred at 313 K for 2 h to give yellow solution of ligand. Copper(II) acetate monohydrate(0.200 g, 1.00 mmol) was added to the resulting solution and stirring at 313 K for 2 h to give green solution of the complex. After cooling the solution, this green compound was filtered. Yield 0.725 g (90.9%). Anal. Found: C, 42.06; H, 2.27; N, 3.43%. Calc. for C28H18Br4N2O2Cu: C, 42.16; H, 2.27; N, 3.51%. IR (KBr (cm-1)):1623 (C=N).
UV-Vis (diffuse reflectance) peak/nm; 399, 582. CD(KBr) peak/nm ; 379, 575. Preparation of 5c: To a solution of 3,5-Dibromosalicylaldehyde (0.560 g, 2.00 mmol dissolved in methanol (40 mL), (1R,2R)-(+)-1,2-Diphenylethylenediamine (0.212 g, 1.00 mmol) was added and stirred at 313 K for 2 h to give yellow so-lution of ligand. Zinc(II) acetate dihydrate (0.220 g, 1.00 mmol) was added to the resulting solution and stirring at 313 K for 2 h to give yellow solution of the complex. After cooling the solution, this yellow compound was filtered. Yield 0.692 g (86.6%). Anal. Found: C, 42.01; H, 2.02; N, 3.33%. Calc. for C28H18Br4N2O2Zn: C, 42.07; H, 2.27; N, 3.50%. IR (KBr (cm-1)): 1629 (C=N). UV-
Vis (diffuse reflectance) peak/nm; 404. CD (KBr) peak/nm ; 401.
2.2. Preparation of AuNP and Complexes of Composite Solution
AuNP (10 nm) were purchased from Funakoshi (BMGC10) and used without further purification. Spectral measurements were performed as 0.005 mM-0.1 mM solutions for chiral metal complexes and the most suitable 1:1 (v/v) solu-tions for mixed solusolu-tions of chiral metal complexes and AuNP. The experimen-tal conditions were investigated widely.
2.3. Measurements
2.4. Calculations
Geometry optimization and normal vibration analysis are computed using DFT with B3LYP functional, Lanl2dz for Cu, Ni, and Zn and 6-31+G(d) basis set for H, C, N, O and Br in the GAUSSIAN 03 program package [39]. In addition, transition electric dipole moment and excitation energies are calculated using TD-DFT with B3LYP functional, Lanl2dz for Cu, Ni, and Zn and 6-31+G(d) ba-sis set for H, C, N and O. For comparison, transition electric dipole moment and excitation energies are also calculated using ZINDO. As ability of induced CD, dipole moments of molecules were calculated by TD-DFT.
2.5. Rietveld Structural Analysis
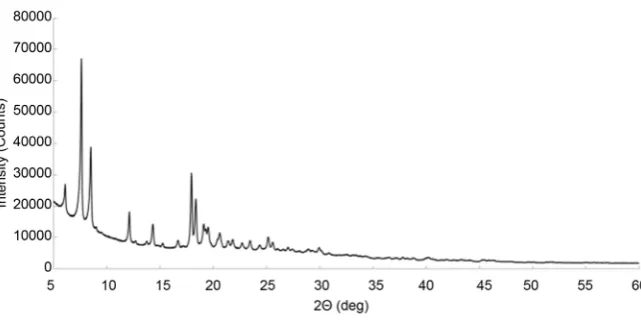
The powder X-ray diffraction (XRD) pattern of complexes 2c (Figure 1) were collected at 298 K on Rigaku Smart lab at the University of Tokyo. A capillary was packed with a powder sample (whose quality was confirmed characteristic peaks around 7, 8, and 17 degree) and measurement was performed. Intensity data were collected on a Rigaku Smart lab with graphite monochromated Cu Kα radiation (1.54184 Å). Structural analysis by the Rietveld method [40] was car-ried out using PDXL2 ver.2.2.1.0 (Rigaku Corporation).
2.6. X-Ray Crystallography
Single crystals were glued on top of a glass fiber and coated with a thin layer of epoxy resin to measure the diffraction data. Intensity data were collected on a Bruker APEX2 CCD diffractometer with graphite monochromated Mo Kα radi-ation (k = 0.71073 Å). Data analysis was conducted using the SAINT program package. The structures were solved by direct methods with SHELXS-97 [41], expanded by Fourier techniques and refined by the full-matrix least-squares method based on F2 with the program SHELXL-97 [41]. An empirical absorption
[image:5.595.213.534.552.712.2]correction was applied in the program SADABS. All non-hydrogen atoms were readily located and refined by anisotropic thermal parameters. All hydrogen atoms were located at geometrically calculated positions and refined using riding models.
3. Results and Discussion
3.1. CD spectra and UV Spectra Results
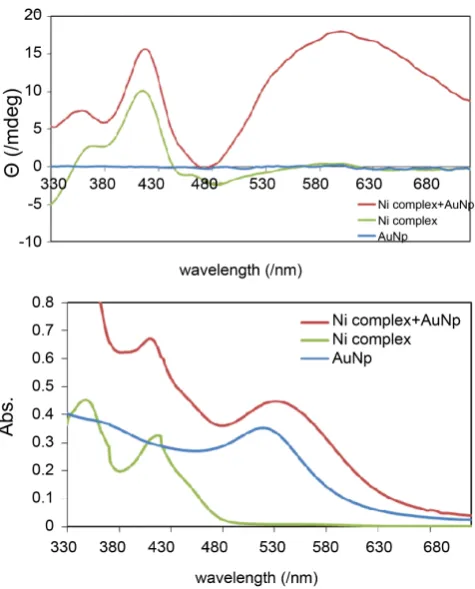
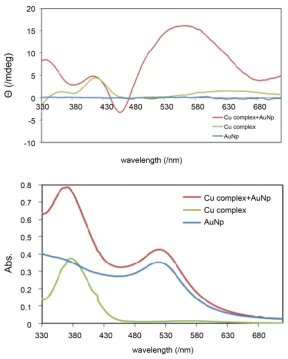
Figures 2-4 depict electronic and CD spectra of hybrid system of AuNP and 1a, 1b and 1c, respectively. Pure AuNP (10 nm) showed surface plasmon band at around 530 nm without distinct CD bands. On the other hand, Pure compound 1a, 1b and 1c exhibited predominant absorption bands at 400, 380, and 380 nm, respectively, and predominant CD peaks at 400 nm. It should be noted that mixed solutions (namely hybrid systems) of each metal complex and AuNP (10 nm) exhibited predominantly induced CD bands at about 600 nm. The bands are close to surface plasmon band of pure AuNP and no CD peak could be ob-served as neither pure AuNP nor pure 1a, 1b and 1c. It should also be noted that the intensity of induced CD peaks were clearly increased for the first time among our studies using chiral Schiff base additives, which is distinctly different from weakly induced or negatively induced ones [32]. Interestingly, additional and characteristic (chiro) optical absorption resulting from supramolecular assem-blies could be observed for the present system.
Induced CD was observed in the same manner about 4, 5a, 5b and 5c. In-duced CD was not observed about 2a, 2b, 2c and 3. From the existing theory
[20], it considered for the dipole moment of the gold nanoparticles and the complexes is a vertical. The supporting information shows the results of other compounds.
[image:6.595.256.494.406.701.2]Figure 3. CD and electronic spectra of the systems of AuNP and 1b. Plas-mon-induced is observed to 550 nm.
3.2. TD-DFT Calculation and Expectation of Adsorption Structure
Figure 9 (left) shows calculated electric dipole moments (for optimized struc-tures) of the chiral metal complexes, which are orientated in the direction of center of two phenyl groups regardless of metal centers. Furthermore, optimized structures of the complexes suggested that square planar coordination geometry and conformation of organic ligands are suitable for adsorption onto the surface of AuNP by methoxy groups. According to parallel arrangement of electric tran-sition dipole moment to enhance induced CD band associated with surface plasmon band based on theoretical study [20], electric supramolecular hybrid systems may be proposed in Figure 5 (right).3.3. Structural Description
3.3.1. Structure Description of 2cThe crystallographic data and selected bond lengths for 2c are listed in Table 1
and Table 2, respectively. The crystal of 2c crystallized in the orthorhombic (chiral and non-polar) space group P212121 with Z = 2. This complex is a strain
Figure 4. CD and electronic spectra of the systems of AuNP and 1c. Plas-mon-induced is observed to 550 nm.
Figure 5. [Left] Calculated electric dipole moments (blue arrows in similar direction with slightly different magnitudes) for compound 1a, 1b and 1c of optimized structures. [Right] Proposed arrangement of supramolecular hy-brid systems of chiral complex and AuNP.
planar ligands not to overlap (Figure 6, Figure 7). The results of calculation and results of X-ray structure analysis were compared. Surroundings of Zn are dis-torted flat type, which is different from the optimized structure adopting the plan type arrangement. Both of the phenyl groups were arranged in an overlap-ping manner, and it was almost the same arrangement as the optimized struc-ture.
3.3.2. Structure Description of 3
[image:8.595.236.513.439.533.2]Table 1. Crystal data and structure refinement (Rietveld with PDXL2) for 2c.
Empirical formula C28H22N2O2Zn
Crystal system orthorhombic
Space group P 21 21 21
Z 4
a (Å) 11.616 (3)
b (Å) 23.198 (8)
c (Å) 9.379 (3)
V (Å3) 2527.4 (13)
ρcalc (g/cm3) 1.270
μ (mm−1) 1.5413
F(000) 1000.0
[image:9.595.207.539.338.445.2]Rwp (%) 8.37
Table 2. Selected bond lengths[Å] and angles[˚] for 2c.
Zn1-N1 2.102(4) O1-Zn1-O2 107.72 (2) Zn1-O1 1.951(5) O1-Zn1-N1 153.22 (4) Zn1-N2 2.102(3) O1-Zn1-N2 90.79 (2)
Zn1-O2 1.951(4) O2-Zn1-N1 90.79 (2)
O2-Zn1-N2 153.22 (5) N1-Zn1-N2 79.55 (19)
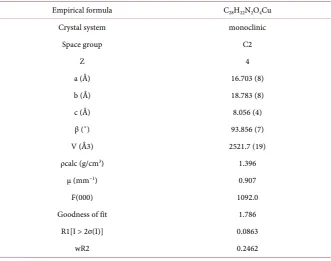
Table 3. Crystal data and structure refinement for 3.
Empirical formula C28H22N2O4Cu
Crystal system monoclinic
Space group C2
Z 4
a (Å) 16.703 (8)
b (Å) 18.783 (8)
c (Å) 8.056 (4)
β (˚) 93.856 (7)
V (Å3) 2521.7 (19)
ρcalc (g/cm3) 1.396
μ (mm−1) 0.907
F(000) 1092.0
Goodness of fit 1.786
R1[I > 2σ(I)] 0.0863
[image:9.595.207.539.476.737.2]Figure 6. Crystal structure of 2c showing selected atom labe-ling scheme. Hydrogen atoms are omitted for clarity.
Figure 7. A perspective view of the packing of 2c.
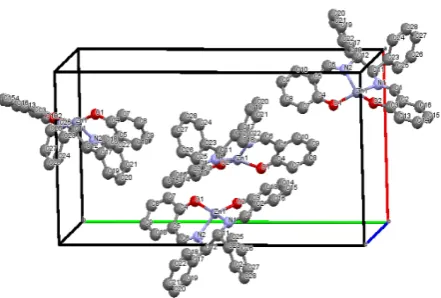
and Table 4, respectively. The crystal of 3 crystallized in the monoclinic (chiral and non-polar) space group C2 with Z = 4. This complex is a square-planar complex these central metal is copper (Figure 8). Its packing shows in which planar ligands overlap in the c axis direction (Figure 9). The results of calcula-tion and results of X-ray structure analysis were compared. Independent two molecules of the asymmetric unit have the same structure, the periphery of the copper is a planar type, and both phenyl groups are arranged in an overlapping arrangement. The length from the adsorbed hydroxyl group was almost the same as the optimized structure (0.9773 nm).
4. Conclusion
[image:10.595.265.486.311.460.2]Figure 8. Crystal structure of 3 showing selected atom labe-ling scheme. Hydrogen atoms are omitted for clarity.
Figure 9. A perspective view of the packing of 3.
Table 4. Selected bond lengths[Å] and angles[˚] for 3.
Cu1-N1 1.918 (13) O1-Cu1-O1a 91.8 (6) Cu1-O1 1.899 (10) O1-Cu1-N1 92.1 (4) Cu1-N1a 1.918 (13) O1-Cu1-N1a 174.0 (5) Cu1-O1a 1.899 (10) O1a-Cu1-N1 174.0 (5) Cu2-N2 1.955 (12) O1a-Cu1-N1a 92.1 (4) Cu2-O2 1.907 (10) N1-Cu1-N1a 84.3 (7) Cu2-N2a 1.955 (12) O2-Cu2-O2b 87.0 (6) Cu2-O2a 1.907 (10) O2-Cu2-N2 95.4 (4) O2b-Cu2-N2 167.4 (4) O2-Cu2-N2b 167.4 (4) O2b-Cu2-N2b 95.4 (4) N2-Cu2-N2b 85.0 (7)
[image:11.595.207.540.484.690.2]been observed induced CD is adsorbed standing on the Au surface. On the other hand, the complex which has not been observed induced CD is adsorbed on the Au surface in the state complex which doesn’t have central metal. The proposed supramolecular structures have potential application as new type of chiral AuNP catalysts possessing merits of both heterogenous (AuNP with chiral ligands) and homogenous (AuNP supported chiral metal complexes) ones on the surface (Scheme 1). Further investigation about chiral catalytic functions is in progress now. However, it should be noted here that merely small amount of bubbles was confirmed from the Au substrate surface during the preliminary reaction aiming at applications.
Acknowledgements
This work was partly performed under the Cooperative Research Program of “Network Joint Research Centre for Materials and Devices”. The authors thank Profs. Kenji Hara and Toshikazu Kawaguchi (Hokkaido University) for prelim-inary discussion for surface and catalysis chemistry (Supplementary File).
References
[1] Liz-Marzán, L.M. (2004) Formation and Color. Nanometals. Mater. Today, 7, 26-
31. https://doi.org/10.1016/S1369-7021(04)00080-X
[2] Chen, H., Ming, T., Zhao, L., Wang, F., Sun, L.D., Wang, J. and Yan, C.H. (2010) Plasmon-Molecule Interactions. Nano Today, 5, 494-505.
https://doi.org/10.1016/j.nantod.2010.08.009
[3] Knight, M.W., Sobhani, H., Nordlander, P. and Halas, N.J. (2011) Photodetection with Active Optical Antennas. Science, 332, 702-704.
https://doi.org/10.1126/science.1203056
[4] Christopher, P., Xin, H. and Linic, S. (2011) Visible-Light-Enhanced Catalytic Oxi-dation Reactions on Plasmonic Silver Nanostructures. Nature Chemistry, 3, 467- 472. https://doi.org/10.1038/nchem.1032
[5] Wang, C.L. and Didier, A. (2014) Nanogold Plasmonic Photocatalysis for Organic Synthesis and Clean Energy Conversion. Chemical Society Reviews, 43, 7188-7216.
https://doi.org/10.1039/C4CS00145A
[6] Lakowicz, J.R., Ray, K., Chowdhury, M., Szmacinski, H., Fu, Y., Zhang, J. and No-waczyk, K. (2008) Plasmon-Controlled Fluorescence: A New Paradigm in Fluores-cence Spectroscopy. Analyst, 133, 1308-1346. https://doi.org/10.1039/b802918k
[7] Nie, S. and Emory, S.R. (1997) Probing Single Molecules and Single Nanoparticles by Surface-Enhanced Raman Scattering. Science, 275, 1102-1106.
https://doi.org/10.1126/science.275.5303.1102
[8] Xu, L., Kuang, H., Wang, L. and Xu, C. (2011) Gold Nanorod Ensembles as Artifi-cial Molecules for Applications in Sensors. Journal of Materials Chemistry, 21, 16759-16782. https://doi.org/10.1039/c1jm11905b
[9] Lee, A., Andrade, G.F.S., Ahmed, A., Souza, M.L., Coombs, N., Tumarkin, E., Liu, K., Gordon, R., Brolo, A.G. and Kumacheva, E. (2011) Probing Dynamic Genera-tion of Hot-Spots in Self-Assembled Chains of Gold Nanorods by Surface-Enhanced Raman Scattering. Journal of the American Chemical Society, 133, 7563-7570.
https://doi.org/10.1021/ja2015179
Nano-particles on the Performance of Organic Electrophosphorescence Devices. Applied Physics Letters, 88, 213503. https://doi.org/10.1063/1.2200285
[11] Huang, J.S., Kern, J., Geisler, P., Weinmann, P., Kamp, M., Forchel, A., Biagioni, P. and Hecht, B. (2010) Mode Imaging and Selection in Strongly Coupled Nanoan-tennas. Nano Letters, 10, 2105-2110. https://doi.org/10.1021/nl100614p
[12] Liu, N., Mukherjee, S., Bao, K., Brown, L.V., Dorfmüller, J., Nordlander, P. and Ha-las, N.J. (2011) Magnetic Plasmon Formation and Propagation in Artificial Aro-matic Molecules. Nano Letters, 12, 364-369. https://doi.org/10.1021/nl203641z
[13] Kuzyk, A., Schreiber, R., Fan, Z., Pardatscher, G., Rolle, E.M., Högele, A., Simmel, F.C., Govorov, A.O. and Liedl, T. (2012) DNA-Based Self-Assembly of Chiral Plas-monic Nanostructures with Tailored Optical Response. Nature, 483, 311-314.
https://doi.org/10.1038/nature10889
[14] Guerrero, M.A., Augié, B., Alonso, G.J.L., Dzolic, Z., Gómez G.S., Zinic, M., Cid, M.M. and Liz-Marzán, L.M. (2011) Intense Optical Activity from Three-Dimen- sional Chiral Ordering of Plasmonic Nanoantennas. Angewandte Chemie Interna-tional Edition, 50, 5499-5503. https://doi.org/10.1002/anie.201007536
[15] Auguié, B., Alonso, G.J.L., Guerrero, M.A. and Liz-Marzán, L.M. (2011) Fingers Crossed: Optical Activity of a Chiral Dimer of Plasmonic Nanorods. Journal of Physical Chemistry Letters, 2, 846-851. https://doi.org/10.1021/jz200279x
[16] Wang, R.Y., Wang, H., Wu, X., Ji, Y., Wang, P., Qu, Y. and Chung, T.S. (2011) Chiral Assembly of Gold Nanorods with Collective Plasmonic Circular Dichroism Response. Soft Matter, 7, 8370-8375. https://doi.org/10.1039/c1sm05590a
[17] Colleen, M.A., Mathew, M.M. and James, C.D. (2011) DNA-Capped Nanoparticles Designed for Doxorubicin Drug Delivery. Chemical Communications, 47, 3418- 3420. https://doi.org/10.1039/c0cc04916f
[18] Ben-Moshe A., Maoz, B.M., Govorov A.O. and Markovich, G. (2013) Chirality and Chiroptical Effects in Inorganic Nanocrystal Systems with Plasmon and Exciton Resonances. Chemical Society Reviews, 42, 7028-7041.
https://doi.org/10.1039/c3cs60139k
[19] Govorov, A.O. and Fan, Z. (2012) Theory of Chiral Plasmonic Nanostructures Comprising Metal Nanocrystals and Chiral Molecular Media. ChemPhysChem, 13, 2551-2560. https://doi.org/10.1002/cphc.201100958
[20] Govorov, A.O., Fan, Z., Hernandez, P., Slocik, J.M. and Nail, R.R. (2010) Theory of Circular Dichroism of Nanomaterials Comprising Chiral Molecules and Nanocrys-tals: Plasmon Enhancement, Dipole Interactions, and Dielectric Effects. Nano Let-ters, 10, 1374-1382. https://doi.org/10.1021/nl100010v
[21] Barron, L.D. and Buckingham, A.D. (2001) Time Reversal and Molecular Proper-ties. Accounts of Chemical Research, 34,781-789. https://doi.org/10.1021/ar0100576
[22] Noguez, C. and Garzon, I.L. (2009) Optically Active Metal Nanoparticles. Chemical Society Reviews, 38, 757-771. https://doi.org/10.1039/b800404h
[23] Roy, S. and Pericas, M.A. (2009) Functionalized Nanoparticles as Catalysts for Enantioselective Processes. Organic & Biomolecular Chemistry,7, 2669-2677.
https://doi.org/10.1039/b903921j
[24] Tatiana, P., Elvis, C.M. and Ting, I.P. (2014) Chiral Effects in Amino Acid Adsorp-tion on Au(111): A Comparison of Cysteine, Homocysteine and Methionine. Sur-face Science,629, 20-27. https://doi.org/10.1016/j.susc.2014.01.018
https://doi.org/10.1021/jp405478n
[26] Park, J.W. and Jennifer S. (2014) Structural Study of Citrate Layers on Gold Nano-particles: Role of Intermolecular Interactions in Stabilizing Nanoparticles. Journal of the American Chemical Society,136, 1907-1921.
https://doi.org/10.1021/ja4097384
[27] Akitsu, T., Uchida, N., Aritake, Y. and Yamaguchi, J. (2008) Induced d-d Bands in CD Spectra Due to Chiral Transfer from Chiral Nickel(II) Complexes to Achiral Copper(II) Complexes and Application for Structural Estimation. Trends in Inor-ganic Chemistry,10, 41-49.
[28] Akitsu, T. and Uchida, N. (2010) Induced d-d Bands in CD Spectra of Solution of Chiral Schiff Base Nickel(II) Complex and Ferrocene. Asian Chemistry Letters, 14, 21-28.
[29] Akitsu, T., Yamaguchi, J., Uchida, N. and Aritake, Y. (2009) The Studies of Condi-tions for Inducing Chirality to Cu(II) Complexes by Chiral Zn(II) and Ni(II) Com-plexes with Schiff Base. Research Letters in Materials Science, 2009, Article ID: 484172. https://doi.org/10.1155/2009/484172
[30] Akitsu, T., Yamaguchi, J., Aritake, Y., Hiratsuka, T. and Uchida, N. (2010) Observa-tion of Enhanced CD Bands of Metal Complexes, Metallodendrimers, and Metal Clusters by Chiral Schiff Base Metal Complexes. International Journal of Current Research, 1, 1-6.
[31] Akitsu, T., Aritake, Y., Nakayama, T. and Nishizuru, H. (2011) Observation of In-duced CD on CdSe Nano-Particles from Chiral Schiff Base Ni(II), Cu(II), Zn(II) Complexes. Inorganic Chemistry Communications, 14, 423-425.
https://doi.org/10.1016/j.inoche.2010.12.017
[32] Yamaguchi, J. and Akitsu, T. (2011) Molecular Recognition of Chiral Schiff Base Metal Complexes for Induced CD Bands to Metallodendrimers. International Jour-nal of Current Research,2, 165-172.
[33] Kominato, C. and Akitsu, T. (2012) Computational Study on UV-Vis and CD Spec-tra of Chiral Schiff Base Ni(II), Cu(II), and Zn(II) Complexes for Discussion of In-duced CD. Journal of Chemistry and Chemical Engineering,, 6, 199-208.
[34] Akitsu, T. and Kominato, C. (2013) Molecular Recognition of Trans-Chiral Schiff Base Metal Complexes for Induced CD. An Integrated View of the Molecular Rec-ognition and Toxinology—From Analytical Procedures to Biomedical Applications, InTech, Rijeka, 515-532. https://doi.org/10.5772/52226
[35] Kimura, N., Nishizuru, H., Aritake, Y. and Akitsu, T. (2013) Observation of Reci-procal Induced CD between Colloidal Gold Nanoparticles and Chiral Schiff Base Zn(II) Complexes with Parallel Dipole Moments. Journal of Chemistry and Chemi-cal Engineering, 7, 390-394.
[36] Hiratsuka, T., Shibata, H. and Akitsu, T. (2012) Structures and Properties of 3d-4f and 3d Chiral Schiff Base Complexes. Nova Science Publishers, New York, 45-64. [37] Pooyan, M., Abolfazl, G., Mahdi, B. and Hadi, A. (2013) Tetradentate N2O2 Type
Nickel(II) Schiff Base Complexes Derived from Meso-1,2-diphenyle-1,2-ethylene- diamine: Synthesis, Characterization, Crystal Structures, Electrochemistry, and Cat-alytic Studies. Journal of Coordination Chemistry, 66, 4255-4267.
https://doi.org/10.1080/00958972.2013.867031
[38] Kusum, K.B., Galla, V.K. and Kommuru, G. (2013) Enantioselective Henry Reaction Catalyzed by “Ship in a Bottle” Complexes. Inorganic Chemistry, 52, 8017-8029.
https://doi.org/10.1021/ic400599c
J.R., Scalmani, G., Barone, V., Mennucci, B., Petersson, G.A., Nakatsuji, H., Carica-to, M., Li, X., Hratchian, H.P., Izmaylov, A.F., Bloino, J., Zheng, G., Sonnenberg, J.L., Hada, M., Ehara, M., Toyota, K., Fukuda, R., Hasegawa, J., Ishida, M., Nakaji-ma, T., Honda, Y., Kitao, O., Nakai, H., Vreven, T., Montgomery Jr., J.A., Peralta, J.E., Ogliaro, F., Bearpark, M., Heyd, J.J., Brothers, E., Kudin, K.N., Staroverov, V.N., Kobayashi, R., Normand, J., Raghavachari, K., Rendell, A., Burant, J.C., Iyen-gar, S.S., Tomasi, J., Cossi, M., Rega, N., Millam, J.M., Klene, M., Knox, J.E., Cross, J.B., Bakken, V., Adamo, C., Jaramillo, J., Gomperts, R., Stratmann, R.E., Yazyev, O., Austin, A.J., Cammi, R., Pomelli, C., Ochterski, J., Martin, R.L., Morokuma, K., Zakrzewski, V.G., Voth, G.A., Salvador, P., Dannenberg, J.J., Dapprich, S., Daniels, A.D., Farkas, O., Foresman, J.B., Ortiz, J.V., Cioslowski, J. and Fox, D.J. (2009) GAUSSIAN 09 (Revision A.1). Gaussian, Inc., Wallingford, CT.
[40] Rietveld, H.M. (1969) A Profile Refinement Method for Nuclear and Magnetic Structures. Journal of Applied Crystallography, 2, 65-71.
https://doi.org/10.1107/S0021889869006558
[41] Sheldrick, G.M. (2008) A Short History of SHELX. Acta Crystallographica, A64. 112-122. https://doi.org/10.1107/S0108767307043930
Appendix A. Supplementary Data
CCDC 1480602 and 1480604 contains the supplementary crystallographic data for 2c and 3 respectively. These data can be obtained free of charge via
http://www.ccdc.cam.ac.uk/conts/retrieving.html, or from the Cambridge
Crys-tallographic Data Centre, 12 Union Road, Cambridge CB21EZ, UK; fax: (+44) 1223-336-033; or e-mail: [email protected].
Supplementary File
1.1. XPS
The XPS measurement was performed in the gold substrate and complexes. This was confirmed the presence or absence of elements of gold substrate surface in order to examine the state of the adsorption of gold and complex in detail as a model case of gold colloid and complex solution.
1.1.1. Preparation of XPS Measurements
We performed XPS measurement for 1a, 1b, 1c, 3 and 4. First we prepared 10 nm × 10 nm square gold substrate, then prepared 0.01 mM methanol solution of compound 1a, 1b and 1c, also prepared 0.2 mM methanol solution of 3 and 4, respectively. The gold substrate put into sample tubes and tried interactions gold surface and complexes by immersing 1 hour complexes solution. Immersed gold substrate washed for three times with chloroform, and then dry surface with Ar gas. We measured for Au, C, O, N and Central metal atoms, respectively.
1.1.2. XPS Qualitative Analysis
According to XPS measurement, for example, it shows that the constituent elements of the 1a is present in the gold substrate surface. We observe binding energy that 84 eV for Au4f7/2 and 88 eV for Au4f5/2 peaks of the Au substrate elements, and then 285 eV for C1s, 532 eV for O1s, 398 eV for N1s, 853 eV for Ni2p3/2 and 870 eV for Ni2p1/2 peaks of constituent elements of 1a. Copper atom has been measured as a comparison but it should be appreciated that copper atom was not observed matter of course. In the same way, peak of the complex elements (C, O, N and Central metal atoms) also for 1b, 1c and 4 was observed. Although the C, O and N elements was observed for 3, the central metal has not been observed. This point will be discussed in conjunction with the STM. The supporting information shows the results of 1b, 1c, 3 and 4.
1.1.3. XPS Quantitative Analysis
We performed a quantitative analysis of elements by the area calculation for XPS spectrum of previous chapter. Results are shown Table 1.
is almost the same as the ratio of the elements of these compound. For 3, nitro-gen and central metal is present on Au surface but about 4, the nitronitro-gen is present but the central metal was not observed on the Au surface. We can say the presence or absence of the induced CD is, is that consistent with the presence or absence of the central metal by XPS spectra in this chapter.
1.2. STM
STM measurement was performed to investigate the adsorption structure of the gold substrate and the complex visually.
1.2.1. Preparation of STM Measurements
We performed STM measurement for 1a, 1b, 1c, 3 and 4. First we prepared 10 nm × 10 nm square gold substrate, then prepared 0.01 mM methanol solution of 1a, 1b and 1c, also prepared 0.2 mM methanol solution of 3 and 4, respectively. It was performed exima treatment (172 nm) for 3 minutes for activating the Au surface. The gold substrate put into sample tubes and tried interactions Au surface and complexes by immersing 1 hour complexes solution. Immersed gold substrate washed for three times with chloroform, and then dry surface with Ar gas.
1.2.2. Measurements of STM
In Figure S1, it can be observed gold atom one by one. The distance between atoms is consistent with 0.24 nm is a literature value of gold [42].
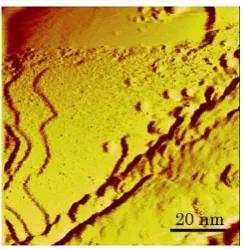
In Figure S2, surface of Au and 1a can be observed layered structure on the left, also the structure of the particulate on the right can be observed. Figure S3 is the same sample as Figure S2 but a different location. We performed the analysis of the depth about where was surrounded by a square (Figure S4). The grain height is 1.194 nm and it is that substantially coincide with the longi-tudinal length of 1a (1.266 nm). From this it can be said that the complex is ad-sorbed standing on the Au surface. This fact is consistent with the theoretical study [20].
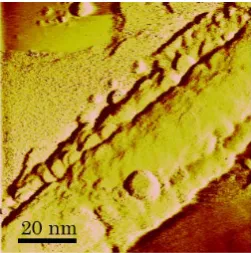
[image:17.595.311.437.577.704.2]In Figure S5, surface of Au and 3 can be observed layered structure on the right, also the structure of the particulate on the left can be observed. Granular structure on the left we consider to be a structure derived from the same com-plex as in the case of 1a. However, in the XPS spectra, the central metal of the
Figure S2. STM image of 100 nm × 100 nm square Au and 1a substrate (1).
Figure S3. STM image of 100 nm × 100 nm square Au and 1a substrate (2).
Figure S4. Depth analysis and optimized structure of 1a.
Figure S5. STM image of 200 nm × 200 nm square Au and 3 substrate.
[image:18.595.232.517.379.469.2] [image:18.595.299.450.502.654.2]Submit or recommend next manuscript to SCIRP and we will provide best service for you:
Accepting pre-submission inquiries through Email, Facebook, LinkedIn, Twitter, etc. A wide selection of journals (inclusive of 9 subjects, more than 200 journals)
Providing 24-hour high-quality service User-friendly online submission system Fair and swift peer-review system
Efficient typesetting and proofreading procedure
Display of the result of downloads and visits, as well as the number of cited articles Maximum dissemination of your research work
Submit your manuscript at: http://papersubmission.scirp.org/
![Figure 5. [Left] Calculated electric dipole moments (blue arrows in similar direction with slightly different magnitudes) for compound 1a, 1b and 1c of optimized structures](https://thumb-us.123doks.com/thumbv2/123dok_us/7748835.709537/8.595.241.503.68.384/calculated-direction-slightly-different-magnitudes-compound-optimized-structures.webp)
![Table 4. Selected bond lengths[Å] and angles[˚] for 3.](https://thumb-us.123doks.com/thumbv2/123dok_us/7748835.709537/11.595.260.487.75.199/table-selected-bond-lengths-angles.webp)