ISSN Online: 2327-4344 ISSN Print: 2327-4336
Sesame Husk as Adsorbent for Copper(II) Ions
Removal from Aqueous Solution
Haitham Ahmed El-Araby
1*, Abel Moneim Mohamed Ahmed Ibrahim
2,
Ahmed Hashem Mangood
1, Adel A.-H. Abdel-Rahman
11Chemistry Department, Faculty of Science, Menoufia University, Shebin El-Kom, Egypt 2Chemistry Department, Faculty of Science, Alexandria University, Alexandria, Egypt
Abstract
In this study, the adsorption behavior of copper(II) ions from aqueous solu-tions onto sesame husk (SH) was investigated. The effect of different parame-ters such as pH, contact time, adsorbent dosage, adsorbate concentration, temperature and agitation speed was studied. Thermodynamic parameters, equilibrium isotherms and kinetic data have been evaluated. The functional groups and surface morphology of SH adsorbent were characterized by FTIR and SEM. Adsorption equilibrium isotherms were expressed by Langmuir, Freundlich and Dubinin-Radushkevich (D-R) adsorption models and it was found that Langmuir adsorption model fits the experimental data better than Freundlich and D-R models. The adsorption can be best described by the pseudo second-order kinetic model.
Keywords
Copper(II) Ions Adsorption, Kinetics, Thermodynamic Parameters
1. Introduction
Serious environmental pollution arises as a result of the industrial activities and technology development due to waste streams of heavy metals from several in-dustries which are poured into rivers. This occurs in many inin-dustries including mining process, smelting, metal plating, pigment, battery manufacturing processes, metallurgical industries [1] [2] [3], tannery and fabrication [4].
Various treatment methods and traditional technologies are used to remove heavy metals from wastewater, for instance, chemical oxidation/reduction [5] [6], electrodialysis [7], ultrafiltration [8] [9], solvent extraction [10], ion-ex- change, evaporation, membrane filtration [11] [12] [13] [14], chemical precipi-tation [15], reverse osmosis [16] and coagulation [17]. However, there are some How to cite this paper: El-Araby, H.A.,
Ibrahim, A.M.M.A., Mangood, A.H. and Abdel-Rahman, A.A.-H. (2017) Sesame Husk as Adsorbent for Copper(II) Ions Re- moval from Aqueous Solution. Journal of Geoscience and Environment Protection, 5, 109-152.
https://doi.org/10.4236/gep.2017.57011
Received: May 28, 2017 Accepted: July 18, 2017 Published: July 21, 2017
Copyright © 2017 by authors and Scientific Research Publishing Inc. This work is licensed under the Creative Commons Attribution International License (CC BY 4.0).
http://creativecommons.org/licenses/by/4.0/
disadvantages accompany with these technologies such as high cost, sensitive operating conditions and possibility of secondary sludge production [18] [19] which suffocate their generalization in industries.
Adsorption is considered one of the important methods used for the removal of heavy metals [20] [21] [22] [23]. Comparing to the other purification and se-paration methods, adsorption-as a wastewater treatment process-has demon-strated its efficiency and economic feasibility and has gained importance in in-dustrial applications [24] [25], as elimination of heavy metal cations from aqueous solution by selecting the suitable adsorbents under optimum operation conditions [26].
One of the advantages of natural adsorbents is that, they are easily applicable because of their adaption to several conditions as pH, temperature, pressure and agitation. Besides, these materials are cheap and highly efficient [27]. So, devel-opment of alternative adsorbent materials featuring high availability, high ad-sorption capacities and feasibility is required [27]. In addition, the cost of these biosorbent materials is negligible compared with the cost of activated carbon or ion-exchange resins [28].
Recently, agricultural by-products have been widely studied for sequestering of metals from water including peat [29], wood [30], pine bark [31], banana pith [32], rice bran, soybean and cottonseed hulls [33], peanut shells [34], hazelnut shell [35], rice husk [36], sawdust [37], wool [38], orange peel and compost [39] and leaves [40]. Most of this work has approved that natural products could be perfect adsorbents for heavy metals [26].
Most metals in the fourth period of periodic table are carcinogenic. This car-cinogenicity is assumed to be related to the electronic structure of transition and inner transitional metals [41]. Since copper is an essential metal in a number of enzymes for all forms of life, problems take place when it is deficient or in excess [26]. Copper is considered one of the most widely used heavy metal and the cu-pric ion, Cu(II), is the most prevalent species found in the environment and copper in this form is toxic to many living organisms [3] [42] [43].
Human is exposed to abnormally high levels of toxic metals in drink and food due to some practices such as cooking in copper-lined or copper-glazed pots and using copper pipes to supply water [44]. Drainage discharge, fertilizer industries, mining wastes, plating baths, paints and pigments, etc. are different sources of copper waste [12].
Although copper in trace amounts is essential to living organisms, excessive copper in water may cause harmful effects as neurotoxicity, jaundice, diarrhea, respiratory difficulties, liver and kidney failure, and even death [43] [45] [46]. Intake of excessively large portions of copper by man leads to severe mucosal ir-ritation and corrosion, widespread capillary damage, hepatic and renal damage, central nervous system irritation followed by depression, gastrointestinal irrita-tion [12] [47].
limit of copper in drinking water is 1.3 and 2.0 mg/L according to U.S. Envi-ronmental Protection Agency (EPA) and WHO respectively [48].
Among the several methods described in literature, adsorption is the most ef-fective method that has been successfully applied in the purification and recov-ery of Cu(II) ions from liquid waste because of its high efficiency and easy han-dling [49].
Agricultural materials especially those containing cellulose present potential metal biosorption capacity. Set of functional groups are exist in the basic com-ponents of the agricultural waste materials biomass such as extractives, hemicel-lulose, lignin, lipids, proteins, simple sugars, water hydrocarbons, starch. The functional groups facilitate metal complexation which helps for the heavy metals elimination [18] [50] [51] [52].
Agricultural waste materials seem to be viable option for heavy metal remedi-ation for many reasons; 1) they are available in abundance, 2) are economic and ecofriendly, 3) more efficient, 4) they have unique chemical composition, 5) re-newable and finally 6) low in cost. These materials are used in the removal of metal ions either in their natural form or after some physical or chemical mod-ification [18].
For centuries, sesame seeds have been plowed particularly in Asia and Africa. In 2009, the world production of sesame seed was around 4 million tons and the major production areas were Asia (nearly 2.5 million tons) and Africa (nearly 1.3 million tons), with a reported percentage of 62.6% and 33.1% of the total world production [53]. Sesame seeds present a considerably higher content of polyphenolic compounds [54]. Husks are used as feed or fuel, but they have rela-tively high contents of phenolics in some cases, usually higher than their con-tents in seeds [55] and phenolic compounds can act as metal chelators [56]. Sćiban et al. [57] conducted an experiment on the efficiency of sawdust as an adsorbent in the removal of Cu(II) ion. It was found that, sawdust contains var-ious organic compounds (lignin, cellulose and hemicellulose) with polyphenolic groups that could bind heavy metal ions through different mechanisms [58]. From all these literature review, it is expected that sesame husk (SH) could be used as a promising adsorbent for removal of copper(II) from simulated waste-water (aqueous solution).
In this article, sesame husk (SH) was prepared and used as a novel adsorbent for copper(II) removal from aqueous solution. The resulting SH was characte-rized by SEM and FT-IR. Also, adsorption isotherms and kinetics were investi-gated in order to evaluate the maximum adsorption capacity and the optimum adsorption conditions.
2. Materials and Methods
2.1. Instrumentation
temperature accuracy: ±0.5˚C). Before every measurement, the pH meter was calibrated with three standard buffer solutions (pH 4.0, pH 7.0 and pH 10.0 at 25˚C) supplied by Jenway. The adsorption experiments were carried out by me-chanically shaking and BlueSpin Magnetic Hotplate Stirrer instrument model: BlueSpin MS7-H550-Pro was used (speed resolution: ±1 rpm, control accuracy of work plate ±1˚C [<100˚C] and the temperature is kept constant using external temperature sensor with accuracy of ±0.2˚C). The adsorption experiments were performed in a batch system with a 100 mL stoppered pyrex glass flask. The Cu(II) solution was filtered through Whatman filter paper (0.45 µm pore size) and heavy metal concentration of the initial and adsorbed solutions was meas-ured by atomic absorption spectrometry (iCE 3300 AAS, Thermo Fisher Scien-tific Inc., UK) with air/acetylene flame. QuanScien-tification of the metals was based upon calibration curves of standard solutions of copper ion. Scanning electron microscopy (SEM), (JSM-5300, Jeol Ltd., Japan) was used to examine the surface morphology and to image the SH adsorbent before and after adsorption at a magnification of 2000× with an acceleration voltage of 20 kV. The Fourier transform-infrared spectroscopy (Spectrum BX FT-IR, PerkinElmer Inc., USA) study was conducted using a spectral frequency range of 4400 - 350 cm−1. Bru-nauer-Emmett-Teller (BET) surface area was determined using (Gas sorption analyzer, Quantachrome Ltd., UK). Elemental analysis (C, H and N) was carried out using the Elemental Analyzer (EA 1108 CHNS-O, Fisons Ltd., UK).
2.2. Sesame Husk Adsorbent
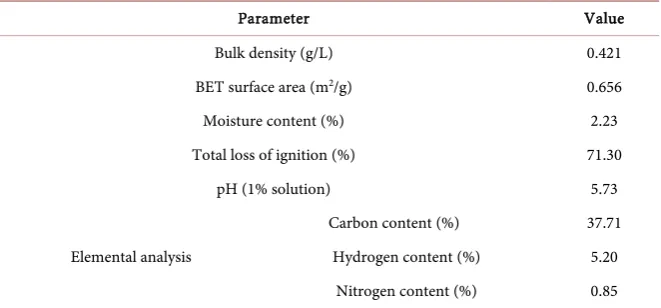
The adsorbent used in the present study was sesame husk (SH) which is brought from local company for manufacturing of Tahini in Alexandria, Egypt after the stage of separating sesame from its husk using sesame dehulling water tank. Se-same husk (SH) was grinded using herb grinder (speed: 25,000 rpm) to increase the surface area until fine powder is gained and then was sieved through a range of sieves, and only the particles that passed through a 0.25 mm mesh were used in our study. The sieves were shaken for around 15 min. After sieving, the sepa-rated particles of adsorbent was washed several times with Milli-Q water to re-move any particles adhering to the surface and any water-soluble particles, then was oven-dried at 70˚C for 2 h and the cycle of drying, cooling, dessicating and weighing was repeated until a constant weight is obtained. SH was chosen for the adsorption tests without any pre-treatment and was stored in dark polyester container for any further use. A summary of the properties of sesame husk ad-sorbent are listed in Table 1.
2.3. Experimental Procedure
Table 1. Physico-chemical characterization of the sesame husk.
Parameter Value
Bulk density (g/L) 0.421
BET surface area (m2/g) 0.656
Moisture content (%) 2.23
Total loss of ignition (%) 71.30
pH (1% solution) 5.73
Elemental analysis
Carbon content (%) 37.71 Hydrogen content (%) 5.20
Nitrogen content (%) 0.85
adsorbent, test solutions with pH values ranging from 2 to 6 (to permit a deter-mination of the optimum pH for adsorption) by dropwise addition of 0.1N so-dium hydroxide, NaOH (BDH) or 0.1N hydrochloric acid, HCl (BDH). All the chemical compounds used to prepare the reagent solutions were of Analar grade. After selecting the optimal pH, only one pH value was tested in all subsequent adsorption tests.
All the adsorption measurements were repeated three times to confirm re-producibility; hence, the reported value of metal ion adsorbed is the average of three measurements. Blanks containing no Cu(II) were used for each series of experiments. The adsorption capacity of SH was evaluated using the following expression [59]:
(
o e)
eC C V q
W
−
= (1)
where qe (mg/g) is the adsorbed heavy metal (copper) amount per unit mass of the adsorbed sesame husk (SH), Co (mg/L) is the initial concentration of heavy metal solution and Ce (mg/L) is the concentration of the heavy metal in the aqueous phase at equilibrium, V (L) the volume of the aqueous phase and W (g) is the amount of SH adsorbent used.
The percent removal (% R) of Cu(II) ions was calculated by using following Equation [60]:
(
)
% o t 100
o
C C
R C
−
= × (2)
where Co and Ct (mg/L) are the Cu(II) initial concentration and the concentra-tion at a given time t (min.) respectively.
3. Results and Discussion
3.1. Effect of pH
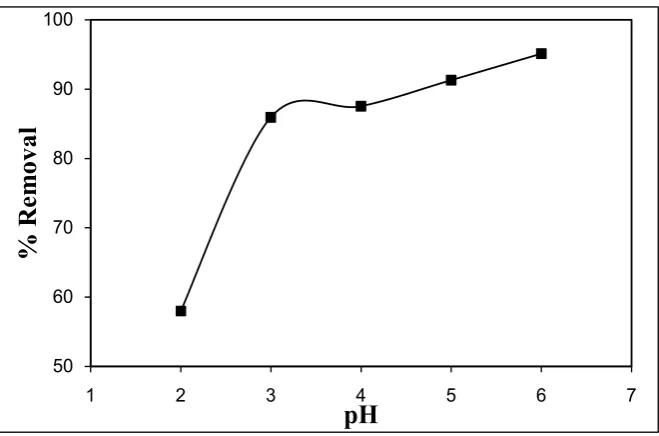
efficiency of Cu(II) cations was performed by contacting 1.0 g of sesame husk adsorbent with 100 mL of 30 mg/L concentration of Cu(II) ion solution for 60 minutes with changing the solution pH range from 2 to 6, at 298 K and the sam-ple was stirred using a magnetic stirrer at agitation speed 300 round per minute (rpm). As displayed in Figure 1, there is a noticed severe increase in the copper removal at equilibrium from 58.02% to 95.13% occurred when the pH values of the solutions changed from 2 to 6. Rising pH value above pH 6 causes precipita-tion and hampers the adsorpprecipita-tion where copper(II) ions will form the insoluble Cu(OH)2 precipitate [61] [62], so pH 6 was chosen as optimum pH for Cu(II) adsorption. The decrease of removal efficiency at low pH is due to:
1) The existence of higher concentration of hydronium ions in the solution which compete with the Cu(II) ions for the binding sites of adsorbent [63].
2) At low pH, the sesame husk surface is positively charged due to protona-tion which is obvious at low pH values due to the presence of high concentraprotona-tion of H+ ions in the solution. Thereafter, electrostatic repulsion between the posi-tively charged adsorbent surface and the metal ions in solution is engendered and the adsorption of Cu(II) becomes more unfavorable [64] [65].
3) The Cl− species in solution which come from adjusting the solution pH value using HCl, lead to decreasing of the free Cu(II) ions and increasing in the formation of the chloro complex CuCl+. The molecular size of this complex is larger than that of the free Cu(II) and is affect inversely on the adsorption, re-sulting decrease in copper uptake but this effect is very limited [13].
However, Increasing the pH leads to diminishing the hydronium ion concen-tration, the adsorbent surface became deprotonated and subsequently, increas-ing of Cu(II) uptake [66].
[image:6.595.209.539.487.705.2]Pandey et al. [67] studied the effect of Zeolite NaX as an adsorbent on removal of Cu(II) ions from aqueous stream and it was found that uptake capacity of
Figure 1. Effect of pH on the % removal of Cu(II) ions onto sesame husk (T: 298 K, 300 rpm, Co: 30 mg/L and 1.0 g of adsorbent).
50 60 70 80 90 100
1 2 3 4 5 6 7
%
R
em
oval
copper(II) ions was maximum at pH 6. The same results were observed by Hos-sain et al. [61] and Oo et al. [62].
3.2. Effect of Contact Time
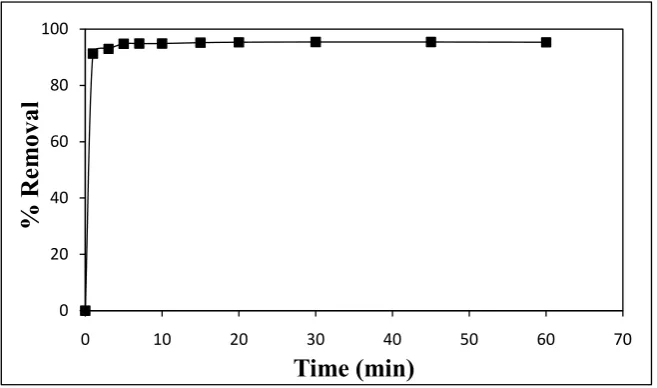
[image:7.595.208.537.497.691.2]One of the most critical parameters for successful adsorption process is deter-mining the percentage removal of metal ions by changing the contact time of the aqueous solution with the adsorbent. To study the effect of contact time, the ex-periment conducted with initial copper concentration (Co: 30 mg/L) at optimum pH 6, with a dose of 1.0 g of SH/100 ml Cu(II) solution at 298 K and rotation speed of 300 rpm with contact time of 1, 3, 5, 7, 10, 15, 20, 30, 45 and 60 mi-nutes. The effect of contact time on the percentage of Cu(II) elimination by SH adsorbent is shown in Figure 2. A two-stage manner was observed: firstly a highly fast stage, followed by a second slow stage of adsorption. The initial in-crease in the percentage adsorption of metal ions is attributed to existence of a large number of active sites on the SH surface that were swiftly occupied by a significant amount of copper ions. The second stage of low sorption rate until saturation process occurred due to two reasons: 1) the adsorbent pores become saturated at the initial stage of adsorption where the metal ions are adsorbed. Thus, a few numbers of ions are attached on the surface due to slower diffusion of solute into the interior of the adsorbent [68], 2) The binding sites were shortly become limited and the remaining unoccupied surface sites are hard to be occu-pied by copper ions due to the arising of repulsive forces between the copper on the solid surface and the residual copper in the liquid phase [69] [70] [71]. Only 10 - 15 minutes equilibration period was needed for SH adsorbent to achieve equilibrium; no considerable further metal adsorption was noticed up to 60 mi-nutes (Figure 2). However, a contact time of 30 min was set for the subsequent batch experiments. The elimination percentage of copper ions onto SH reached
Figure 2. Effect of contact time on the Cu(II) ions removal efficiency onto sesame husk at different initial concentrations (T: 298 K, 300 rpm, pH: 6 and 1.0 g of adsorbent for 60 min).
0 20 40 60 80 100
0 10 20 30 40 50 60 70
%
R
em
oval
95.13% after 15 minutes of contact time. The lower contact time to reach equili-brium observed in this study indicates that the adsorption process is quite fast.
3.3. Effect of Adsorbent Dosage
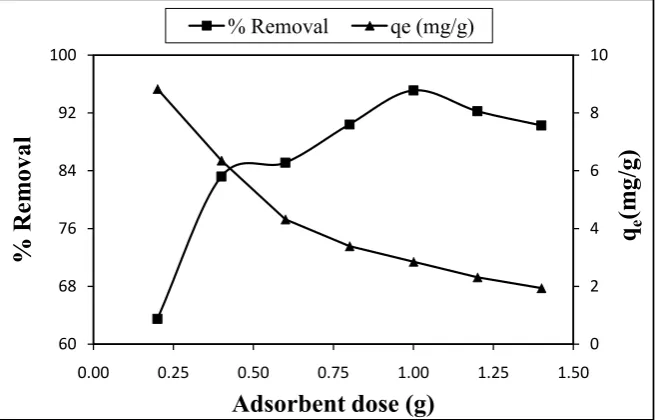
The effect of adsorbent dosage on Cu(II) ions percentage removal and adsorp-tion capacity was investigated using different doses: 0.2, 0.4, 0.6, 0.8, 1.0, 1.2 and 1.4 g in 100 mL of 30 mg/L Cu(II) by keeping other variables constant (at op-timal pH of 6, temperature: 298 K, agitation speed: 300 rpm, contact time: 30 min. and Co: 30 mg/L) as shown in Figure 3. Results show that with the increase in adsorbent dose from 0.2 to 1.0 g, the percentage removal of copper ions rose from 63.50% to 95.13% then it decreases to be 90.27% with the consequence in-crease in dose up to 1.4 g respectively. This rising in the heavy metal percentage removal with increasing the adsorbent dosage is plausible because of the increase in adsorbent surface area and the availability of more exchangeable binding sites on the surface which are ready for metal ion uptake [72] [73] [74] [75] [76]. De-creasing the adsorption efficiency with further increase in dose above 1.0 g could be interpreted as a result of a partial overlapping or aggregation of adsorbent ac-tive sites as a result of overcrowding of adsorbent particles [77] [78] [79], which results in interaction of active site with adsorbent atoms rather than adsorbate and thus, the total adsorption area decreases [80] [81].
[image:8.595.210.538.492.702.2]However, the copper(II) ions uptake capacity or amount of metal adsorbed (q, mg/g) decreases gradually upon increasing the dosage as shown in Figure 3. Adsorption capacity decreased from 8.839 mg/g at 0.2 g to 1.940 mg/g at 1.4 g. This occurs due to the fact that some adsorbent active sites stay unsaturated during the adsorption process. Hence, the number of unsaturated active sites available for sorption increases with increasing the adsorbent dose which can be ascribed to an insufficiency of metal ions in solution compared to the available
Figure 3. Effect of sesame husk dose on the % removal and adsorption capacity at equili-brium of Cu(II) ions (T: 298 K, 300 rpm, pH: 6 and Co: 30 mg/L for 30 min).
0 2 4 6 8 10
60 68 76 84 92 100
0.00 0.25 0.50 0.75 1.00 1.25 1.50
q
e(m
g/g)
%
R
em
oval
Adsorbent dose (g)
binding sites [82] [83] [84] [85]. Also, the decrease of qe with increasing the sor-bent mass is attributed the decrease of the adsorsor-bent total surface area and the increase in diffusion path length due to aggregation of adsorbent particles [86] [87] [88]. Furthermore upon increasing the adsorbent dosage, the binding sites of the adsorbent are shielded from metal where elevated dosage could impose a screening effect of the dense outer layer of the cells [89] [90].
3.4. Effect of Adsorbate Concentration
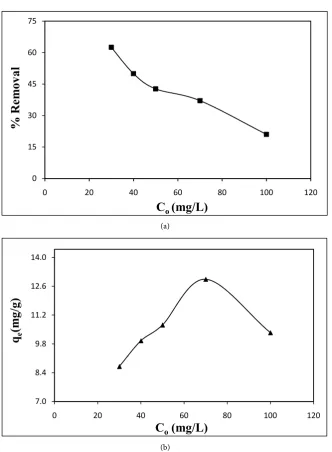
The experiment was carried out with variable initial copper ion concentrations (30, 40, 50, 70 and 100 mg/L) and constant temperature (298 K), pH (6.0), con-tact time (30 min.), adsorbent dosage (0.2 g) and shaking speed (300 rpm). It can be observed that the copper(II) ions removal rate decreases with the increase of the initial concentration. The percent adsorption (%) is given in Figure 4(a) which shows that the percentage of Cu sorption on sesame husk decreased from 62.53% to 21.01% as the initial Cu(II) concentration increased from 30 mg/L to 100 mg/L respectively. This is because at low concentration the sorbent have enough active sites which could be easily occupied by metal ions since the ratio of available adsorption binding sites to the initial number of Cu(II) metal ions is large. Whereas at higher concentration, there is no more active sites to be occu-pied and the ratio of available adsorption active sites become fewer. That’s why; Cu ions are left unadsorbed in solution and the percentage removal of Cu(II) ions which depends upon the initial concentration, decreases [91]. This result is found matching with recent studies by Bhatti et al. [92], Azouaou et al. [93] and
Yao et al. [94] where the percent of metal adsorption decreases with increasing
the concentration of adsorbate.
(a)
[image:10.595.207.540.60.513.2](b)
Figure 4. (a) Effect of initial concentration on the % removal of Cu(II) ions onto sesame husk (T: 298 K, 300 rpm, pH: 6 and 0.2 g of adsorbent for 30 min). (b) Effect of initial concentration on the adsorption capacity at equilibrium of Cu(II) ions onto sesame husk (T: 298 K, 300 rpm, pH: 6 and 0.2 g of adsorbent for 30 min).
Zhang and Wang [99] studied the effect of the initial concentration of Ni(II) ions on the adsorption capacity (qe) of lignocellulose/montmorillonite nano-composite and the trend obtained of adsorption capacity was the same as the current study. qe first increased with increasing initial Ni(II) concentration until it reached maximum at 0.0032 mol/L then decreased until 0.0036 mol/L.
Similarly, Ang et al. [100] determined the copper(II) adsorption effect by the neem leaf powder (NLP). Results showed that the adsorption capacity is in-creased with increasing the initial copper(II) ions concentration until it reaches maximum then decreased due to saturation of active groups. This is complied with the results obtained from the present study.
0 15 30 45 60 75
0 20 40 60 80 100 120
%
R
em
oval
C
o(mg/L)
7.0 8.4 9.8 11.2 12.6 14.0
0 20 40 60 80 100 120
q
e(m
g/g)
3.5. Effect of Temperature
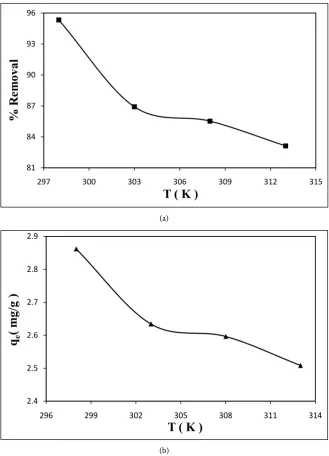
The adsorption of Cu(II) ions on sesame husk (SH) was examined for the initial solution concentration of 30 mg/L at 298, 303, 308 and 313 K. As presented in
Figure 5(a) and Figure 5(b), upon rising the temperature from 298 to 313 K,
the adsorption removal percentage decreased from 95.33% to 83.13% respec-tively. In the same manner, adsorption capacity of copper(II) metal ions onto SH decreased from 2.862 mg/g at 298 K to be 2.508 mg/g at 313 K. When the tem-perature is increased, degradation of the adsorbent and alteration of active func-tional groups take place which will vary the surface chemistry of sorbent and the
(a)
[image:11.595.208.538.221.678.2](b)
Figure 5. (a) Effect of temperature on the % removal of Cu(II) ions onto sesame husk (300 rpm, pH: 6, Co: 30 mg/L and 1.0 g of adsorbent for 30 min). (b) Effect of temperature on the adsorption capacity at equilibrium of Cu(II) ions onto sesame husk (300 rpm,pH: 6, Co: 30 mg/L and 1.0 g of adsorbent for 30 min).
81 84 87 90 93 96
297 300 303 306 309 312 315
%
R
em
oval
T ( K )
2.4 2.5 2.6 2.7 2.8 2.9
296 299 302 305 308 311 314
q
e( m
g/g
)
number of active functional groups available for adsorption of heavy metal ions decreases. Besides, bonds are ruptured at higher temperature so desorption is favored [100]. Additionally on increasing the temperature, the thickness of the boundary layer decreases because the metal ions tend increasingly to flee from the biomass surface to the solution phase which limits the adsorption capacity [101] [102]. Moreover, at higher temperatures the surface activity of the biomass decreases [103] [104], even there is a possibility of damaging the surface active sites which reduces the sorption ability of the materials [105]. Eventually, the loss in the adsorption capacity is caused by the change in the texture of the sor-bent and as a result of the material deterioration [106].
Alpat et al. [107] studied the effect of temperature on the biosorption capacity (qt) of Ni(II) on Circinella sp. and found that the increase in temperatures from 40˚C to 60˚C decreases the qt value. This decrease was ascribed to that, the bio-sorbent surface has been deactivated or some of biobio-sorbent’s active sites were destroyed.
Similar results were obtained by Aksu and İşoğlu [108] who reported that the equilibrium uptake capacity of copper(II) ions using dried sugar beet pulp of sorbent decreased from 24.6 to 12.3 mg/g with increasing temperature from 25 to 45˚C.
3.6. Effect of Agitation Speed
[image:12.595.210.537.478.703.2]The effect of agitation speed on adsorption of copper was studied over the range 100 - 500 rpm for 30 minutes with 100 ml solution containing 30 mg/L copper metal ions and 1.0 g of sesame husk. Figure 6 refers that the percent removal of adsorption increased from 87.81 to be maximum of 95.33% upon increasing the agitation speed from 100 rpm to 300 rpm. This agitation speed (300 rpm) was
Figure 6. Effect of agitation speed on the % removal of Cu(II) ions onto sesame husk (T: 298 K, pH: 6, Co: 30 mg/L and 1.0 g of adsorbent for 30 min.).
85 88 91 94 97 100
0 100 200 300 400 500 600
%
R
em
oval
chosen as an optimum speed to be applied for other experiments. The Low speed cannot distribute the particles properly in the metal solution but accumulated [71]. This will bury some of the binding active sites of the adsorbent layer and not all of the adsorbent active sites can adsorb the metal ions. That’s why, the agitation rate should be sufficient enough to assure that all the surface binding sites are already available for metal uptake [109]. However, increasing the agita-tion speed beyond 300 rpm will affect negatively on the Cu(II) ions percent re-moval where it decreased from 95.33% at 300 rpm to 90.39% at 500 rpm. This is attributed to an increase in desorption tendency of adsorbate ions [109]. In ad-dition, the high speed spreads vigorously the adsorbent particles in the solution and does not permit a sufficient time for adsorbent to bind with copper ions [110].
3.7. Thermodynamic Parameters
There is a possibility to determine the thermodynamic parameters for the ad-sorption reaction by considering the equilibrium constants under the several experimental conditions. These parameters could be calculated by the following Van’t Hoff equation [109] [111] [112]:
lnKC RS RTH
∆ ° ∆ °
= − (3)
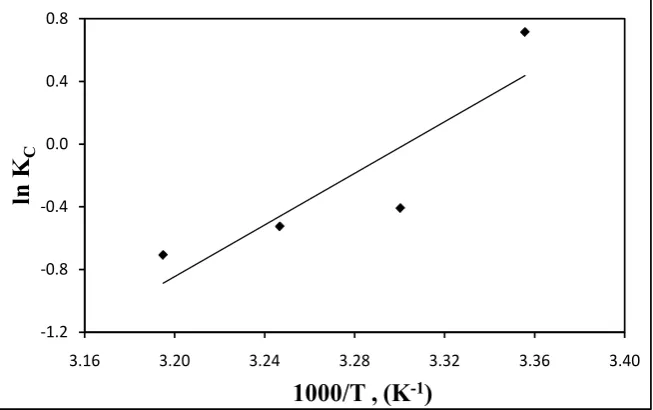
where R is universal gas constant (8.314 J/(mol·K)), T (K) is the absolute tem-perature in kelvin and Kc is the linear adsorption distribution coefficient defined as: Kc = Co/Ce in which Co and Ce (mg/L) are the initial adsorbate concentrations and adsorbate concentrations remained in the liquid phase at equilibrium re-spectively, ΔG° is the free energy of adsorption, ΔH° (kJ/mol) is the enthalpy change and ΔS° (J/(mol·K)) is the entropy change.
[image:13.595.210.537.496.701.2]By plotting a graph between lnKc and 1/T as shown in Figure 7, a straight line
Figure 7. Effect of temperature on the thermodynamic behavior of adsorption of Cu(II) ions onto sesame husk (300 rpm, pH: 6, Co: 30 mg/L and 1.0 g of adsorbent for 30 min).
-1.2 -0.8 -0.4 0.0 0.4 0.8
3.16 3.20 3.24 3.28 3.32 3.36 3.40
ln K
C
is obtained from which ΔH° and ΔS° values were estimated from slope and in-tercept respectively.
There is a direct relation between the change in Gibbs free energy upon ad-sorption ΔG° (kJ/mol) and both of the entropy change (ΔS°) and heat of adsorp-tion (ΔH°) which can be calculated by the equation [13]:
G H T S
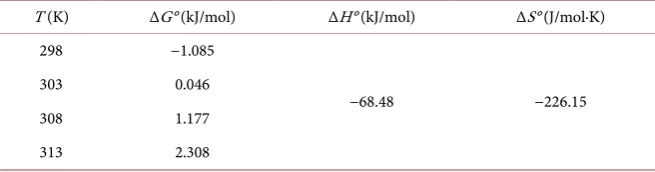
∆ ° = ∆ ° − ⋅ ∆ ° (4) The thermodynamic parameters are displayed in Table 2. The negative value of ΔH° implies that the adsorption phenomenon is exothermic in nature. The sign of ΔS° indicates whether the adsorption reaction is an associative or disso-ciative mechanism. As shown in Table 2, since ΔS° has a negative value so an associative mechanism is involved during the adsorption process. Adsorption leads to order through the formation of an activated complex between adsorbate and adsorbent [109]. Also, ΔS° sign plays an important role in reflecting whether the order of the adsorbate at the solid/solution interface during the adsorption process becomes less random (ΔS° < 0) or more random (ΔS° > 0) [113]. More-over, negative ΔS° value involves decreasing in the degree of freedom of Cu(II) ions in the solution.
The negative values of ΔG° indicate that the adsorption process is spontane-ous However, the ΔG° value changed from negative to positive value on in-creasing the temperature which means that the adsorption reaction is non-feas- ible and non-spontaneous at higher temperature indicating that the spontaneous nature of adsorption is inversely proportional to the temperature [114].
3.8. Characterization of Sesame Husk
3.8.1. Fourier Transform-Infrared Spectroscopic Analysis (FT-IR)
Examination the characteristic functional groups that makes the adsorption possible was done by Fourier Transform-Infrared Spectroscopic Analysis (FT- IR). The FT-IR spectra of sesame husk before and after adsorption of Cu(II) ions are shown in Figure 8. Different types of functional groups were detected in the adsorbent where the infrared spectrum displayed a large number of adsorption peaks.
[image:14.595.209.537.647.733.2]The broad band peak at 3455.00 cm−1 was assigned to the stretching vibration of hydroxyl groups (O-H) of hydrogen bonded alcohols, phenols on the surface of sesame husk [115] [116] and −NH stretching [84] [117] but after adsorption it was slightly shifted to higher frequency at 3455.60 cm−1. The peaks at 2926.62 and 2856.38 cm−1 were due to the stretching vibration of CH3 and CH2 groups
Table 2. Thermodynamic parameters for the adsorption of Cu(II) onto sesame husk.
T (K) ∆G° (kJ/mol) ∆H° (kJ/mol) ∆S° (J/mol·K)
298 −1.085
−68.48 −226.15
303 0.046
308 1.177
Figure 8. FTIR Spectra of sesame husk (a) before adsorption and (b) after adsorption of Cu(II) ions.
from the carbon dioxide (CO2) in air, they were shifted to 2361.87 and 2338.14 cm−1 respectively [119] [120]. The strong band that appeared at 1710.81 cm−1 is corresponding to the stretching C=O of ketone [121] [122] [123] and its intensi-ty was decreased a bit to be 1710.58 cm−1. The band at 1621.11 cm−1 could be at-tributed to stretching vibration of CO from carboxylic acid in the presence of intermolecular hydrogen bonding [124]. The band at 1460.88 cm−1 is characte-ristic to the scissoring vibrations of −CH2 functional groups in lipids [125] [126] [127]. The band at 1316.25 cm−1 is ascribed to −CH2 wagging vibration in cellu-lose and hemicellucellu-loses [128]. The band at 1157.61 cm−1 can be ascribed to the vibration of C-O-C in polysaccharides (cellulose and hemicelluloses) [129] [130]
[131] [132]. The band at 1102.87 cm−1 can be indicative of O-H associated with
cellulose and hemicelluloses [133] [134]. The peak at 1058.38 cm−1 presented the C–O stretching vibration in the lignin structure [135] [136] and the shifting from 1058.38 to 1060.02 cm−1 clearly showed the interaction of copper(II) with oxygen lone pair [136]. It can be noticed that, the characteristic peaks intensities were increased from 1621.11, 1460.88, 1316.25, 1157.61, 1102.87 and 1058.38 cm−1 to 1625.70, 1462.09, 1317.76, 1161.37, 1104.25 and 1060.02 cm−1 respec-tively. The band at 956.48 cm–1 is correlating to = C-H indicating the presence of alkenes [137] and after adsorption it was varied to be 956.25 cm−1. The peak at 886.77 cm−1 is representative for the out-of-plane C-H bending motions in ter-minal methylene groups [138] which was shifted to 890.83 cm−1. The peaks at 780.14 and 667.22 cm−1 refer to C-H out-of-plane bending (alkenes) and O-H out-of-plane bending (alcohols and phenols) respectively [139] [140]. The peak shown at 515.57 cm−1 is from O-C-O in plane bending [141]. These peaks around 780.14 cm−1 shifted to 781.05 cm−1, 667.22 cm−1 shifted to 670.44 cm−1 and 515.57 cm−1 changed to 516.00 cm−1.
After the sesame husk was loaded with copper, it was observed that there are differences in the intensities or the locations of the absorbance peaks. This shift in wave number corresponds to a change in bonding energy of the functional groups such as hydroxyl, amine group, carbonyl and carboxyl groups, alkenes groups or oxygen lone pair. This FT-IR result indicates that these functional groups in the sesame husk participated in the adsorption process and binding of copper ions [84] [115] [142] [143] [144].
3.8.2. Scanning Electron Microscopy
Figure 9. SEM images of sesame husk (a) before adsorption and (b) after adsorption of Cu(II) ions.
From the characterization of the adsorbent, there is a high affinity between SH and Cu(II) ions due to the rough surface and functional groups of sesame husk which adsorb copper metal cations from solution.
3.9. Adsorption Isotherm Study
The adsorption isotherm is a primary tool for understanding the surface nature of the adsorbent. However, selecting the right suitable adsorption equation for different concentration ranges presents a clear picture of the surface.
Du-binin-Radushkevich (D-R) isotherms.
3.9.1. Langmuir Isotherm
The Langmuir adsorption isotherm assumes that adsorption takes place at total-ly homogenous adsorption surface [13] [64] [146] [147]. Further assumption is that the maximum adsorption corresponds to a saturated monolayer of adsor-bate molecules on adsorbent surface and there is no significant interaction among adsorbed species. Thus, the adsorption energy is constant and there is no transmigration of adsorbate in the plane of the adsorbent surface [148] [149] [150] [151].
The equilibrium data for metal cations have been correlated with the Lang-muir isotherm over the concentration range of copper metal ions from 30 to 100 mg/L at 298 K. The Langmuir isotherm represented by the following equation [152]:
max max
1 1
e
e e
C C
q =q ⋅b q+ (5)
qe (mg/g) is the equilibrium adsorption capacity of ions on the adsorbent, Ce (mg/L) is the equilibrium ion concentration in solution, qmax (mg/g) is the maximum capacity of the adsorbent , which represents monolayer coverage of adsorbent with adsorbate, b (L/mg) is the Langmuir adsorption constant. qmax and b are Langmuir constants related to adsorption efficiency and energy of ad-sorption respectively [149]. As shown in Figure 10, the linear plot of Ce/qe ver- sus Ce suggests the applicability of the Langmuir isotherm with a slope of
max 1
q
and intercept of max
1
q ⋅b. The Langmuir model effectively described the adsorp- tion data with R2 value larger than 0.97.
[image:18.595.210.537.516.702.2]The adsorption isotherms of Cu(II) exhibit Langmuir behavior, which indi-cates a monolayer adsorption and the applicability of adsorption process can be
Figure 10. The linearized Langmuir adsorption isotherm for Cu(II) ions adsorption by sesame husk (T: 298 K, pH: 6, 300 rpm and 1.0 g of adsorbent for 30 min).
0.0 1.7 3.4 5.1 6.8 8.5
0 15 30 45 60 75 90
C
e/q
eidentified by dimensionless constant separation factor (RL) [153] which is shown below:
1 1 L
i R
bC
=
+ (6)
where Ci is the initial concentration of Cu(II). The RL value indicates whether the adsorption is: Unfavorable: RL> 1; Linear: RL= 1; Favorable: 0 < RL< 1; Ir-reversible: RL= 0. As presented in Table 3, RL values were 0.008, 0.005, 0.004, 0.003 and 0.002 for initial concentration of 30, 40, 50, 70 and 100 mg/L respec-tively. Since the RL values are found to be in the range between 0 and 1, this in-dicates that the adsorption of Cu(II) metal cations onto the adsorbent (sesame husk) is favorable [13] [88] [154] [155].
3.9.2. Freundlich Isotherm
The Freundlich isotherm gives the relationship between equilibrium liquid and solid phase capacity consisting of heterogeneous surface of the adsorbent or sur-face supporting sites of diverse affinities [151] [156] [157] and this isotherm is applicable to multilayer sorption [64]. It states that the ratio of the amount of solute adsorbed onto a given mass of adsorbent to the concentration of the so-lute in the solution is not constant at different concentrations [158].
The logarithmic form of Freundlich [159] is represented by the following Eq-uation:
( )
( )
1( )
log qe =log Kf +nlog Ce (7)
[image:19.595.209.531.570.731.2]Equilibrium capacity qe and Ce are defined as above while Kf is the Freundlich adsorption constant representing the adsorption capacity, n is the empirical pa-rameter relating the adsorption intensity of the solid adsorbent which varies with the heterogeneity of material. The magnitude of n gives a measure of the favorability of adsorption. If the value of n between 1 and 10 (1/n is lower than 1), this represents that the surface of the adsorbent was heterogeneous and ad-sorption occurred easily [64] [151] [157] [160] [161].
Table 3. Parameters of Langmuir, Freundlich and Dubinin-Radushkevich (D-R) iso-therms for the adsorption of Cu(II) ions onto sesame husk.
Adsorption isotherm model
Langmuir Freundlich Dubinin-Radushkevich (D-R)
qmax (mg/g)
b (L/mg)
RL (at different concentrations)
R2 n Kf (L/g) R2
Xm (mg/g)
β
(mol2/J2) (kJ/mol) RE 2
10.83 4.569
0.008 (at 30 mg/L)
0.9740 8.210 6.933 0.4197 11.37 5.0 × 10⁻⁶ 0.316 0.6046 0.005 (at 40 mg/L)
0.004 (at 50 mg/L) 0.003 (at 70 mg/L)
When logqe is plotted against logCe, a straight line with a slope 1/n and inter-cept logKf as obtained in Figure 11. In this study, the Freundlich plots yielded values for the coefficients Kf and n were 6.933 and 8.210 respectively as appears in Table 3. This n value indicates that the adsorption intensity is favorable [162] [163].
Figure 11. Freundlich adsorption isotherm for Cu(II) ions adsorption by sesame husk (T: 298 K, pH: 6, 300 rpm and 1.0 g of adsorbent for 30 min).
3.9.3. Dubinin-Radushkevich (D-R) Isotherm
The Dubinin-Radushkevich (D-R) isotherm [164] explains multilayer formation in microporous solids. The Dubinin-Kaganer-Radushkevich (DKR) equation more general than the Langmuir isotherm since it does not assume a homoge-neous surface or constant adsorption potential whereas it has been widely used to explain energetic heterogeneity of solid surfaces at low coverage. It was ap-plied in order to distinguish between physical and chemical adsorptions [88] [147] [165]. The D-R equation has the following form:
( )
2lnqe=ln Xm −βε (8) Xm (mg/g) is the theoretical monolayer saturation capacity, β (mol2/kJ2) is the activity coefficient related to the mean free energy of adsorption per mole of the adsorbate when it is transferred from infinity in the solution to the surface of the solid and ε (J/mol) is Polanyi potential which is equal to:
1 ln 1
e RT
C
ε= +
(9)
where R is gas constant (R = 8.314 J/(mol·K)) and T is temperature (K).
The mean free energy E (kJ/mol) is calculated using the relationship [166] [167] [168]:
1 2
E= β (10)
The plot of lnqe against ε2 for metal ions adsorption on sesame husk is shown in Figure 12. The slope yields β (mol2/kJ2) and the intercept yields the adsorption
0.90 0.95 1.00 1.05 1.10 1.15
0.8 1.0 1.2 1.4 1.6 1.8 2.0
log q
e
capacity Xm(mg/g). From the results in Table 3, the difference of qmax derived from Langmuir and Xm derived from D-R model may be attributed to the dif-ferent definition of maximum capacity in the two models. In Langmuir model
qmaxrepresents the maximum adsorption of metal ions at monolayer coverage, but in D-R model Xm represents the maximum adsorption of metal ions at the total specific micropores volume of the adsorbent [88] [169].
[image:21.595.209.538.265.466.2]The magnitude of E is used for estimating the type of adsorption mechanism. If the magnitude of E is between 8 and 16 kJ/mol, it is indicated that the adsorp-tion process is chemical adsorpadsorp-tion, while for value of E < 8 kJ/mol; the adsorp-tion process is physical in nature. The E value for Cu(II) on the sesame husk is 0.316 kJ/mol. The value of E is below 8 kJ/mol which indicates that physical ad-sorption is involved in the adad-sorption process [88] [170] [171] [172] [173].
Figure 12. D-R isotherm adsorption plot for Cu(II) ions onto sesame husk (T: 298 K, pH: 6, 300 rpm and 1.0 g of adsorbent for 30 min).
As seen in Table 3, the value of maximum adsorption capacity (Xm) obtained from D-R model is more than the value of adsorption capacity (qmax) obtained from the Langmuir isotherm. On the other side, the correlation coefficient value of the linear plot of the Langmuir isotherm (R2 = 0.9740) was more satisfactory than those obtained by Freundlich and D-R models (R2 = 0.4197 and 0.6046 re-spectively) which means that Langmuir isotherm model fits quite well with the experimental data and is very suitable for describing the adsorption equilibrium of Cu(II) on SH. The maximum adsorption capacity (qmax) of copper ions on SH was 10.83 mg/g at 298 K. The complying of results with the Langmuir isotherm may be due to the homogeneous distribution of active sites on SH surface, since the Langmuir equation supposes that the surface is homogeneous.
This is in line with results reported by Cozmuta et al. [174] who studied the adsorption of lead metal ions on Na-clinoptilolite and by Li et al. [175] who stu-died the adsorption of Cu(II) ions on amino-functionalized magnetic nanopar-ticles.
2.00 2.12 2.24 2.36 2.48 2.60
0.0 1.0 2.0 3.0 4.0 5.0 6.0
Ln q
e
3.9.4. Comparison of Maximum Adsorption Capacity of Different Adsorbents for Cu(II) Ions
[image:22.595.63.532.171.741.2]Various adsorbents were investigated for Cu(II) ions removal. The adsorption capacities of such sorbents are given in Table 4. It is obvious that, the adsorption capacity of sesame husk towards Cu(II) is comparable or even better than 39 of
Table 4. Comparison of maximum adsorption capacity (qmax) of different reported adsorbents for Cu(II) ions.
Adsorbent qmax References
Sugarbeet pulp Grape stalk wastes Raw pomegranate peel Palm shell activated carbon
Low-rank Turkish coals Sawdust Bagasse fly ash
Modified saw dusts using phosphoric acid (PMSD4) Cocoa shell
Bagasse Shells of rice Poplar sawdust
Almond shell Orange peel Sugarcane bagasse (SB) Coconut tree sawdust (CTS)
Papaya seed
Elaeis guineensis kernel activated carbon Unmodified jute fibre
Groundnut shells Banana peel
H3PO4-activated rubber wood sawdust Cotton fibre
Hazelnut shell Walnut shell
NaOH modified sawdust (poplar tree) Phosphate rock Corn cobs Oxidized jute Wheat shell Peanut hulls Corn starch Tea-industry waste
Rubber tree leaf Coir fibre Pine bark Maple wood sawdust
Shells of lentil Apple wastes Volcanic rock Oil palm leaf powders
Cotton boll Tree fern
Sesame husk (Langmuir model) Sesame husk (D-R model)
0.15 mg/g 0.78 mg/g 1.32 mg/g 1.58 mg/g 1.62 mg/g 1.79 mg/g 2.26 mg/g 2.66 mg/g 2.86 mg/g 2.89 mg/g 2.95 mg/g 3.24 mg/g 3.62 mg/g 3.65 mg/g 3.65 mg/g 3.89 mg/g 3.90 mg/g 3.93 mg/g 4.23 mg/g 4.46 mg/g 4.75 mg/g 5.73 mg/g 6.12 mg/g 6.65 mg/g 6.74 mg/g 6.92 mg/g 7.24 mg/g 7.62 mg/g 7.73 mg/g 8.34 mg/g 8.37 mg/g 8.57 mg/g 8.64 mg/g 8.92 mg/g 9.43 mg/g 9.47 mg/g 9.51 mg/g 9.59 mg/g 10.80 mg/g 10.87 mg/g 11.22 mg/g 11.40 mg/g 11.70 mg/g 10.83 mg/g 11.37 mg/g
Pehlivan et al. Villaescusa et al. El-Ashtoukhy et al.
Onundi et al. Karabulut et al.
Yu et al. Gupta and Ali Kalavathy and Miranda
Meunier et al. Habib et al. Aydin et al. Šćiban and Klašnja Altun and Pehlivan Annadurai et al.
Putra et al. Putra et al. Ahamed and Begum
Tumin et al. Shukla and Pai Shukla and Pai Annadurai et al.
Kalavathy et al. Paulino et.al. Altun and Pehlivan Altun and Pehlivan
Šćiban et al. Cao et al. Reddad et.al. Shukla and Pai
Basci et al. Brown et al. Reddad et.al. Çay et al. Ngah and Hanafiah
Shukla and Shukla Al-Asheh et al. Rahman and Islam,
Aydin et.al. Lee and Yang Sekomo et al. Sulaiman et al. Ozsoy and Kumbur
43 other reported adsorbents, referring the promising future for sesame husk utilization in copper ions removal from aqueous solutions.
3.10. Adsorption Kinetics
Several adsorption kinetic models such as pseudo first-order, pseudo second- order and intra-particle diffusion models had been used to understand the cha-racteristics and mechanism of adsorption [209] and the rate-limiting step during adsorption process [88].
3.10.1. Pseudo First-Order Model
The adsorption rate constant suggested by Lagergren [210] and Ho [211] by ap-plying first-order reaction kinetic is given by Equation (11):
(
)
1
d
dt e t
q k q q
t = − (11)
where k1 is the adsorption rate constant for the first order adsorption, qt (mg/g) is the amount of Cu(II) metal adsorbed at time t and qe (mg/g) is the amount of heavy metal adsorbed at saturation.
The integration of the Equation (11) gives the following expression:
(
)
1 1ln
q q
e−
t= − +
k t C
(12)where C1 is the integration constant for first-order reaction kinetic.
If it is supposed that q = 0 at t = 0, then the pseudo first-order kinetic model is expressed by:
(
)
1ln
q q
e−
t=
ln
q k t
e−
(13) where qeand qt (mg/g) are the amounts of Cu(II) ions adsorbed onto sesame husk at equilibrium and at time t, respectively and k1 (min−1) is the rate constant of pseudo first-order kinetic model.The straight line plots of
ln
(
q q
e−
t)
against t were used to determine the k1 [image:23.595.224.521.520.707.2]and theoretical qe. As seen in Figure 13 although the plot was linear, the calculated
Figure 13. Pseudo first-order plot for the adsorption of Cu(II) ions onto sesame husk at different initial concentrations (T: 298 K, 300 rpm, pH: 6 and 1.0 g of adsorbent).
-4
-3
-2
-1
0 1
0 1 2 3 4 5 6 7 8
ln (
q
e-q
t)
Time (min)
value (qe,calc.) and the experimental value (qe,exp.) were not in agreement with each other referring a poor pseudo first-order kinetic model fit. Moreover, this kinetic model does not fit well to the whole range of contact time. It could only be ap-plied over the initial stage of the adsorption process (1 - 7 minutes) [88] [212] [213].
3.10.2. Pseudo Second-Order
The pseudo second-order model [214] [215] based on equilibrium adsorption is evaluated using the relationship:
2 2
1 1
t e e
t t
q =k q +q (14)
where k2 is the rate constant of pseudo second-order kinetic model (g/(mg. min)). The straight line plots of t/qt against t (Figure 14) were used to determine the k2 and qe,calc.. This model was more likely to predict the behavior over whole range of contact time. According to results in Table 5, the R2 value for the pseudo second-order kinetic model was very close or even equal to unity. Moreover, the calculated equilibrium adsorption capacity values qe,calc. were very close to the experimental qe,exp. values indicating that the adsorption process of copper ions onto SH obeys pseudo second-order model kinetics at all initial Cu(II) concen-trations.
[image:24.595.239.506.501.705.2]In general, the adsorption process on a porous adsorbent will have four main stages. These stages involve: 1) the movement of the adsorbate from the bulk solution to the exterior film surrounding the adsorbent particle (bulk solution transport), 2) the transport of adsorbate across the external liquid film to the ex-ternal surface sites on the adsorbent particle (film diffusion transport), 3) Migra-tion of adsorbate within the pores of the adsorbent by intra-particle diffusion (pore diffusion) and finally 4) adsorption of adsorbate at internal surface sites [216] [217].
Figure 14. Pseudo second-order plot for the adsorption of Cu(II) ions onto sesame husk at different initial concentrations (T: 298 K, 300 rpm, pH: 6 and 1.0 g of adsorbent).
0.0 0.8 1.6 2.4 3.2 4.0
0 5 10 15 20 25 30
t/qt
Time (min)
Table 5. Comparison of kinetic parameters for the adsorption of Cu(II) ions onto sesame husk at different concentration (T: 298 K, speed: 300 rpm, pH: 6 and 1.0 g of adsorbent).
Kinetic model parameters
Concentration (mg/L) 30
mg/L mg/L 40 mg/L 50 mg/L 70 mg/L 100 qe, exp. (mg/g) 8.704 9.954 10.72 12.94 10.35
Pseudo first-order
qe, calc. (mg/g) 1.371 1.782 0.746 0.800 1.521 k1 (min−1) 0.478 0.295 0.225 0.188 0.267 R2 0.8521 0.9924 0.5798 0.9649 0.9579 ∆qe (%) 97.62 94.92 107.5 108.4 98.59
Pseudo second-order
qe, calc. (mg/g) 9.066 10.19 10.79 13.11 10.53 k2 (g/(mg·min)) 0.372 0.336 0.966 0.539 0.424 R2 0.9999 1.0000 0.9999 1.0000 0.9999 ∆qe (%) 2.961 2.234 0.534 1.130 1.495
Intra-particle diffusion
kp (mg/(g·min1/2)) 0.205 0.298 0.160 0.180 0.283 C 7.999 8.732 10.06 12.21 9.190 R2 0.9219 0.8068 0.6835 0.8549 0.7514 ∆qe (%) 3.252 3.957 2.122 1.985 3.621
3.10.3. Intra-Particle Diffusion
The description of the adsorption process in a well-stirred batch adsorption sys-tem which occurs on a porous adsorbent is rebated by applying [218] intra-par- ticle diffusion model. The formation of this model is as follows:
1 2
t p
q k t= +C (15) where qt (mg/g) is the amount of Cu(II) ions adsorbed onto sesame husk at time
t, and kp (mg/(g·min1/2)) is the intra-particle diffusion rate constant. The straight line plots of qtagainst t1/2 were used to determine the intra-particle diffusion rate (kp, slope), correlation coefficient R2 and the intra-particle diffusion constant mg/g (C, intercept) related to the thickness of the boundary layer: the larger the intercept, the greater the boundary layer effect [219] as shown in Table 5.
Based on Figure 15, the plot showed multi-linearity correlation which reveals that more than one step occurred during the adsorption process. Step “one” is the diffusion through the solution to the external surface of the adsorbent (the initial linear portions) which is also known as external mass transfer or film dif-fusion [220], whereas step “two” corresponds to the intra-particle difdif-fusion into the porous structure of the adsorbent [74] [221]. The later horizontal portions of the plot were slow and controlled by equilibrium diffusion mechanism [222].
Figure 15. Intra-particle diffusion fit for the adsorption of Cu(II) ions onto sesame husk at different initial concentrations (T: 298 K, 300 rpm, pH: 6 and 1.0 g of adsorbent).
3.10.4. Test of Kinetic Validity:
To check quantitatively the validity of the used kinetic models in this study, a normalized standard deviation Δqe (%) is calculated by the following equation [225] [226]:
( )
(
, . , .)
, . 2%
1
e exp e calc e exp e
q q q
q
n
= −
∆
−
∑
(16)
where n is the number of data points, qe,exp. (mg/g) is the observed experimental value, qe,calc.(mg/g) is the calculated qe from the models and the calculated results are listed in Table 5. It was found that the pseudo second-order kinetic model yielded the lowest Δqe(%) values. This agrees with the earlier obtained R2 values and confirms that the adsorption of Cu(II) ions onto sesame husk can be best described by the pseudo second-order kinetic model; the values of correlation coefficients (R2) obtained for the linear plots from the pseudo second-order model are greater than those obtained for the pseudo first-order and intra-par- ticle diffusion models under all conditions studied. Also, the values of Δqe(%) obtained for the pseudo second-order model were lower than those obtained from the pseudo first-order and intra-particle diffusion model under all condi-tions studied. Therefore, the adsorption of Cu(II) ions onto sesame husk adsor-bent can be best described by the pseudo second-order kinetic model due to the higher correlation coefficient and a good agreement between the experimental and the calculated qevalue.
3.11. Type of Adsorption
The type of adsorption can be estimated from four parameters ΔH°, activation energy Ea, the mean free energy E= 1 2β and effect of temperature as follows:
The negative value of ΔH° for adsorption of Cu ions implies that the adsorp-tion phenomenon is exothermic in nature [109]. According to literature [227] [228] [229], if the enthalpy change value ΔH° of adsorbent is higher than 40
7.80 8.85 9.90 10.95 12.00 13.05
0 1 2 3 4 5 6
q
t(m
g/g)
t
1/2(min
1/2)
kJ/mol, the process is chemisorption which includes strong electrostatic chemi-cal bonding between metal ions and adsorbent surface and when enthalpy change value is less than 20 kJ/mol, it indicates the adsorption is physical in na-ture. In this study, the ΔH° value for adsorption was −68.48 kJ/mol for Cu which reveal that the chemical adsorption (chemisorption) is involved for adsorption of Cu ions on SH adsorbent.
The magnitude of activation energy gives an idea about the type of sorption. Low activation energies Ea (5 - 40 kJ/mol) are characteristics for physisorption, while higher activation energies (40 - 800 kJ/mol) suggest chemisorption [230]
[231]. The obtained Ea value (112.37 kJ/mol) indicates that the adsorption
be-tween Cu metal ions and adsorbent corresponds to chemisorption.
The magnitude of E is used for estimating the type of adsorption mechanism. If the magnitude of E is between 8 and 16 kJ/mol, it is indicated that the adsorp-tion process is chemical adsorpadsorp-tion, while for value of E < 8 kJ/mol; the adsorp-tion process is physical in nature (physisorpadsorp-tion). The E value for Cu(II) on the sesame husk was 0.316 kJ/mol. The value of E is below 8 kJ/mol which refer that; physical adsorption is involved in the adsorption process on the adsorbent sur-face [88] [170] [171] [172] [173].
The trend of adsorption upon increasing the temperature can refer to the type of adsorption mechanism. In physical adsorption (physisorption), the force of attraction existing between adsorbate and adsorbent are Vander Waal’s forces (the force of attraction between the adsorbate and adsorbent are weak), therefore this type of adsorption can be easily reversed by heating or by decreasing the pressure which is called desorption. While in chemical adsorption (chemisorp-tion), the adsorbate is chemically bound to the adsorbent and as a result, the forces between the two become 10 - 100 times greater than in physisorption [232] [233]. In the present study, the adsorption decreased upon rising temper-ature; this reversible behavior indicates that “physical adsorption occurred”.
These results suggested that the adsorption of copper(II) ions onto SH in-volves chemisorption as well as physisorption mechanism. From literature [149] [234] [235], both physical and chemical adsorption may occur on the surface at the same time; a layer of molecules may be physically adsorbed on top of an un-derlying chemisorbed layer.
4. Conclusion
aqueous solutions (95.13% removal of 30 mg/L Cu(II) ions solution with small dose of SH (1.0 g/100ml) within 30 min. only) and thus this adsorbent would exhibit a promising technique for industrial wastewater cleanup.
References
[1] de Luna, M.D., Flores, E.D., Cenia, M.C. and Lu, M.C. (2015) Removal of Copper Ions from Aqueous Solution by Adlai Shell (Coix lacryma-jobi L.) Adsorbents. Bio-resource Technology, 192, 841-844. https://doi.org/10.1016/j.biortech.2015.06.018 [2] Vafakhah, S., Bahrololoom, M.E., Bazarganlari, R. and Saeedikhani, M. (2014)
Re-moval of Copper Ions from Electroplating Effluent Solutions with Native Corn Cob And Corn Stalk and Chemically Modified Corn Stalk. Journal of Environmental Chemical Engineering, 2, 356-361. https://doi.org/10.1016/j.jece.2014.01.005 [3] Lee, H.W., Cho, H.J., Yim, J.H., Kim, J.M., Jeon, J.K., Sohn, J.M., Yoo, K.S., Kim,
S.S. and Park, Y.K. (2011) Removal of Cu(II)-Ion over Amine-Functionalized Me-soporous Silica Materials. Journal of Industrial and Engineering Chemistry, 17, 504- 509. https://doi.org/10.1016/j.jiec.2010.09.022
[4] Nilanjana, D. (2010) Recovery of Precious Metals through Biosorption—A Review. Hydrometallurgy, 103, 180-189. https://doi.org/10.1016/j.hydromet.2010.03.016 [5] Lina, R.V. and Nilanjana, D. (2015) Application of Nano-Biocomposites for
Re-mediation of Heavy Metals from Aqueous Environment: An Overview. Internation-al JournInternation-al of ChemTech Research, 8, 566-571.
[6] Feng, Y.J., Yang, L.S., Liu, J.F. and Logan, B.E. (2016) Electrochemical Technologies for Wastewater Treatment and Resource Reclamation. Environmental Science: Wa-ter Research & Technology, 2, 800-831.
[7] Marder, L., Sulzbach, G.O., Bernardes, A.M. and Ferreira, J.Z. (2003) Removal of Cadmium and Cyanide from Aqueous Solutions through Electrodialysis. Journal of the Brazilian Chemical Society, 14, 610-615.
https://doi.org/10.1590/S0103-50532003000400018
[8] Cañizares, P., de Lucas, A., Pérez, Á. and Camarillo, R. (2005) Effect of Polymer Nature and Hydrodynamic Conditions on a Process of Polymer Enhanced Ultrafil-tration. Journal of Membrane Science, 253, 149-163.
https://doi.org/10.1016/j.memsci.2004.12.042
[9] Trivunac, K. and Stevanovic, S. (2006) Removal of Heavy Metal Ions from Water by Complexation-Assisted Ultrafiltration. Chemosphere, 64, 486-491.
https://doi.org/10.1016/j.chemosphere.2005.11.073
[10] Kumano, M., Yabutani, T., Motonaka, J., Mishima, Y. and Mishima, Y. (2006) Re-covery and Extraction of Heavy Metal Ions Using Ionic Liquid as Green Solvent. International Journal of Modern Physics B, 20, 4051-4056.
https://doi.org/10.1142/S0217979206040842
[11] Verma, V.K., Tewari, S. and Rai, J.P.N. (2008) Ion Exchange during Heavy Metal Bio-Sorption from Aqueous Solution by Dried Biomass of Macrophytes. Biore-source Technology, 99, 1932-1938. https://doi.org/10.1016/j.biortech.2007.03.042 [12] Ajmal, M., Khan, A.H., Ahmad, S. and Ahmad, A. (1998) Role of Sawdust in the
Removal of Copper (II) from Industrial Wastes. Water Research, 32, 3085-3091.
https://doi.org/10.1016/S0043-1354(98)00067-0
[14] Wang, X.S. and Qin, Y. (2005) Equilibrium Sorption Isotherms for Cu2+ on Rice Bran. Process Biochemistry, 40, 677-680.
https://doi.org/10.1016/j.procbio.2004.01.043
[15] Mauchauffée, S. and Meux, E. (2007) Use of Sodium Decanoate for Selective Preci-pitation of Metals Contained in Industrial Wastewater. Chemosphere, 69, 763-768.
https://doi.org/10.1016/j.chemosphere.2007.05.006
[16] Mohsen-Nia, M., Montazeri, P. and Modarress, H. (2007) Removal of Cu2+ and Ni2+ from Wastewater with a Chelating Agent and Reverse Osmosis Processes. Desalina-tion, 217, 276-281. https://doi.org/10.1016/j.desal.2006.01.043
[17] El Samrani, A.G., Lartiges, B.S. and Villiéras, F. (2008) Chemical Coagulation of Combined Sewer Overflow: Heavy Metal Removal and Treatment Optimization. Water Research, 42, 951-960. https://doi.org/10.1016/j.watres.2007.09.009
[18] Sud, D., Mahajan, G. and Kaur, M.P. (2008) Agricultural Waste Material as Poten-tial Adsorbent for Sequestering Heavy Metal Ions from Aqueous Solutions—A Re-view. Bioresource Technology, 99, 6017-6027.
https://doi.org/10.1016/j.biortech.2007.11.064
[19] Ahluwalia, S.S. and Goyal, D. (2005) Removal of Heavy Metals by Waste Tea Leaves from Aqueous Solution. Engineering in Life Sciences, 5, 158-162.
https://doi.org/10.1002/elsc.200420066
[20] Meena, A.K., Kadirvelu, K., Mishra, G.K., Rajagopal, C. and Nagar, P.N. (2008) Adsorptive Removal of Heavy Metals from Aqueous Solution by Treated Sawdust (Acacia arabica). Journal of Hazardous Materials, 150, 604-611.
https://doi.org/10.1016/j.jhazmat.2007.05.030
[21] Gupta, V.K. and Ali, I. (2006) Adsorbents for Water Treatment: Development of Low-Cost Alternatives to Carbon, Encyclopedia of Surface and Colloid Science. 2nd Edition, Taylor and Francis, New York, 149-184.
[22] Manohar, V.D.M., Noeline, B.F. and Anirudhan, T.S. (2006) Adsorption Perfor-mance of Alpillared Bentonite Clay for the Removal of Cobalt (II) from Aqueous Phase. Applied Clay Science, 31, 194-206. https://doi.org/10.1016/j.clay.2005.08.008 [23] Krishnan, K.A. and Anirudhan, T.S. (2008) Kinetic and Equilibrium Modelling of Cobalt (II) Adsorption onto Bagasse Pith Based Sulphurised Activated Carbon. Chemical Engineering Journal, 137, 257-264.
https://doi.org/10.1016/j.cej.2007.04.029
[24] McKay, G. (1996) Use of Adsorbents for the Removal of Pollutants from Wastewa-ters. CRC Press Inc., Tokyo.
[25] Girgis, B.S. and Ihsak, M.F. (1999) Activated Carbon from Cotton Stalks by Im-pregnation with Phosphoric Acid. Materials Letters, 39, 107-114.
https://doi.org/10.1016/S0167-577X(98)00225-0
[26] Demirbaş, Ö., Karadağ, A., Alkan, M. and Doğan, M. (2008) Removal of Copper Ions from Aqueous Solutions by Hazelnut Shell. Journal of Hazardous Materials, 153, 677-684. https://doi.org/10.1016/j.jhazmat.2007.09.012
[27] Demirbas, A. (2008) Heavy Metals Adsorption onto Agro-Based Waste Materials: A Review. Journal of Hazardous Materials, 157, 220-229.
https://doi.org/10.1016/j.jhazmat.2008.01.024
[28] Farahani, M. and Behbahaninia, A. (2014) Using Natural Adsorbents to Reduce Po-lycyclic Aromatic Hydrocarbons Contamination of Oily Wastewater. Journal of Biomedical and Environmental Sciences, 5, 274-281.
[30] Poots, V.J.P., McKay, G. and Healy, J.J. (1978) Removal of Basic Dye from Effluent Using Wood as an Adsorbent. Journal of Water Pollution Control Federation, 50, 926-935.
[31] Al-Asheh, S. and Duvnjak, Z. (1997) Sorption of c Admium and Other Heavy Met-als by Pine Bark. Journal of Hazardous Materials, 56, 35-51.
https://doi.org/10.1016/S0304-3894(97)00040-X
[32] Low, K.S., Lee, C.K. and Leo, A.C. (1995) Removal of Metals from Electroplating Wastes Using Banana Pith. Bioresource Technology, 51, 227-231.
https://doi.org/10.1016/0960-8524(94)00123-I
[33] Marshall, W.E. and Johns, M.M. (1996) Agricultural By-Products as Metal Adsor-bents: Sorption Properties and Resistance to Mechanical Abrasion. Journal of Chemical Technology & Biotechnology, 66, 192-198.
https://doi.org/10.1002/(SICI)1097-4660(199606)66:2%3C192::AID-JCTB489%3E3.
0.CO;2-C
[34] Wafwoyo, W., Seo, C.W. and Marshall, W.E. (1999) Utilization of Peanut Shells as Adsorbents for Selected Metals. Journal of Chemical Technology & Biotechnology, 74, 1117-1121.
https://doi.org/10.1002/(SICI)1097-4660(199911)74:11%3C1117::AID-JCTB151%3E
3.0.CO;2-R
[35] Cimino, G., Passerini, A. and Toscano, G. (2000) Removal of Toxic Cations and Cr(VI) from Aqueous Solution by Hazelnut Shell. Water Research, 34, 2955-2962.
https://doi.org/10.1016/S0043-1354(00)00048-8
[36] Mishra, S.P., Tiwari, D. and Dubey, R.S. (1997) The Uptake Behavior of Rice (Jaya) Husk in the Removal of Zn(II) Ions: A Radiotracer Study. Applied Radiation and Isotopes, 48, 877-882. https://doi.org/10.1016/S0969-8043(97)00340-0
[37] Yu, B., Zhang, Y., Shukla, A., Shukla, S.S. and Dorris, K.L. (2001) The Removal of Heavy Metals from Aqueous Solutions by Sawdust Adsorption: Removal of Lead and Comparison of Its Adsorption with Copper. Journal of Hazardous Materials, 84, 83-94. https://doi.org/10.1016/S0304-3894(01)00198-4
[38] Balkose, D. and Baltacioglu, H. (1992) Adsorption of Heavy Metal Cations from Aqueous Solutions by Wool Fibers. Journal of Chemical Technology & Biotechnol-ogy, 54, 393-397. https://doi.org/10.1002/jctb.280540414
[39] Azab, M.S. and Peterson, P.J. (1989) The Removal of Cadmium from Water by the Use of Biological Sorbents. Water Science and Technology, 21, 1705-1706. [40] Zaggout, F.R. (2001) Removal of Copper from Water by Decaying Tamrix Gallica
Leaves. Asian Journal of Chemistry, 13, 639-650.
[41] Luckey, T.D. and Venugopal, B. (1977) Metal Toxicity in Mammals. Plenum Press, New York.
[42] Chang, S.H., Teng, T.T. and Ismail, N. (2010) Extraction of Cu (II) from Aqueous Solutions by Vegetable Oil-Based Organic Solvents. Journal of Hazardous Materials, 181, 868-872. https://doi.org/10.1016/j.jhazmat.2010.05.093
[43] Guijuan, J.I., Weiwei, B.A.O., Guimei, G.A.O., Baichao, A.N. and Shucai, G.A.N. (2012) Removal of Cu (II) from Aqueous Solution Using a Novel Crosslinked Alu-mina-Chitosan Hybrid Adsorbent. Chinese Journal of Chemical Engineering, 20, 641-648. https://doi.org/10.1016/S1004-9541(11)60229-2
[44] Manahan, S.E. (1991) Environmental Chemistry. 5th Edition, Lewis Publishers, Chelsea.