Shape Complexity and Process Energy
Consumption in Electron Beam Melting
A Case of Something for Nothing in Additive Manufacturing?
Martin Baumers, Chris Tuck, Ricky Wildman, Ian Ashcroft, and Richard Hague
Summary
Additive manufacturing (AM) technology is capable of building up component geometry in a layer-by-layer process, entirely without tools, molds, or dies. One advantage of the approach is that it is capable of efficiently creating complex product geometry. Using experimental data collected during the manufacture of a titanium test part on a variant of AM technology, electron beam melting (EBM), this research studies the effect of a variation in product shape complexity on process energy consumption. This is done by applying a computationally quantifiable convexity-based characteristic associated with shape complexity to the test part and correlating this quantity with per-layer process energy consumption on the EBM system. Only a weak correlation is found between the complexity metric and energy consumption (ρ=.35), suggesting that process energy consumption is indeed not driven by shape complexity. This result is discussed in the context of the energy consumption of computer-controlled machining technology, which forms an important substitute to EBM. This article further discusses the impact of available additional shape complexity at the manufacturing process level on the incentives toward minimization of energy inputs, additional benefits arising later within the product’s life cycle, and its implications for value creation possibilities.
Keywords:
3D Printing
additive manufacturing (AM) electron beam melting (EBM) energy consumption industrial ecology shape complexity
Supporting information is available on theJIEWeb site
Introduction
Researchers argue that action is needed to limit anthro-pogenic climate change; it is claimed that humanity’s ecological footprint already far exceeds earth’s capacity (Westk¨amper et al. 2000; Jovane et al. 2008). Moreover, an understanding of the emissions associated with manufacturing processes is essential regarding decision making toward sustainability. In particular, the measurement of carbon emissions, known as “carbon ac-counting,” requires a fundamental understanding of the energy flows associated with production processes (Vijayaraghavan and Dornfeld 2010).
Marked by ongoing technological development, additive manufacturing (AM) is a relatively recent manufacturing
ap-Address correspondence to: Martin Baumers, 3D Printing Research Group, Faculty of Engineering, University of Nottingham, Nottingham NG7 2RD, United Kingdom.
Email: [email protected];Web: www.nottingham.ac.uk/3dprg
© 2016 by Yale University
DOI: 10.1111/jiec.12397 Editor managing review: Michael Hauschild
Volume 00, Number 0
proach, with various technology variants being introduced dur-ing the 1980s and 1990s (Kruth et al. 1998; Levy et al. 2003). The ASTM (2012, 2) defines AM processes as being capable of “joining materials to make objects from 3D model data, usu-ally layer upon layer, as opposed to subtractive manufacturing methodologies.” This article assesses the energy consumption characteristics of one particular AM technology variant, elec-tron beam melting (EBM).
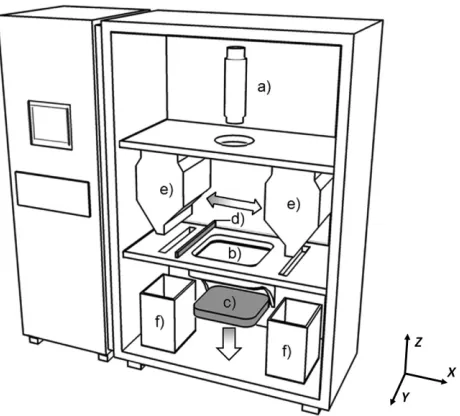
Figure 1 Main components of an EBM system: (a) beam column, (b) powder bed, (c) build platform, (d) powder rake, (e) powder hoppers, and (f) overflow bins. EBM=electron beam melting.
Table 1 Arcam A1 system characteristics, as employed for this research
System type Arcam A1
Beam type Electron beam
Maximum beam energy 3,000 W
Nominal build volume size (X/Y/Z) 200/200/180 mm Measured usable platform area (X/Y) 180/180 mm
Investigated build material Titanium, Ti-6Al-4V, grade 5 (ASTM 2013)
Layer thickness 70μm
Process atmosphere Vacuum, with addition
of He
Powder bed temperature 700ºC
Power supply 400 V, 16A, multiphase
Chiller on external power No
Manufacturer reference Arcam AB (2014)
Note: W=watts; mm=millimeters;μm=micrometers; V=volts.
powder bed (b) layer by layer. After completing each layer with a fixed layer height of 70 micrometers (μm), the build platform (c) moves down by an increment in the vertical (“Z”) direction and a “powder rake” (d) deposits a fresh layer of metal powder in the horizontal (“X”) direction, dispensed from stationary pow-der hoppers (e). The rake also discards any excess powpow-der into overflow bins (f) for reuse. This cycle repeats until the build is complete. After completion of all layers, the build platform (c) holding the products is removed. Table 1 summarizes important characteristics of the investigated A1 EBM machine.
For details on EBM’s operating principle, see Hopkinson and Dickens (2006), Heinl and colleagues (2007), or Murr and colleagues (2009). EBM platforms have been judged to be par-ticularly energy efficient variants of AM (Taminger and Hafley 2002; Heinl et al. 2007; Frigola et al. 2008). Strutt (1980)
points out that energy transfer by the electron beam principle is around 10 times more efficient than by laser beam, which is the approach employed by most other metallic AM technology variants. An investigation of the microstructural and mechani-cal properties achievable by EBM, including the thermal effects of the process, is provided by Al-Bermani and colleagues (2010). It is suggested that AM technology has two generic advan-tages over other manufacturing processes (Tuck et al. 2008). First, AM allows the manufacture of designs without many of the geometric constraints limiting the complexity of shapes that are associated with other processes and treated in the literature on design for manufacturability (Boothroyd et al. 1994; Bralla 1998). Second, AM enables the manufacture of customized products in small volumes at a relatively low average cost. The current state of AM technology, however, also carries a set of generic process limitations (Ruffo and Hague, 2007), acting as a barrier to the adoption of AM process in several applications:
r
limited material selection and characteristics,r
low process productivity,r
low dimensional accuracy,r
rough surface finish,r
repeatability and quality issues, andr
relatively high unit cost at medium and large volumes. In the context of monetary production cost, it has been suggested that AM allows the manufacture of more complex product geometry at no additional cost (Hague et al. 2003). Taking a step beyond financial cost, this article is interested in whether extra shape complexity is also available at no additional process energy consumption, which may result in additional use-phase performance advantages for applications that benefit from complex design.Shape complexity factors are used to determine efficient manufacturing process configurations, for example, in forging or machining processes. A basic measure used in this context is the Spies ratioS(Spies 1957), which is calculated by dividing a part’s massmpartover the mass of a correctly aligned bounding primitive mprimitve, typically a cylinder or a cuboid, made of the same material. Building on this concept, Tomov and Radev (2007) report a selection of shape complexity factors designed to enable the specification of an efficient sequence of forging steps by estimating the work needed for material deformation during the forging process. Similarly, Kerbrat and colleagues (2010) develop a set of manufacturing complexity indices applicable to computer numerically controlled (CNC) machining and AM in order to inform process selection and design modularization approaches for improved manufacturability and lower cost.
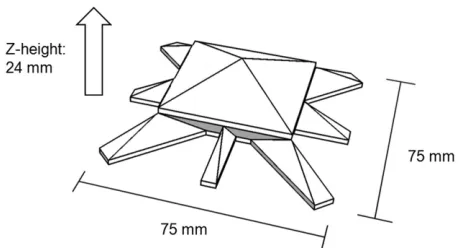
[image:2.594.40.280.344.520.2]Figure 2 Spider-shaped test part geometry. Image source: Baumers (2012).
views shape complexity as a characteristic derived from the geometry manufactured, implicitly accommodating aspects of the processes, rather than deriving from the processes used to generate them. Reporting the results of previous doctoral re-search (Baumers 2012), this rere-search thus correlates process en-ergy consumption to characteristics associated with geometric complexity.
The following part of this paper,Methods and Implementation, outlines the methodology employed in the construction of an algorithm designed to capture shape complexity and presents the experimental setup used to collect power consumption data.
Resultspresents the measured variation in the investigated test part and per-layer energy consumption results. TheDiscussion
section examines these results in the context of CNC machin-ing, which forms an important substitute manufacturing tech-nology, and seeks to extract further meaning by relating the re-sults to a selection of concepts from the literature on industrial energy consumption reduction and on benefits arising from the availability of additional complexity within high-technology industries. The final section,Conclusion, provides a summary and makes recommendations for further research.
Methods and Implementation
To facilitate this investigation, it was decided to base power monitoring experiments on a test part geometry, as done by Mognol and colleagues (2006). The layer-by-layer operating principle of EBM allows the design of a power monitoring geom-etry tailored for the analysis of the impact of geometric variables on energy consumption by varying the part’s cross-section along the vertical (“Z”) direction. The resulting test part, shown in figure 2, exhibits a suitable variation in two parameters, shape complexity and cross-sectional area, as will be explored in the following sections.
The part’s lower half is designed to assess the effect of shape complexity on energy inputs. This is done by changing a com-plex, star-shaped cross-section with a square cutout in the center into a square cross-section (at 12 millimeters [mm] Z-height). In the upper half of the geometry, the effect of cross-sectional area, reflective of overall part size, is explored. This is achieved
by simply reducing cross-section area A down to a value of zero, forming a single vertex in a pyramid-like upper tip. A further point of consideration in the design of the “spider” shape shown in figure 2 was that some areas of the geometry feature negative wall angles. To avoid the use of support structures in the build experiments on the EBM system, the part was designed to not exceed negative wall angles of 45º.
Implementing a Complexity Measurement Algorithm
Complexity forms an inherently multifaceted concept (Edmonds 1999) that may relate to, among other things, the logical depth or the difficulty of identifying original patterns (Gell-Mann 1995), or the number of nodes and connections in a network structure (Gilder 1989). Regarding the measurement of the complexity of real-world objects such as manufactured products, it has been argued that a narrow view on the quan-tities relating to such complexity may be unavoidable, making such metrics depend on the context (Gell-Mann 1995).
An algorithmic approach suitable for this article was devel-oped by Psarra and Grajewski (2001), associating the measure-ment of two-dimensional (2D) shape complexity with various convexity-based classes of regularity. This technique was de-signed with the original intent of computationally assessing floor plans in architecture.
In an adapted form, and combined with an implementation inspired by radar systems, this article develops the technique to be able to quantify shape features associated with complexity in the test part shown in figure 2 (and indeed any other part). This approach is particularly useful because it is able to capture aspects associated with both the topological and geometrical aspects of shape complexity. Transferring the technique to the analysis of three-dimensional (3D) solid object geometry, the special layer-by-layer operating principle of AM allows the un-derlying 2D method to be maintained. This is possible because current additive equipment, such as the analyzed EBM plat-form, operates in a strictly sequential manner completing each horizontal layer before depositing the next layer onto the ex-isting geometry. Thus, AM permits a separate analysis of every 2D cross-section.
By subjecting the cross-section of a test part to a controlled variation along the test part’s Z-axis, this research extends the original algorithmic approach by Psarra and Grajewski (2001). Effectively, a continuous 3D solid is split into a sequence of 2D layers, so that the level of shape complexity can be varied within one build. The effect of the variation of shape complexity on process energy consumption of AM can then be studied.
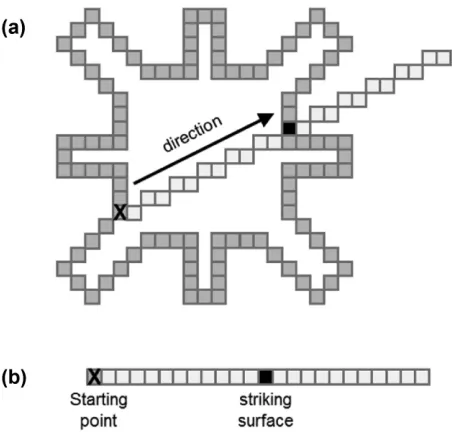
Figure 3 Implementation of occlusion measurement: (a) top view on a discretized layer (voxel resolution and scale not accurate) and (b) illustration of a one-dimensional array for the determination of visible voxels. Image source: Baumers (2012).
Once the specifically designed power monitoring geometry is discretized, the next step is to develop an algorithm that is de-signed to assess each discrete voxel element of the part’s surface for complexity in a succession of horizontal cross-sections (anal-ogous to build layers). Expressed intuitively, the proportion of other surface elements that are directly visible from specific loci in a layer can thus be identified. The outcome of this calculation is a mean connectivity value (MCV) characterizing the shape complexity of each horizontal slice of the test part. Mimicking the layer-by-layer principle of AM, the resulting algorithm as-sesses each layer separately, resulting in a series ofMCVvalues for each horizontal layer of the discretized test geometry.
The actual algorithm underlying the measurement of such “visibility” is inspired by radar systems used to measure the distance of surrounding objects relative to a location. Radar systems operate by emitting signals in predetermined directions, often using antennae rotating around a Z-axis. A Cartesian coordinate system is used in the implementation, which may deviate from the original inspiration of radar. The principle of the measurement algorithm is very similar, however. Starting with the first element of the perimeter of the initial layer under consideration, a “radar signal” is emitted. Once the signal has been sent, it travels through the discretized voxel space in the predetermined direction. Where it strikes another element of the surface, the location is recorded. If it does not strike the perimeter at any location, for example, if it is emitted toward the outside of the shape, no impact location is registered.
This radar-inspired implementation works as follows: As il-lustrated in figure 3a, the algorithm reads discretized informa-tion on part geometry in a particular direcinforma-tion, recording the content of the voxel cells approximating the part in a
one-dimensional (1D) array (figure 3b). In this sequence, beginning from the starting point, each entry is interrogated for a surface hit. The location of the first cell struck in this sequence is then recorded in a further array.
The direction, or gradient, of the “radar beam” is then changed by one increment in counterclockwise direction and new information is read into the 1D array (figure 3b). This is repeated in a loop, until the full 360ºcircle is complete around the starting point and all visible cells have been recorded. In the following step, the algorithm compares the location of the recorded visible elements to what should be visible without occlusion.
If every existing surface element is visible, the shape is deemed fully convex, as proposed by Psarra and Grajew-ski (2001). For intermediate results, a value of connectivity
CV]0, 1] will be the result. This procedure is repeated for all “n” elements of the perimeter in layer “i”, enabling the cal-culation of the mean connectivity valueMCVi for each layer, where (equation 1):
MCVi = n
m=1CVm
n (1)
MCVis calculated for all layers in the discretized approxima-tion of the test part. Effectively,MCVireflects shape complexity present in the “i”th horizontal cross-section of the part and thus forms a measure of 2D shape complexity. The measurement al-gorithm is available in the form of pseudocode in the Supporting Information available on the Journal’s website.
Power Monitoring Experiments
To assess the effect of a variation in part geometry on the energy consumed to deposit a layer, a build experiment has been performed on the Arcam A1 EBM system. Acknowledging that AM systems of this type only operate efficiently if the available build capacity is utilized (Baumers et al. 2011), a batch of five power monitoring test parts was produced in a full build experiment. As required by the methodology, all test parts were built in the same orientation directly onto the removable build plate, without any connecting or support structures.
The electricity consumption during the build experiments was recorded using a Yokogawa CW240 digital multipurpose power meter (Yokogawa Electric Corp. 2004), the main variable of interest being mean real power consumption across the three phases and the neutral line. To assemble the required data set, it is necessary to synchronize the collected energy consumption data with the log files created by the A1’s operating system, providing information on machine state and build progress. This information is extracted from the build log files in the *.plg file format using Arcam’s LogStudio tool (v.3.1.51).
Results
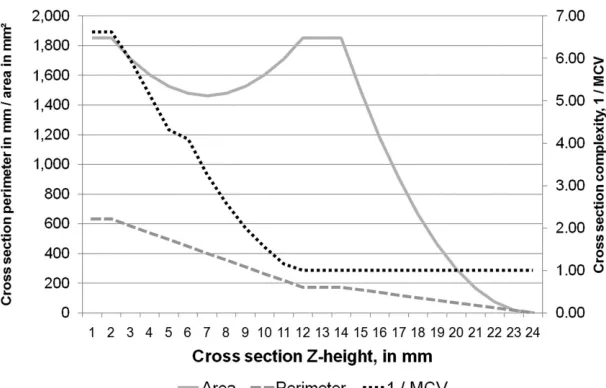
Figure 4 Variation of parameters of geometry. Image source: Baumers (2012).
Because the implementation of the measurement algorithm is based on a resolution of (1 mm)³voxels, the corresponding vari-ation of test part parameters is measured in 1-mm intervals of Z-height. Figure 4 shows the variation of three parameters along the test part’s Z-axis: the total area of the part’s cross-section; the cross-sectional perimeter length; and the parameter of shape complexity. For exposition,MCVis shown in inverted form, such that a high value ofMCV−1indicates high cross-sectional shape complexity.
As figure 4 demonstrates, the area of the cross-sections dips between 2 and 12 mm of Z-height, from an initial value of 1,850 square millimeters (mm²) to around 1,450 mm². This fluctuation occurs alongside the controlled variation ofMCV. The fact that both parameters are varied in parallel complicates the analysis of the pure effect of a variation ofMCV. However, it does allow the design of a relatively simple polygonal test part without curved surfaces, as shown in figure 2. The irregularity in theMCV−1 curve at a Z-height of 6 mm results from the use of a discretized voxel representation of part geometry. It is thus an artefact of the discretization technique and should be ignored.
It has been argued that for any measure of complexity to be useful, at least one of the surveyed features must exhibit high complexity (Gell-Mann 1995). Figure 4 demonstrates that the design of a test part jointly varying parameters of complexity and cross-sectional area is successful by this standard. The effect of these variations of area and complexity along the Z-axis can now be explored in terms of the per-layer process energy consumption data.
Power Monitoring Results
Build operations on an EBM platform consist of four phases: system startup; preheating; build phase; and machine cool-down. The energy consumption results are reported in table 2, listing process time, mean real power consumption, and
cumula-tive energy consumption during the various phases of the build. This results in a specific energy consumption of 59.96 mega-joules (MJ) per kilogram (kg) deposited, which corresponds to the energy consumption results reported for other AM technol-ogy variants (Mognol et al. 2006; Kellens et al. 2010; Le Bourhis et al. 2013). It should be noted that the power consumed by the platform’s internal chiller is included in the measurement.
By combining the energy consumption data with the infor-mation retrieved from the machine’s log file, it is possible to divide the energy invested during the core build time into three machine activities: (1) layer preparation; (2) layer preheating; and (3) melting.
Figure 5 shows that the energy expended during layer prepa-ration (data loading and fresh powder deposition by the powder deposition mechanism shown in figure 1d) fluctuates around a constant mean throughout the build (approximately 10 kilo-joules per layer). In contrast, the energy expended during the preheating state exhibits a linear, slightly negative, trend— most likely owing to a gradual warming up of the machine frame during the build process, decreasing the requirement for energy expenditure for layer preheating over time. More in-terestingly, the energy expended for the selective melting of the cross-sections fluctuates strongly. The initial spike in en-ergy consumption (during the first layer) is explained by re-peat melting to ensure full attachment of parts to the build platform.
Correlation between Complexity and Energy
Visual inspection of figure 5 suggests that the observed pat-tern of energy expenditure for melting (dashed line) can be ex-plained by cross-sectional area. The Pearson product-moment correlation coefficientρX,Y,where (equation 2):
ρX,Y =
cov(X,Y)
σXσY ,
Table 2 EBM power monitoring results
Category Characteristic Value
Warm-up time: machine startup 10 min
Warm-up time: preheating 14 min
Process time Build time 260 min
Cool-down time 17 min
Total build time 301 min
Mean real power consumed: machine startup 1.09 kW
Mean real power consumed: preheating 3.90 kW
Power consumption
Mean real power consumed: build 2.22 kW
Mean real power consumed: cool-down 0.60 kW
Mean real power consumed, overall 2.17 kW
Energy consumption: machine startup 0.62 MJ
Energy consumption: preheating 3.27 MJ
Absolute energy consumption
Energy consumption: build time 34.66 MJ
Energy consumption: cool-down 0.61 MJ
Total energy consumption 39.16 MJ
Energy consumed per part (5 in total) 7.83 MJ
Specific energy consumption
Energy consumed per cm³deposited 0.27 MJ Specific energy consumption per kg depositeda 59.96 MJ
aAssuming 100% part density, at 4.43 g/cm3.
EBM=electron beam melting; cm3=cubic centimeters; kg=kilogram; min=minutes; kW=kilowatts; MJ=megajoules; g/cm3=grams per cubic
centimeter.
Figure 5 EBM energy invested per layer, by activity. Image source: Baumers (2012). EBM=electron beam melting.
andσXσYis the product of the standard deviations of variables
X and Y, can be used to express the degree of linear depen-dence between two variables. A sample correlation coefficient
ρArea,Layer Energy=0.9699 between selective melting energy and cross-sectional area (in 1-mm intervals of Z-height) suggests that total melting energy consumption is indeed determined by cross-sectional area and thus by overall part mass.
Further applying correlation coefficients, the effects of various aspects of geometry on the energy expended for layer melting can be studied. Focusing on the portion of the build
containing variation of shape complexity (1 to 12 mm Z-height, as shown in figure 2), correlation coefficients between layer energy and cross-sectional perimeter length, complexity, and melting area can be compared (equations 3, 4, and 5):
ρPerimeter,Layer Energy= 0.6568 (3)
ρArea,Layer Energy= 0.8263 (4)
[image:6.594.132.438.372.571.2]The coefficients demonstrate that melting energy consump-tion correlates strongly with cross-secconsump-tion area (0.8263) and, to a lesser extent, with perimeter length (0.6568). The corre-lation coefficient between layer energy consumption and the used measure of shape complexity (–0.3544) is small. This can be viewed as evidence of a weak or potentially absent associ-ation between EBM energy consumption and cross-sectional shape complexity. It should be noted that the negative corre-lation coefficient originates from the formucorre-lation ofMCVi (a high value indicates a small degree of shape complexity and vice versa).
This article acknowledges that the test part geometry, shown in figure 2, was selected to avoid the requirement to deposit sup-port structures. This is, of course, a simplification that routinely does not hold in reality and must flow into the consideration of the calculated correlation coefficients. On the other hand, there is an incentive to minimize the use of such structures and their volume to reduce part finishing and cost (Cloots et al. 2013).
Discussion
The experimental results presented in this article suggest that EBM does not exhibit a strong direct linkage between energy consumption and shape complexity, at least on a per-layer basis. Therefore, this article argues that there is no clear connection between the feature richness of a component and the energy needed to deposit it by EBM. Rather, it appears that process energy consumption is driven by cross-sectional area and hence by overall part mass.
It should be remarked at this point that the used test ge-ometry, featuring a controlled variation along the Z-axis, may resemble a relatively noncomplex component, especially when compared to some applications of EBM incorporating internal or external lattice structures (see, e.g., Murr et al. 2012). Thus, a higher degree of realism could be achieved by incorporating such structures into the analysis. Further, the test specimen does not necessitate expendable support structures, which are rou-tinely required in the EBM process. A support-free design was specified to allow an investigation of the effects of 2D cross-sectional shape complexity; this approach would not have been possible in the presence of auxiliary structures.
Moreover, this analysis forms an investigation of energy con-sumption at the process level. It thus does not investigate the environmental impact occurring during other stages in the prod-uct life cycle. Especially for the manufacturing of titanium ma-terials, the associated environmental impacts have been doc-umented as significant (Granta Design 2010). The production of virgin Ti-6Al-4V cast material is estimated to consume from 582 to 643 MJ/kg. Because titanium is seldom manufactured purely from precursor materials, it is also necessary to consider the energy embodied in recycled material, between 221 and 244 MJ/kg, and a recycling rate of between 20.9% and 23.1%. Using the mean values of these data points (all provided by Granta Design [2010]), this research assumes a total embedded
energy of 528.90 MJ/kg for Ti-6Al-4V plate material. To con-vert this material into the required powderous form (spherical particles with 15 to 45μm diameter), a gas atomization route can be employed. The energy consumed for this additional pro-cess has been estimated from 30.1 to 33.3 MJ/kg propro-cessed (Granta Design 2010). Again using the mean of these two data points, the total energy requirement to create Ti-6Al-4V pow-der can be approximated at 560.60 MJ/kg, representing an addi-tional energy investment of only 6% compared to plate material. Additionally, this research notes that EBM platforms also consume helium to maintain a controlled vacuum and for pro-cess cool-down. The equipment manufacturer cites a helium consumption rate of 1 liters per hour (L/h) and a cool-down helium consumption of 50 to 75 L per build for the successor system to the investigated A1 platform (Arcam 2014). In terms of volume, this flow is far lower than the nitrogen consumption (3,500 L/h) observed by Kellens and colleagues (2010) for a laser-based powder bed fusion platform.
By concentrating on the core process level, this research ig-nores aspects of postprocessing. Such postprocessing for EBM products can be performed by light finish machining (Cormier et al. 2004) or shot blasting (Mazzioli et al. 2009). This research acknowledges that the additional energy consumption required to postprocess products may be related to the shape complexity exhibited by designs, dependent on the used technique. Further, Baumers and colleagues (2013) report the requirement for a wire erosion process to separate parts from the build platform for a laser-based powder bed fusion system, estimating a fixed energy consumption of 142.46 MJ. The investigated EBM platform does not require a separation process because the manufactured parts were hand-separable from the platform owing to differ-ences in thermal expansion of the build material (Ti-6Al-4V) and the steel build platform.
As a first point of discussion, the results presented by this article can be contrasted with empirical data from machining processes. In the production of small, geometrically complex or customized parts, EBM has been adopted in place of CNC ma-chining processes (Harryson et al. 2005; Morrow et al. 2007). Morrow and colleagues (2007) show how consecutive CNC operations increase the energy invested into a part. As can be seen from figure 6, the energy consumed by the various steps is highly nonuniform. This may be because of discrepancies in rough versus finish milling (Morrow et al. 2007) or to varia-tions in the specific energy consumption per unit of material removed (Avram and Xirouchakis 2011). The end result is the same: Overall CNC energy consumption is the outcome of a sequence of manufacturing steps removing raw material and thereby manipulating raw material in billet or bar form into a more complex final product.
Figure 6 Cumulative energy consumption in MJ, by CNC operation. Image source: adapted from Morrow and colleagues (2007). MJ= megajoules; CNC=computer numerically controlled.
Unlike machining processes, the results presented in this article show that a minimization of deposited volume can be expected to lead to a minimization of process energy consump-tion in EBM. An important linking argument is the assumpconsump-tion that process energy consumption and production cost correlate positively, which has been observed for the AM process vari-ant, direct metal laser sintering (Baumers et al. 2013), which is closely related to EBM. This implies that cost minimization by the technology operator should coincide with the minimization of process energy consumption.
The described relationship produces a situation of correctly aligned incentives: The private incentive of cost minimization will motivate the deposition of the smallest possible amount of material, which, in turn, will result in the smallest amount of process energy consumption. Such an alignment of the private cost minimization incentive with configurations min-imizing energy consumption, and hence a significant exter-nal environmental footprint, has been classed as an impor-tant prerequisite for the reduction of energy inputs (Lovins 1996).
Further, where the deposited volume can be reduced while maintaining part performance through an increase in shape complexity, a range of possible financial and environmental savings may follow during the use phase, especially in weight-sensitive applications (Helms and Lambrecht 2007). Thus, this article argues that cost minimization is likely to inadvertently lead to virtuous knock-on effects: By minimizing energy con-sumption during the manufacturing stage of applications in which component mass plays a role for product performance, end-use efficiency may also be improved. This results in lower operating costs (see, e.g., Kaufmann 2008) and lower environ-mental impacts associated with, for example, reduced fractional fuel consumption (Economon et al. 2011). Further savings may be enabled through secondary mass reductions that become
possible through the lightweighting of structural or other com-ponents (Saidpour 2004).
Moreover, the results presented in this article suggest that geometry and functional features can be added at low or even negligible additional process energy consumption if they do not coincide with increases in deposition volume. This point is closely related to phenomena normally associated with tech-nological progress in the manufacturing of microelectronics. In this sector, the near costless availability of additional func-tional features, mainly logical elements created by planar pho-tolithographic processes, has had a tremendous effect on the performance of electronics over the past decades (Gilder 1989; Schaller 1997; Brynjolfsson and McAfee 2014). This reality of creating extra functional value and utility out of an increased ability to harness complexity in manufacturing processes has been labeled “ex nihilo” value creation (Graeber 2012). The same argument has been extended to the manufacture of com-puter networking technology (Gilder 2000).
Effectively, the observations made in this article demon-strate that, on the manufacturing process level, there is not necessarily a connection between the utility of the stream of services available from a durable good (for a discussion of the stream of services, see, e.g., Waldman [2003]) and the energy expended to create it. The presented results should therefore be treated as an indication that “value ex nihilo” phenomena may also be approximated within manufacturing processes for parts performing a structural or mechanical function, promising significant environmental benefits.
Conclusion
cross-sectional melting area must be viewed as the determinant of energy consumption per layer. This result lends support to the position that process energy consumption is only weakly re-lated, if at all, to the design features and the functional richness of the product. In its discussion of these results, this article has identified three consequences:
1. It is expected that the connection between the minimiza-tion of volume and the minimizaminimiza-tion of process energy consumption will incentivize technology adopters to se-lect minimum energy consumption configurations while choosing a minimum cost configuration.
2. The minimization of deposited volume in conjunction with the exploitation of cheap complexity is expected to lead to improved use-phase performance in weight-sensitive applications. It must be expected that this aspect enables environmental benefits during products’ service lives compared to processes exhibiting a clear connection between shape complexity and cost.
3. The result that additional geometry and functional features can be added incurring low additional process energy consumption is likely to allow the creation of significant additional value without large increases of the environmental burden of manufacturing. There are thus grounds to speculate that the use-phase benefits arising from such design changes outweigh their manufacturing process impact.
As the second point emphasizes, the external impact of an ability to efficiently build complex components clearly extends beyond the manufacturing stage of the part’s life cycle. De-spite efforts to include environmental and social considerations in engineering decisions (Maxwell and van der Vorst 2003), private costs and benefits (accruing to individuals and organi-zations, as opposed to society) are normally viewed as the deter-minants of technology adoption decisions (Stoneman 2002). It will therefore be necessary to assess the life cycle of AM products in detail. This will allow research to bridge the gap from man-ufacturing considerations in isolation to informed statements on the use-phase impact of durable goods, and hence build the case for the environmental savings that may arise overall from the adoption of digital manufacturing technologies such as AM.
Because this research has investigated the manufacture of titanium parts on the technology variant EBM, a further re-search requirement is to assess how the results presented in this article can be extended and generalized. This is achievable by applying a developed version of this article’s experimental setup to a multipart and -platform approach, utilizing a 3D version of the proposed complexity metric to assess different manufacturing pathways. These should include alternative AM processes, such as selective laser melting, as well as conven-tional substitute techniques, including assembly, bonding, and casting.
References
Al-Bermani, S. S., M. L. Blackmore, W. Zhang, and I. Todd. 2010. The origin of microstructural diversity, texture, and mechanical properties in electron beam melted Ti-6Al-4V.Metallurgical and Materials Transactions A41(A): 3422–3434.
ASTM. 2012.ASTM F2792-12e1 standard terminology for additive man-ufacturing technologies. West Conshohocken, PA, USA: ASTM. ASTM. 2013.ASTM B988-13, standard specification for powder
metal-lurgy (PM) titanium and titanium alloy structural components. West Conshohocken, PA, USA: ASTM.
Arcam, A. B. 2014. Corporate website. www.arcam.com. Accessed 22 December 2014.
Avram, O. I. and P. Xirouchakis. 2011. Evaluating the use phase en-ergy requirements of a machine tool system.Journal of Cleaner Production19(6–7): 699–711.
Baumers, M. 2012. Economic aspects of additive manufacturing: Ben-efits, costs and energy consumption. Ph.D. thesis, Loughborough University, Loughborough, United Kingdom.
Baumers, M., C. Tuck, R. Wildman, I. Ashcroft, and R. Hague. 2011. Energy inputs to additive manufacturing: Does capacity utilization matter? In Solid Freeform Fabrication (SFF) Symposium, 6–8 August, Austin, TX, USA.
Baumers, M., C. Tuck, R. Wildman, I. Ashcroft, E. Rosamond, and R. Hague. 2013. Transparency built-in.Journal of Industrial Ecology 17(3): 418–431.
Boothroyd, G., P. Dewhurst, and W. Knight. 1994.Product design for manufacture and assembly. New York: Marcel Dekker.
Bralla, J. 1998. General design principles for manufacturability. In Design for manufacturability handbook, edited by J. Bralla. New York: McGraw-Hill.
Brynjolfsson, E. and A. McAfee. 2014.The second machine age. New York: W. W. Norton & Company.
Cloots, M., A. B. Spierings, and K. Wegener. 2013. Assessing new sup-port minimizing strategies for the additive manufacturing tech-nology SLM. In Solid Freeform Fabrication (SFF) Symposium, 12–14 August, Austin, TX, USA.
Cormier, D., O. Harryson, and H. West. 2004. Characterization of H13 steel produced via electron beam melting.Rapid Prototyping Journal10(1): 35–41.
Economon, T. D., S. R. Copeland, J. J. Alonso, M. Zeinali, and D. Rutherford. 2011. Design and optimization of future aircraft for assessing the fuel burn trends of commercial aviation. In 49th AIAA Aerospace Sciences Meeting, 4–7 January, Orlando, FL, USA.
Edmonds, B. 1999. What is complexity?—The philosophy of complex-ity per se with application to some examples in evolution. In The evolution of complexity, edited by F. Heylighen and D. Aerts. Dordrecht, the Netherlands: Kluwer.
Frigola, P., R. Agustsson, S. Boucher, A. Murokh, J. Rosenzweig, G. Travish, L. Faillace, D. Cormier, and T. A. Mahale. 2008. Novel fabrication technique for the production of RF photoinjectors. In Proceedings of EPAC08, 13–27 June, Genoa, Italy.
Gell-Mann, M. 1995. What is complexity?Complexity1(1): 16–19. Gilder, G. F. 1989.Microcosm: The quantum revolution in economics and
technology. New York: Simon and Schuster.
Gilder, G. F. 2000.Telecosm: The world after bandwidth abundance. New York: Simon and Schuster.
Granta Design Ltd. 2010. CES EduPack version 6.2.0, 2010. www.grantadesign.com/products/ces/. Accessed 20 February 2011.
Hague, R., I. Campbell, and P. Dickens. 2003. Implications on design of rapid manufacturing.Proceedings of IMechE Part C: Journal of Mechanical Engineering Science217: 25–30.
Harrysson, O., B. Deaton, J. Bardin, H. West, O. Cansizoglu, D. Cormier, and D. Marcellin-Little. 2005. Evaluation of titanium Implant components directly fabricated through electron beam melting technology. InMedical device materials III—Proceedings of the materials & processes for medical devices conference. Novelty, OH, USA: ASM International.
Heinl, P., A. Rottmair, C. K¨orner, and R. F. Singer. 2007. Cellular ti-tanium by selective electron beam melting.Advanced Engineering Materials9(5): 360–364.
Helms, H. and U. Lambrecht. 2007. The potential contribution of light-weighting to reduce transport energy consumption.The In-ternational Journal of Life Cycle Assessment(special issue) 12(1): 1–7.
Hopkinson, N. and P. M. Dickens. 2006. Emerging rapid manufacturing processes. InRapid manufacturing—An industrial revolution for the digital age, edited by N. Hopkinson, R. J. M. Hague, and P. M. Dickens. Chichester, UK: Wiley.
Jovane, F., H. Yoshikawa, L. Alting, C. R. Bo¨er, E. Westk¨amper, D. Williams, M. Tseng, G. Seliger, and A. M. Paci. 2008. The ining global technological and industrial revolution towards com-petitive sustainable manufacturing.CIRP Annals—Manufacturing Technology57(2): 641–659.
Kaufmann, M. 2008. Cost/weight optimization of aircraft struc-tures. Licentiate thesis, KTH Engineering Sciences, Stockholm, Sweden.
Kellens, K., E. Yasa, W. Dewulf, and J. R. Duflou. 2010. Environmental assessment of selective laser melting and selective laser sinter-ing. Paper presented at Going Green—CARE INNOVATION 2010: From Legal Compliance to Energy-efficient Products and Services, 8–11 November, Vienna.
Kerbrat, O., P. Mognol, and J.-Y. Hascoet. 2010. Manufacturing com-plexity evaluation at the design stage for both machining and layered manufacturing.CIRP Journal of Manufacturing Science and Technology2(3): 208–215.
Kruth, J.-P., M. Leu, and T. Nakagawa. 1998. Progress in additive manufacturing and rapid prototyping.Annals of the ClRP47(2): 525–540.
Le Bourhis, F., O. Kerbrat, J.-Y. Hascoet, and P. Mognol. 2013. Sustain-able manufacturing: Evaluation and modeling of environmental impacts in additive manufacturing.The International Journal of Advanced Manufacturing Technology69(9): 1927–1939.
Levy, G. N., R. Schindel, and J. P. Kruth. 2003. Rapid manufac-turing and rapid tooling with layer manufacmanufac-turing (LM) tech-nologies, state of the art and future perspectives.CIRP Annals— Manufacturing Technology52(2): 589–609.
Lovins, A. B. 1996. Negawatts: Twelve transitions, eight improvements and one distraction.Energy Policy24(4): 331–343.
Maxwell, D. and R. van der Vorst. 2003. Developing sustainable prod-ucts and services.Journal of Cleaner Production11(8): 883–895. Mazzioli, A., M. Germani, and R. Raffaeli. 2009. Direct fabrication
through electron beam melting technology of custom cranial im-plants designed in a PHANToM-based haptic environment. Ma-terials and Design30(8): 3186–3192.
Mognol, P., D. Lepicart, and N. Perry. 2006. Rapid prototyping: Energy and environment in the spotlight.Rapid Prototyping Journal12(1): 26–34.
Morrow, W. R., H. Qi, I. Kim, J. Mazumder, and S. J. Skerlos. 2007. Environmental aspects of laser-based and conventional tool and die manufacturing,Journal of Cleaner Production15(10): 932–943. Murr, L. E., S. M. Gaytan, E. Martinez, F. Medina, and R. B. Wicker. 2012. Next generation orthopaedic implants by additive man-ufacturing using electron beam melting.International Journal of Biomaterials2012: 1–14.
Murr, L. E., S. A. Quinones, S. M. Gaytan, M. I. Lopez, A. Rodela, E. Y. Martinez, D. H. Hernandez, E. Martinez, F. Medina, and R. B. Wicker. 2009. Microstructure and mechanical behavior of Ti-6Al-4V produced by rapid-layer manufacturing, for biomedi-cal applications.Journal of the Mechanical Behaviour of Biomedical Materials2(1): 20–32.
Psarra, S. and T. Grajewski. 2001. Describing shape and shape complex-ity using local properties. In Proceedings of the 3rd International Space Syntax Symposium, 7–11 May, Atlanta, GA, USA. Ruffo, M. and R. Hague. 2007. Cost estimation for rapid
manufacturing—Simultaneous production of mixed components using laser sintering.Proceedings of IMech E Part B: Journal of Engineering Manufacture221(11): 1585–1591.
Saidpour, H. 2004. Lightweight high performance materials for car body structures. In NTI Technology Conference, CEME, Ford Motor Company, 16 June, London.
Schaller, R. 1997. Moore’s law: Past, present and future.IEEE Spectrum 34(6): 53–59.
Spies, K. 1957. Die Zwischenformen beim Gesenkschmieden und ihre Herstellung durch Formwalzen [Intermediate shapes in die forg-ing and their manufacture through roll formforg-ing]. Diploma thesis, Technische Hochschule Hannover, Hanover, Germany. Stoneman, P. 2002.The economics of technological diffusion. Oxford, UK:
Blackwell.
Strutt, P. R. 1980. A comparative study of electron beam and laser melting of M2 tool steel.Materials Science and Engineering44(2): 239–250.
Taminger, K. M. B. and R. A. Hafley. 2002. Characterization of 2219 aluminium produced by electron beam freeform fabrication. In Solid Freeform Fabrication (SFF) Symposium, 5–7 August, Austin, TX, USA.
Tomov, B. and R. Radev. 2007. Shape complexity factor for closed die forging. InMETAL2007, 22–24 May, Hradec nad Moravici, Czech Republic.
Tuck, C. J., R. J. M. Hague, M. Ruffo, M. Ransley, and P. Adams. 2008. Rapid manufacturing facilitated customization. Interna-tional Journal of Computer Integrated Manufacturing21(3): 245– 258.
Vijayaraghavan, A. and D. Dornfeld. 2010. Automated energy moni-toring of machine tools.CIRP Annals—Manufacturing Technology 59(1): 21–24.
Waldman, M. 2003. Durable goods theory for real world markets. Jour-nal of Economic Perspectives17(1): 131–154.
Westk¨amper, E., L. Alting, and G. Arndt. 2000. Life cycle management and assessment: Approaches and visions towards sustainable man-ufacturing (keynote paper).CIRP Annals—Manufacturing Tech-nology49(2): 501–526.
About the Authors
All authors are members of the 3D Printing Research Group at the Faculty of Engineering at the University of Nottingham,
Nottingham, United Kingdom.Martin Baumersis a assistant professor, Chris Tuck is an associate professor, and Ricky Wildman,Ian Ashcroft, andRichard Hagueare professors.
Supporting Information
Additional Supporting Information may be found in the online version of this article at the publisher’s web site: