doi: 10.1093/gigascience/gix084
Advance Access Publication Date: 23 August 2017 Technical note
TE C H N I C A L N O T E
Combining semi-automated image analysis
techniques with machine learning algorithms
to accelerate large-scale genetic studies
Jonathan A. Atkinson
1
,
†
, Guillaume Lobet
2
,
3
,
†
, Manuel Noll
4
,
Patrick E. Meyer
4
, Marcus Griffiths
1
and Darren M. Wells
1
,
∗
1
Centre for Plant Integrative Biology, School of Biosciences, University of Nottingham, Sutton Bonington, LE12
5RD, United Kingdom,
2Agrosphere, IBG3, Forschungszentrum J ¨ulich, J ¨ulich 52425, Germany,
3Earth and Life
Institute, Universit ´e Catholique de Louvain, B-1348 Louvain-la-Neuve, Belgium and
4InBios, Universit ´e de
Li `ege, 4000 Li `ege, Belgium
∗Corresponding address.Darren M. Wells, Centre for Plant Integrative Biology, School of Biosciences, University of Nottingham, Sutton Bonington, LE12 5RD, United KIngdon; Tel:+44 (0) 115 9516373; E-mail:[email protected]
†Equal contribution
Abstract
Genetic analyses of plant root systems require large datasets of extracted architectural traits. To quantify such traits from images of root systems, researchers often have to choose between automated tools (that are prone to error and extract only a limited number of architectural traits) or semi-automated ones (that are highly time consuming). We trained a Random Forest algorithm to infer architectural traits from automatically extracted image descriptors. The training was performed on a subset of the dataset, then applied to its entirety. This strategy allowed us to (i) decrease the image analysis time by 73% and (ii) extract meaningful architectural traits based on image descriptors. We also show that these traits are sufficient to identify the quantitative trait loci that had previously been discovered using a semi-automated method. We have shown that combining semi-automated image analysis with machine learning algorithms has the power to increase the
throughput of large-scale root studies. We expect that such an approach will enable the quantification of more complex root systems for genetic studies. We also believe that our approach could be extended to other areas of plant phenotyping.
Keywords:root; plant phenotyping; machine learning; QTL analysis
Findings
Background
Plant root systems have many physiological roles, including the acquisition of water and nutrients, making them of critical im-portance for yield establishment in crops. The improvement of
root architectural traits will thus be crucial in delivering the yield improvement required to ensure future global food security [1,2]. Unfortunately, root systems are difficult to analyse and quantify: they are intrinsically complex due to their highly branched tree structure [3], and their growth in an opaque medium (soil) makes them difficult to observe.
Received:20 June 2017;Revised:9 August 2017;Accepted:16 August 2017 C
The Author 2017. Published by Oxford University Press. This is an Open Access article distributed under the terms of the Creative Commons Attribution License (http://creativecommons.org/licenses/by/4.0/), which permits unrestricted reuse, distribution, and reproduction in any medium, provided the original work is properly cited.
2 Atkinson et al.
For many years, root researchers have used specific experi-mental setups to observe and quantify root system architecture. Among these, the “pouch system” is widely used by the commu-nity to acquire large numbers of images of root systems [4–6]. In this approach, plants are grown on the surface of paper, al-lowing the root system to be imaged. The analysis of the result-ing root images can be performed either usresult-ing semi-automated [7,8] or fully automated root image analysis software [9,10]. Semi-automated tools require input and validation by an ex-pert user to faithfully extract the geometry of the root system. However, such user interaction is time consuming, which can strongly hinder the application of these approaches to large datasets (such as those required for quantitative genetic stud-ies). Fully automated software tools are faster, but the extracted descriptors are prone to unexpected errors and the quanti-fied traits are usually less informative [3]. This has led to im-age analysis being described as a new “bottleneck” in plant phenotyping [11].
Machine learning (a multidisciplinary field of computer sci-ence, statistics, artificial intelligsci-ence, and information theory) encompasses a range of techniques for the automatic produc-tion of analytical models and has been attracting the interest of the plant science community in recent years. Machine learn-ing is breaklearn-ing new ground in plant science via the automation of procedures and experiments that previously required manual curation. These automated workflows are catalysing the devel-opment of new data-driven plant science [12], including remote sensing [13], species identification [14], and phenotyping [15–18]. Recently, a new approach utilizing machine learning algorithms has been proposed for the identification of root system architec-tural traits; a Random Forest model was trained on correspond-ing ground-truth and image descriptors. The resultcorrespond-ing trained model was used to analyse a new set of simulated images and was shown to be much more accurate than the direct image de-scriptors [3].
Here, we have evaluated this technique using a similar ap-proach with experimental images and assessed its application to a large-scale genetic study. Our rationale was 2-fold. First, we can reasonably expect a certain level of homogeneity within datasets coming from a single genetic screening, as root systems from a given species share common attributes. Second, semi-automated root image analysis tools can be used to extract the ground-truth on a subset of images. Such ground truths can be used to train a machine learning algorithm that can then be used to analyse the remaining images in the dataset.
We show that such an approach (i) can yield better results than fully automated software analysis, (ii) is time-efficient compared to performing a semi-automated analysis on the whole dataset, and (iii) is able to correctly identify previously found quantitative trait loci (QTL) for root traits.
Overview of the analysis workflow
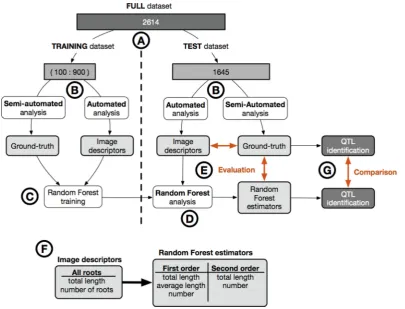
The dataset consists of 2614 RGB images of the roots of wheat seedlings obtained from growth pouch experiments as detailed in Atkinson et al. [5]. The images are of the root systems of the parental lines and 94 members of the Savannah×Rialto doubled haploid mapping population, with a minimum of 15 replicates per line. All images were processed using the semi-automatic root analysis tool RootNav (RootNav;RRID:SCR 015584) [7] to ex-tract phenotypic root system architectural traits, representing the “ground-truth” values. A subset of these images has been previously used to identify QTL for root traits [5]. The dataset was divided in 2 (Fig.1A): a training dataset,Dtrain, of variable
size (between 100 and 900 images out of 969) and a test dataset, Dtest, of 1645 images, comprising the image set used to identify QTL in the original experimental work [5]. For all images, we first extracted the true values of the traits (ground-truth;Ttrain,Ttest) using RootNav [7]. We then extracted a k-dimensional feature vector (“the image descriptor”) of each image using a fully au-tomated analysis pipeline, RIA-J [3]; the corresponding sets are Itrain,Itest(Fig.1B). We used the extracted data (Itrain, Ttrain) to train a Random Forest model M:I→Tto predict the different ground-truths based on the image descriptors (Fig.1C and F) [3]. The trained Random Forest modelMwas then applied to the image descriptorsItestfrom the test datasetDtestto predict the ground-truthTtest(named Random Forest estimators) (Fig.1D). The accuracy of both the image descriptors and the Random For-est For-estimators were then compared to the ground-truth acquired with RootNav.
One of the aims of our analysis was to assess the minimal size required for a training dataset. Therefore, we used differ-ent numbers of images for training: 100, 200, 300, 400, 500, 600, 700, 800, and 900. For each set, we randomly selected the im-ages out of the 969 imim-ages that comprised the training dataset, then repeated the training/accuracy procedure described above. To account for the fact that the images were randomly selected, for each test size, we repeated the procedure 10 times.
For each training dataset size, we used the Random Forest estimators to detect QTL regions associated with the different traits quantified (Fig.1G). The identified QTL regions were then compared to those previously identified using RootNav, as well as those identified using the direct image descriptors.
Random Forest estimators have a greater accuracy and greater biological relevance than image descriptors
It has been previously shown that Random Forest estimators are better at predicting the ground-truth values of various root sys-tem metrics compared to direct image descriptors [3]. However, this evaluation used simulated images, rather than a “real” ex-perimental dataset.
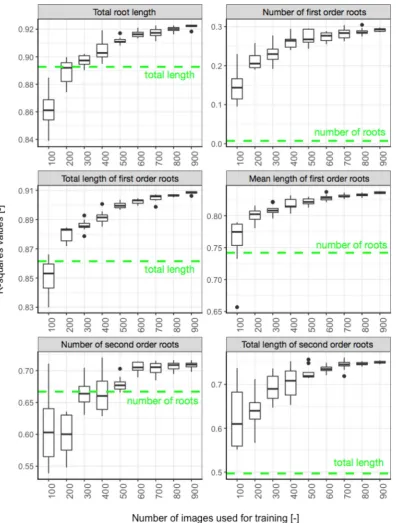
Here we show that this approach can also be used with ex-perimental data yielding better results than the direct image de-scriptors (Fig.2). We also show that, as expected, increasing the size of the training dataset increases the accuracy of the esti-mated metrics. For our data, we observe a strong increase in ac-curacy up to a dataset size of 500 training images, after which the improvement becomes marginal. Our approach also allows for the prediction of new metrics, not obtained using the direct image descriptors. For instance, the direct descriptors do not dif-ferentiate between the different root orders, whereas the Ran-dom Forest model does.
We observed a decrease in the variability of the predicted val-ues as the number of training images increased. This may be the result of a greater accuracy of the prediction, but may also be due to the fact that the same images are randomly selected for each repetition. As the number of training images increases, we expect the number of identical images across repetitions to increase as well (the total number of images in the training set being 969).
Random Forest estimators identify the correct QTLs
Figure 1:Overview of the analysis pipeline used in this study. (A) We divided the full dataset (2614 images) into two: a training set (100 to 900 images) and a test set (1645 images). (B) For each dataset, all the images were analysed using a semi-automated root image analysis tool (RootNav) to extract the ground-truth, as well as with a fully automated root image analysis tool (RIA-J) to extract image descriptors (see the text for details). (C) We trained a Random Forest model on the image descriptors and the ground-truth from the training dataset. (D) We applied the Random Forest model on the image descriptors from the test dataset. (E) We compared the image descriptors and the Random Forest estimators from the test dataset with their corresponding ground-truth. (F) Comparison of biologically relevant metrics extracted with the automated analysis and the Random Forest analysis. (G) QTL were identified and compared using both Random Forest estimators and the ground-truth data.
our test dataset were used in such a study to identify several QTL for root traits in wheat seedlings [5]. In addition to test-ing the accuracy of the Random Forest approach in estimattest-ing root system parameters, we wanted to know if these parameters could be used reliably for the identification of QTL. Since QTL identification had already been performed on our test dataset, we could directly assess the performance of our new pipeline against the original approach by using the same QTL detection technique on both the direct image descriptors and the traits derived from the random forest models.
The Random Forest models, trained on different numbers of images (100:900), were used on the image descriptors from the test dataset to predict 9 estimator datasets (named EST-100 to EST-900) for use in the QTL analysis (see Table1). This was done to assess the minimum size for the training dataset required for reliable QTL detection, which may be lower than that required to accurately predict the trait values themselves. The R package R/qtl [19] was used for QTL detection on the image descriptor dataset and the 9 Random Forest predicted datasets [5]. Iden-tified QTL were then directly compared to those found in this paper.
We observed that 12 out of 13 of the expected QTL were cor-rectly identified using the estimators from the Random Forest models trained on 600 or more images (EST-600: EST-900). We also observed that even using the smallest training set of 100 im-ages (EST-100), most of the QTLs were identified (10/12), with 12 of 13 being identified with the estimators from the model trained
with 300 images (EST-300). We did not observe an increase in the logarithm of odds (LOD) score with the increase of images (Table1).
In addition, 4 extra QTL were identified on chromosomes 4D and 6D. Two of these were identified for width and width-depth ratio from EST-300, EST-500, and EST-800 datasets (Table 1). Although in this example these have been labelled as false pos-itives as they were not detected in the original study, they both have related QTL co-localizing in the same positions (the 4D width QTL co-localizes with a W/D QTL, and the 6D W/D QTL co-localizes with both a width and depth QTL at the same lo-cation). Both QTL were also found using the image descriptors utilized to train the Random Forest model, possibly explaining their identification. Two additional QTL for seminal (first-order) root number were identified on chromosomes 6D and 7D from the EST-300 to EST-900 datasets. This is most likely due to the inability of the Random Forest to accurately predict the seminal number in our dataset (R2<0.3) (Fig.2).
4 Atkinson et al.
Figure 2:Accuracy of the Random Forest estimators. TheR2values of the linear regression between the Random Forest estimators and the ground-truths were computed
for each size and repetition of training datasets. The dotted line represents theR2value between the most closely related image descriptors and the ground-truth.
Combining semi-automated analysis and machine learning techniques increases the throughput of our image analysis pipeline
Extracting meaningful information from images of root systems is a subjective, tedious, and often time-consuming process. As a general rule, automated techniques can only extract a limited amount of biologically relevant metrics and are often limited to young plants. Semi-automated tools are able to extract more metrics and with a greater accuracy, but at the expense of user
interaction time (which makes them unsuited for larscale ge-netic studies). As a result, large gege-netic screens targeting root system traits often focus on a set of simple traits that can be automatically extracted.
Table 1:Results from the QTL comparison for the different estimator datasets
Chr Trait ID EST100 EST200 EST300 EST400 EST500 EST600 EST700 EST800 EST900 GT
4D Width 2.5 2.7
W/D 2.71 2.6 2.2 2.6 2.2 2.2 2.5 2.3 2.9 2.5 2.7
6D Seminal number 3.6 3.1 4.7 3.3 3.8 3.3 3.1
Total root length 17 13.6 15.0 14.4 15.2 14.2 16.0 14.7 16.3 15.3 24 Mean sem. length 13.4 13.7 13.8 13.8 13.8 14.0 13.9 13.5 15.6 22.2
Lateral number 12.6 19.0 18.2 17.6 18.5 17.0 17.6 16.7 15.4 9.1
Tot lateral length 11.2 13.0 14.2 12.0 15.3 12.6 13.3 12.2 11.7 6.4 Tot seminal length 13.8 13.1 14.1 14.8 13.7 15.2 14.7 14.7 14.4 25.6
Width 13.5 11.9 13.0 14.8 12.9 12.8 13.1 12.5 12.5 12.5 6.4
Depth 13.6 14.3 14.3 14.1 14.0 15.6 15.0 15.2 15.8 14.8 22.7
W/D 2.2 1.9
7A Seminal number 2.1
7D Lateral number 4.3 5.5 5.9 6.6 5.2 5.0 5.3 5.0 4.4 2.4
Seminal number 3.8 3.4 3.4 4.0 4.5
Tot lateral length 4.4 4.0 6.0 4.6 4.9 4.2 4.9 4.2 4.0 2
Tot root length 4.1 2.7 2.5 2.9 3.1 2.9 4.7 3.3 9
Tot seminal length 2.9 2.7 2.1 2.8 3.1 2.8 3.2 9.7
SUM 6 10 11 14 14 13 14 14 15 14 13
Green is a correct identification compared to results obtained using the RootNav pipeline, pink is a miss, yellow is a false positive, and grey is not comparable. Numbers represent the significant LOD score for each detected QTL generated by R/qtl [19]. Chr: chromosome; EST-100:900: Random Forest estimators derived from 100–900 images; GT: ground-truth, ID: image descriptors derived from RIA-J.
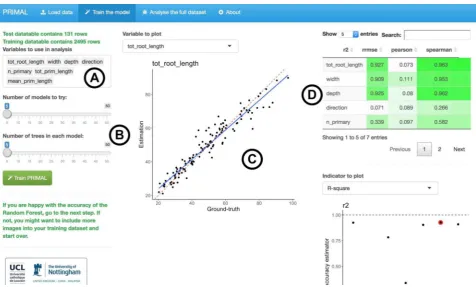
Figure 3:Screenshot of PRIMAL. (A) Variable to evaluate with the Random Forest algorithm. (B) Random Forest algorithm parameters. (C) Visualization of the accuracy of the Random Forest estimators. (D) Accuracy metrics for the different descriptors.
semi-automated tool to extract the parameters in the first place. Thus, instead of tracing all the images (in our case about 2600), only a subset (700) was needed. It was previously estimated that tracing 1 image takes, on average, 2 minutes. In our case, the whole dataset would represent a workload of 87 hours. With the combined pipeline, the workload decreased to 23 hours (27%).
In this example, we used a published dataset, for which the ground-truth data were already available [5]. In order to easily
apply this approach to future studies, we have created the R ap-plication Pipeline of Root Image analysis using MAchine Learn-ing (PRIMAL) (Fig.3) [20]. We recommend the following analysis strategy:
[image:5.595.59.536.318.605.2]6 Atkinson et al.
2. Use a semi-automated tool to extract the ground-truth for 200 random images (the GROUND-TRUTH DATASET). Remove these images from the global dataset.
3. Use PRIMAL to train the Random Forest model and analyse the data.
4. Check the accuracy of the prediction of the Random Forest model. If the prediction is not satisfactory, increase the num-ber of images in the ground-truth dataset and repeat the procedure. The final number of images in the ground-truth dataset will vary between experiments, plants, conditions, etc. In our example, 500 images were needed to reach a sat-isfactory accuracy for the Random Forest predictions.
A detailed version of this protocol is available at protocols.io [21].
It should be noted that the prediction accuracy of the Ran-dom Forest estimation is highly dependent on the homogene-ity of the data. For example, a Random Forest model trained on maize root systems will most likely fail when applied to wheat. However, for large-scale genetic studies, where only 1 species is used in the analysis, this should not be an issue. The accuracy of the Random Forest estimators is also a function of the variabil-ity of the direct descriptors in the dataset. Using a large set of descriptors that better discriminate the different images might help increase the accuracy of the Random Forest descriptors.
Conclusions
Genetic studies on root architecture require large annotated datasets of biologically relevant traits. Automated analysis tools can be used to extract descriptors from large libraries of root im-ages. Unfortunately, these descriptors are prone to error, and their biologically relevancy is not always clear. Alternatively, semi-automated tools enable the retrieval of more precise archi-tectural traits, but, due to the required skilled user inputs, they are often unsuitable for large datasets.
Here, we used a Random Forest model to predict architec-tural traits based on automatically extracted image descriptors. The model was trained on a subset of the whole dataset that had been previously analysed using a semi-automated tool. This strategy allowed us to (i) decrease the time required for the anal-ysis by 73% (compared to the semi-automated analanal-ysis of the whole dataset) and (ii) accurately predict meaningful architec-tural traits.
In order to make our pipeline available to the community, we have created an application, available at [20].
Methods
A detailed version of the protocol described here is available at protocols.io [21].
Availability of supporting source code and
requirements
— Project name: PRIMAL, Pipeline of Root Image analysis using MAchine Learning
— Project home page:https://plantmodelling.github.io/primal/
— Operating system(s): platform independent — Programming language: R
— Other requirements: none — License: GPL
Availability of supporting data
The following supporting data are open and available from the GigaSciencerepository,GigaDB [22]:
1. Root system image dataset #1. Images of root systems of plants tagged with genotype information; 1665 images from [5]. 2. Root system image dataset #2. Training images without
geno-type information; 969 images.
3. Root System Markup Language files for both image datasets. 4. Full genotype mapping information for the population, from
CerealsDB: http://www.cerealsdb.uk.net/cerealgenomics/Ce realsDB/Excel/SavannahXRialto˙map˙data˙May˙2013.xls.
Abbreviation
QTL: quantitative trait locus; LOD: logarithm of odds.
Competing interests
At the time of publication, G.L. was a Guest Editor for the Giga-Sciencethematic series “Plant Phenomics.”
Funding
This work was supported by the Biotechnology and Biologi-cal Sciences Research Council [grant number: BB/D019613/1]; the European Research Council [grant number: 294729]; and the Fonds De La Recherche Scientifique [grant number: 1.A.320.16F].
Author contributions
Conceptualization: G.L., D.M.W., J.A.A.; formal analysis: G.L., J.A.A., M.N., P.E.M.; resources: J.A.A., M.G., M.N., P.E.M.; writing— original draft: G.L., J.A.A.; writing—review and editing: G.L., J.A.A., M.G., D.M.W., M.N.; visualization: G.L., J.A.A.
References
1. Herder GD, Van Isterdael G, Beeckman T et al. The roots of a new green revolution. Trends Plant Sci 2010;15:600–7. 2. Lynch JP. Turner review no. 14. Roots of the second green
rev-olution. Aust J Bot 2007;55:493–512.
3. Lobet G, Koevoets IT, Noll M et al. Using a structural root system model to evaluate and improve the accuracy of root image analysis pipelines. Front Plant Sci 2017; doi: 10.3389/fpls.2017.00447.
4. Hund A, Trachsel S, Stamp P. Growth of axile and lateral roots of maize: I. Development of a phenotying platform. Plant Soil 2009;325:335–49.
5. Atkinson JA, Wingen LU, Griffiths M et al. Phenotyping pipeline reveals major seedling root growth QTL in hexaploid wheat. J Exp Bot Soc Experiment Biol 2015;66:2283–92. 6. Gioia T, Galinski A, Lenz H et al.GrowScreen-PaGe, a
non-invasive, high-throughput phenotyping system based on germination paper to quantify crop phenotypic diversity and plasticity of root traits under varying nutrient supply. Funct Plant Biol 2016;44(1):76–93.
7. Pound MP, French AP, Atkinson JA et al. RootNav: navi-gating images of complex root architectures. Plant Physiol 2013;162:1802–14.
9. Leitner D, Felderer B, Vontobel P et al. Recovering root system traits using image analysis exemplified by two-dimensional neutron radiography images of lupine. Plant Physiol 2014;164:24–35.
10. Cai J, Zeng Z, Connor JN et al. RootGraph: a graphic optimiza-tion tool for automated image analysis of plant roots. EXBOTJ 2015;66:6551–62.
11. Minervini M, Scharr H, Tsaftaris SA. Image analysis: the new bottleneck in plant phenotyping [applications corner]. IEEE Signal Process Mag 2015;32:126–31.
12. Ma C, Zhang HH, Wang X. Machine learning for big data analytics in plants. Trends Plant Sci 2014;19:798– 808.
13. Ali I, Greifeneder F, Stamenkovic J et al. Review of machine learning approaches for biomass and soil moisture retrievals from remote sensing data. Remote Sensing 2015;7:16398– 421.
14. Babatunde OH, Armstrong L, Leng J et al. A computer-based vision systems for automatic identification of plant species using kNN and genetic PCA. J Ag Inform 2015; doi:10.17700/jai.2015.6.1.152.
15. Minervini M, Abdelsamea MM, Tsaftaris SA. Image-based plant phenotyping with incremental learning and active contours. Ecol Inform 2014;23:35–48.
16. Singh A, Ganapathysubramanian B, Singh AK et al. Machine learning for high-throughput stress phenotyping in plants. Trends Plant Sci 2015;21:1–15.
17. Weiss U, Biber P, Laible S et al. Plant species classification us-ing a 3D LIDAR sensor and machine learnus-ing. In: Ninth Inter-national Conference on Machine Learning and Applications, Washington, DC, 2010, pp. 339–45. New York, NY: IEEE, 2011. 18. Pound MP, Atkinson JA, Burgess AJ et al. Deep Machine Learning provides state-of-the-art performance in image-based plant phenotyping. Gigascience 2017 Oct 1;6(10):1–10. doi:10.1093/gigascience/gix083.
19. Broman KW, Wu H, Sen S et al. R/qtl: QTL mapping in exper-imental crosses. Bioinformatics 2003;19:889–90.
20. PRIMAL. Pipeline of root image analysis using MAchine learning.https://plantmodelling.github.io/primal/. Accessed 10 August 2017.
21. Guillaume Lobet. PRIMAL: Pipeline of root image analysis using machine learning. protocols.io 2017.
http://dx.doi.org/10.17504/protocols.io.h7bb9in.
22. Atkinson JA, Lobet G, Noll M et al. Supporting data for “Combining semi-automated image analysis tech-niques with machine learning algorithms to accelerate large-scale genetic studies.” GigaScience Database 2017.