1 Brief Report
Maternal genome-wide DNA methylation profiling in gestational diabetes shows
distinctive disease-associated changes relative to matched healthy pregnancies
Dr Pensee Wu1,2, Prof William E. Farrell1, Dr Kim E. Haworth1, Prof Richard D.
Emes3,4, Dr Mark O. Kitchen1, Dr John R. Glossop1,5, Dr Fahmy W. Hanna6, Prof
Anthony A. Fryer1
1Institute for Science and Technology in Medicine; Keele University; Guy Hilton
Research Centre; Staffordshire, UK
2Academic Unit of Obstetrics and Gynaecology, University Hospital of North Midlands
NHS Trust, Stoke-on-Trent, Staffordshire, UK
3School of Veterinary Medicine and Science; University of Nottingham; Leicestershire,
UK
4Advanced Data Analysis Centre; University of Nottingham; Leicestershire, UK
5Haywood Rheumatology Centre; Haywood Hospital; Staffordshire, UK
6Department of Diabetes and Endocrinology, University Hospital of North Midlands
NHS Trust, Stoke-on-Trent, Staffordshire, UK
2
Revised: 07 March 2016
Accepted: 09 March 2016
All listed authors have no conflicts-of-interest to declare, and have no relevant
financial relationships to disclose.
Abbreviations
GDM Gestational diabetes
KEGG Kyoto encyclopedia of genes and genomes
T2DM Type 2 diabetes mellitus
QUIN Quinolinic acid
SNP Single-nu
cleotide polymorphism
SWAN
Subset-quantile within array normalization
Supplemental Material
[Supplementary Icon] Supplemental data for this article can be accessed on the publisher's
website.
Abstract
Several recent reports have described associations between gestational diabetes
(GDM) and changes to the epigenomic landscape where the DNA samples were
3
analysis to determine changes to the epigenome in a unique cohort of maternal blood
DNA from 11 pregnant women prior to GDM development relative to matched controls.
Hierarchical clustering segregated the samples into two distinct clusters comprising
GDM and healthy pregnancies. Screening identified 100 CpGs with a mean β-value
difference of ≥0.2 between cases and controls. Using stringent criteria, 5 CpGs (within
COPS8, PIK3R5, HAAO, CCDC124, and C5orf34 genes) demonstrated potentials to
be clinical biomarkers as revealed by differential methylation in 8 of 11 women who
developed GDM relative to matched controls. We identified, for the first time, maternal
methylation changes prior to the onset of GDM that may prove useful as biomarkers
for early therapeutic intervention.
Keywords: gestational diabetes, epigenetics, fetal programming, biomarker, 450K
4 Introduction
Gestational diabetes (GDM) is a pregnancy-specific endocrine disorder with a
prevalence of 3.5-14%.1 Due to the worldwide obesity epidemic and recently modified
diagnostic criteria, GDM is increasingly prevalent.2 It occurs because of a mismatch
between insulin production and requirement, leading to maternal hyperglycemia.
Since glucose is able to cross the placenta, whereas insulin is not, the fetus is also
exposed to hyperglycemic conditions. Women with GDM are at increased risk of
caesarean section and stillbirth compared with healthy women.3, 4 They are also more
likely to develop type 2 diabetes (T2DM), dyslipidemia, and cardiovascular disease in
later life,5-7 while their offspring have an increased long-term risk of obesity and
diabetes.2
Epigenetic modifications, which may be causal of or associated with changes in gene
expression, offer significant promise for understanding the underlying mechanisms of
GDM. Indeed, and as an example, epigenetic changes in T2DM have been reported
in genes involved in metabolism.8-13 Since maternal epigenetic modifications are
known to contribute to fetal programming,14 recent studies have investigated the role
of epigenetic alterations in offspring exposed to maternal hyperglycemia and found
5
modifications may play a role in the pathogenesis of GDM.20, 21
Epigenetic research in GDM has largely used targeted (candidate gene)
approaches.15, 16, 18, 19 To date, only two studies have utilized genome-wide
methodology17, 22 and in these cases investigators examined placenta and cord blood
samples from GDM pregnancies. Differentially methylated genes were identified
between GDM and healthy pregnancies,17, 22 which provide evidence for the
involvement of these genes and/or their differential methylation in GDM. However,
there have been no genome-wide studies examining methylation differences between
maternal tissue samples from GDM and healthy pregnancies. We decided to focus on
maternal epigenetic profiles, as they would facilitate the assessment of the in utero
environment and allow identification of predictive biomarkers that would enable
targeted intervention to high risk groups.
On the basis of the current literature, we hypothesized the presence of pre-existing
epigenetic markers in women who subsequently go on to develop GDM. In this study,
and for the first time in this disease, we interrogated genome-wide DNA methylation in
peripheral blood samples collected from women prior to the development of GDM and
6
cohort, our aim was to identify candidate genes with future promise as potential
biomarkers for the prediction of GDM in early pregnancy.
Results
Our initial data analyses focused on comparison of our data in antenatal samples with
the two recent genome-wide studies that investigated cord blood and placental tissue
samples.17, 22 We compared our data with those of Finer et al.22 and Ruchat et al.17
separately due to the different approaches used for data processing by each study
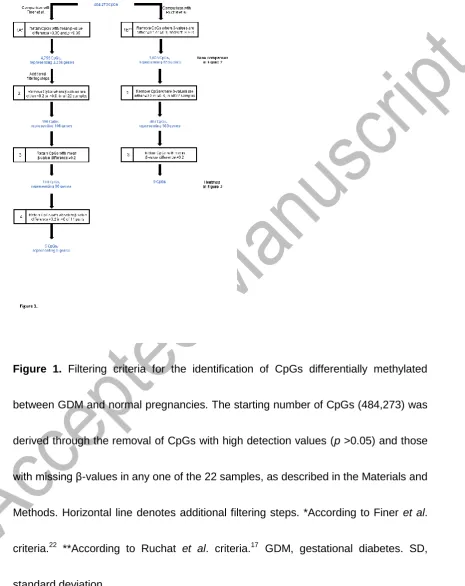
(Figure 1). Using the filtering criteria shown in step 1A of Figure 1, comparison of our
data with those of Finer et al.22 identified 4,755 differentially methylated CpGs
(representing 2,236 genes) where the mean β-value difference between the GDM and
healthy groups was >0.05 and statistically significant (P<0.05). In contrast,
comparison with the data of Ruchat et al.17 (step 1B of Figure 1) identified 1,035
CpGs (representing 633 candidate genes). We also performed the same comparison
after applying multiple testing adjustment using the false discovery rates, which
showed no overlap of our data with these two studies.
As shown in Figure 2A, by comparing the 2,236 genes identified as differentially
7
between maternal blood, umbilical cord, and placenta: Hook Microtubule-Tethering
Protein 2 (HOOK2) and Retinol Dehydrogenase 12 (RDH12). Conversely, and as
summarized by the Venn diagram in Figure 2B, there were no genes common to all
three tissue types when we compared our data with that of Ruchat et al.17
The 4,755 CpGs initially identified as differentially methylated were then subjected to
further filtering (steps 2 and 3, Figure 1). Using this approach, we identified 100
unique CpGs (comprising 66 genes) that were differentially methylated between GDM
and healthy pregnancies (the full annotated list is shown in Table S1). None of these
CpGs have an annotated single-nucleotide polymorphism (SNP) in the probe. Closer
examination of the 100 CpGs revealed that the majority (53%) were hypomethylated
in GDM relative to healthy pregnancies. The observed differences in mean β-value
showed a maximum difference of 0.38. The frequency and DNA methylation of these
differentially methylated CpG sites in relation to their genomic location and CpG
islands are shown in Figure S1. Of the differentially methylated CpGs, 45% were
associated with a CpG island, shelf, or shore (Figure S1C).
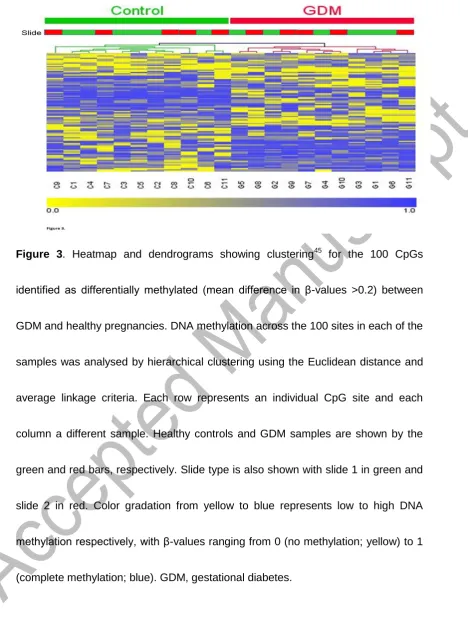
Hierarchical clustering was performed to determine whether the methylation patterns
8
The heatmap in Figure 3 illustrates that there are distinctive methylation patterns
between GDM and healthy pregnancies, which segregate samples into two distinct
groups comprising those from GDM and healthy populations. The slide type did not
cause the clustering; therefore, our results were not due to batch effects. Calculation
of the genomic inflation factor before and after normalization steps showed that
removal of SNP containing probes and subset-quantile within array normalization
(SWAN) by the minfi package reduced the genomic inflation.23-25 Pre-normalization λ
was estimated to be 1.189 (standard error of the estimation = 9.461 x 10⁻⁵); after
normalization, the estimated λ was reduced to 1.132 (standard error of the estimation
= 7.461 x 10⁻⁵). The remaining genomic inflation suggests that mild
confounding stratification factors remain unaccounted for in the data.
Enrichment of gene ontology terms and biological pathways within the 66 genes
associated with differentially methylated CpGs were assessed using DAVID online
software26 and identified 11 overrepresented pathways, with the top three (ranked by
P-value) involved in cell adhesion molecules, type 1 diabetes mellitus, and keratin
pathways. However, enrichment of these pathways was not statistically significant
9
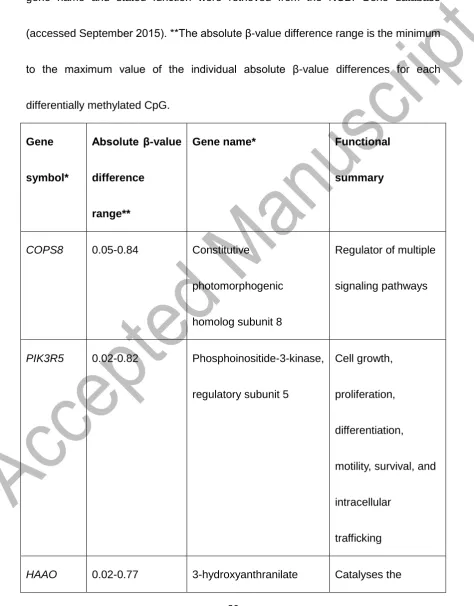
Finally, we examined the absolute β-value differences across all 11 matched pairs.
Using this stringent criteria, in 5 of the 100 CpGs identified, at least 8 of the 11 GDM
pregnancies showed β-value differences of >0.2 relative to matched controls. The 5
CpGs comprised of 5 genes (COPS8, PIK3R5, HAAO, C5orf34, and CCDC124) and
their functions are shown in Table 1.
Discussion
We describe for the first time, genome-wide DNA methylation changes in maternal
blood prior to the diagnosis of GDM. We identified 2 differentially methylated genes
that shared identity with genes previously described in studies that interrogated
placenta and umbilical cord blood samples and, in these cases, using the same array
platforms.17, 22 Furthermore, using stringent filtering criteria, we identified 100 unique
CpGs that segregated GDM and healthy pregnancies into distinct groups upon
hierarchical clustering.
The strength of our study, in contrast to previous studies, is that we carefully matched
each GDM pregnancy to a healthy one to ensure the samples were comparable.17, 22
Furthermore, as all samples were taken prior to development of pregnancy
10
We were able to compare our data to those from two recent genome-wide studies in
GDM using cord blood and placenta tissue.17, 22 Comparative analysis with Finer et
al.22 showed that HOOK2 and RDH12 were common to maternal blood, placenta and
cord blood. HOOK2 codes for a linker protein that mediates binding to organelles and
is responsible for morphogenesis of cilia and endocytosis.27, 28,29 RDH12 encodes a
retinal reductase, which also plays a role in the metabolism of short-chain
aldehydes.27, 30 In terms of KEGG orthology, it is involved in metabolic pathways as
well as retinal metabolism.31 These two genes, therefore, may represent important
candidates for further study.
The disparity of candidate genes when comparisons are made to the previous studies
might reflect the different data filtering criteria used by Ruchat et al. 17 and Finer et
al.22 Using the Finer et al. criteria, many of the differentially methylated CpGs are
likely to have β-value differences <0.2, which could be difficult to reproduce either by
alternative methodologies, such as pyrosequencing or in replication studies using
independent patient cohorts. Moreover, we used a distinct patient population to the
other two studies. We used samples from women prior to the development of their
11
established GDM. Furthermore, we used maternal blood samples, rather than
placenta and cord blood samples. These disparities may have contributed to the
differences in the absolute numbers of CpGs/genes identified.
Further analysis of our cohort identified 100 independent CpGs (comprising 66 genes),
which were found to cluster GDM and healthy pregnancies separately. Reassuringly,
these CpGs have no annotated SNPs in the probe. Enrichment of gene ontology
terms and biological pathways of these 66 genes showed enrichment for genes
involved in cell adhesion, type 1 diabetes mellitus, and keratin pathways.26, 32
Although the enrichment was not statistically significant following adjustment for false
discovery rates, these are promising candidates, which are worth examining to
elucidate the biological mechanisms behind GDM. In future work, it will be important
to verify, in larger independent cohorts, the candidates identified herein and to
determine the impact of differential methylation. This may in the future improve the
understanding of GDM pathogenesis and aid in the development of therapy.
The design of this pilot study was to generate a list of genes of interest using a
relatively small number of samples. In order to avoid type II errors (false negatives),
12
screening. We then applied more stringent methodology (steps 2-4 of Figure 1) to
identify candidate genes. A potential limitation of our study is the possibility of
genomic inflation. Mild confounding stratification factors, such as changes in
composition of blood during the pregnancy, the time of blood sampling, and parity,
may have inflated the data. Therefore, we further validated the array data using an
independent method with pyrosequencing in order to confirm our findings.
On closer inspection, 8 of 11 women who subsequently developed GDM showed
differential methylation at 5 CpGs (consisting of COPS8, PIK3R5, HAAO, CCDC124,
and C5orf34 genes) relative to matched controls. COPS8 encodes a regulator of
multiple signaling pathways.27, 33 It is involved in protein binding and negative
regulation of cell proliferation.33, 34 The PIK3R5 protein has important roles in cell
growth, proliferation, motility, differentiation, survival, and intracellular trafficking.27,
35-37 The HAAO protein catalyzes the synthesis of quinolinic acid (QUIN). Increased
cerebral levels of QUIN may participate in the pathogenesis of neurologic and
inflammatory disorders, which may be mediated by HAAO.27, 38 This unique epigenetic
signature may form the basis of future biomarker studies using a larger validation
cohort. The CCDC124 protein is involved in cell cycle and division.39C5orf34 encodes
13 uncharacterised.27
In summary, for the first time, using a genome-wide approach in maternal blood, we
have identified maternal methylation changes prior to the diagnosis of GDM. As a
discovery-based study, our findings may prove useful towards developing simple
biomarkers for predicting GDM, thus facilitating intervention strategies in the early
antenatal period to improve the health of the mother and baby, both during pregnancy
and in the long-term.
Materials and Methods
Patients
Peripheral blood samples were obtained from women prospectively recruited at the
University Hospital of North Midlands, UK, between 12-16 weeks gestation, prior to
the diagnosis of any pregnancy complications as part of the EFFECT-M study.40 At the
end of pregnancy, we identified 11 women who had GDM and individually matched
each one with a healthy woman who had a normal pregnancy. They were matched in
terms of age, body mass index, ethnicity, smoking status, medications and folate
supplementation (Table S3). The study was approved by the West Midlands (Black
14 Genome-wide DNA methylation profiling
We performed genome-wide analysis of DNA methylation using the Illumina
HumanMethylation450 BeadChip (450K) array, which examines over 480,000
individual CpG sites. We first extracted genomic DNA from blood samples collected
into potassium EDTA using standard phenol/chloroform procedures. Next, samples
were sodium bisulfite converted 41 and hybridized to arrays according to Illumina
recommended protocols that we have previously described.42 Methylation at
individual CpGs is reported as a methylation β-value, which is a quantitative measure
of methylation for each CpG site with range between 0 (no methylation) to 1
(completely methylated).
Validation by sodium bisulfite pyrosequencing
A technical validation between array β-values and methylation levels was determined
by sodium bisulfite pyrosequencing in all 22 samples. To increase template quantity
for pyrosequencing assays, whole genome amplification of bisulfite-converted DNA
followed by touchdown PCR were performed as previously described.42 A PyroMark
Q24 instrument was used to run pyrosequencing assays according to the
15
PyroMark Q24 software (v 2.0.6., build 20; Qiagen). Seven CpGs representing 5
genes were chosen to provide a range of β-values. These demonstrated a strong
positive correlation between β-values and percentage methylation by bisulphite
sequencing (Spearman’s r = 0.92, Figure S2).
Data analysis
Each array passed quality control assessment based on the performance of internal
array controls. Initial processing, probe type correction and assessment of array data
was conducted using the minfi package and SWAN.23, 24 Probes with known SNPs
were removed. All CpGs for which one or more of the 22 samples displayed detection
P-values > 0.05 (indicating an unreliable site) or presented with missing β-values
were excluded. The genomic inflation factor (λ, the ratio of the median of the observed
distribution of the test statistic to the expected median) was calculated using the
estlambda function of GenABEL.25
We filtered the data using criteria shown in Figure 1 to identify differentially
methylated sites between GDM and healthy pregnancies. In step the first analysis, we
elected to use a minimum β-value difference of 0.05, in part to permit comparisons
16
from GDM pregnancies also using the 450K array platform (step 1, Figure 1).22 The
genes identified as differentially methylated were obtained from the supplementary
data of this particular publication. We also compared our data with a separate cohort
of placenta and umbilical cord blood samples from GDM pregnancies.17 We obtained
their list of differentially methylated genes through personal communication with the
corresponding author of the publication. Further filtering steps were applied to
facilitate a more stringent analysis. To reduce the number of non-variable sites to
improve the statistical power of subsequent analyses, we removed all sites with
β-values ≥0.8 and ≤0.2 in all 22 samples (step 2, Figure 1). This is an approach that
has been used by our group as well as by others.41-44 As described previously by our
group, we consider it a more robust methodology to remove from the data set CpGs
that failed in any one of the samples, instead of eliminating specific failed CpGs from
specific samples.42 We retained only those CpGs that had a mean β-value difference
of ≥0.2 (step 3, Figure 1). Finally we examined the absolute β-values in each matched
pairs. We used a cut-off of ≥0.2 mean β-values difference to identify CpGs with
considerable methylation differences.
Hierarchical clustering was performed utilizing Genesis software (v1.7.6) using
17
and biological pathways within the genes associated with differentially methylated
CpGs were assessed using DAVID online software. 26, 32
Disclosure of potential conflicts of interest
No potential conflicts of interest were disclosed.
Acknowledgement
The authors are grateful to Khaled Ismail, Angela Rooney, and Emma Hubball who
obtained the EFFECT-M samples. This work was supported by funding provided by
18 References
1. American Diabetes Association. Diagnosis and classification of diabetes mellitus.
Diabetes Care 2011; 34:S62-S9.
2. National Collaborating Centre for Women's and Children's health. Diabetes in
pregnancy. Management of diabetes and its complications from preconception to the
postnatal period. NICE 2015; 3.
3. Gorgal R, Gonçalves E, Barros M, Namora G, Magalhães Â, Rodrigues T, et al.
Gestational diabetes mellitus: A risk factor for non-elective cesarean section. Journal
of Obstetrics and Gynaecology Research 2012; 38:154-9.
4. Schmidt MI, Duncan BB, Reichelt AJ, Branchtein L. Gestational diabetes mellitus
diagnosed with a 2-h 75-g oral glucose tolerance test and adverse pregnancy
outcomes. Diabetes Care 2001; 24:1151-5.
5. Bellamy L, Casas JP, Hingorani AD, Williams D. Type 2 diabetes mellitus after
gestational diabetes: a systematic review and meta-analysis. The Lancet 2009;
373:1773-9.
6. Akinci B, Celtik A, Genc S, Yener S, Demir T, Secil M, et al. Evaluation of
postpartum carbohydrate intolerance and cardiovascular risk factors in women with
19
7. Rivero K, Portal VL, Vieira M, Behle I. Prevalence of the impaired glucose
metabolism and its association with risk factors for coronary artery disease in women
with gestational diabetes. Diabetes Research and Clinical Practice 2008; 79:433-7.
8. Ling C, Del Guerra S, Lupi R, Rönn T, Granhall C, Luthman H, et al. Epigenetic
regulation of PPARGC1A in human type 2 diabetic islets and effect on insulin
secretion. Diabetologia 2008; 51:615-22.
9. Kulkarni SS, Salehzadeh F, Fritz T, Zierath JR, Krook A, Osler ME. Mitochondrial
regulators of fatty acid metabolism reflect metabolic dysfunction in type 2 diabetes
mellitus. Metabolism 2012; 61:175-85.
10. Yang BT, Dayeh TA, Volkov PA, Kirkpatrick CL, Malmgren S, Jing X, et al.
Increased DNA methylation and decreased expression of PDX-1 in pancreatic islets
from patients with type 2 diabetes. Molecular Endocrinology 2012; 26:1203-12.
11. Yang BT, Dayeh TA, Kirkpatrick CL, Taneera J, Kumar R, Groop L, et al. Insulin
promoter DNA methylation correlates negatively with insulin gene expression and
positively with HbA1c levels in human pancreatic islets. Diabetologia 2011; 54:360-7.
12. Hall E, Dayeh T, Kirkpatrick CL, Wollheim CB, Dekker Nitert M, Ling C. DNA
methylation of the glucagon-like peptide 1 receptor (GLP1R) in human pancreatic
islets. BMC medical genetics 2013; 14:76.
20
al. Genome-wide analysis of DNA methylation differences in muscle and fat from
monozygotic twins discordant for type 2 diabetes. PloS one 2012; 7:e51302.
14. Gluckman PD, Hanson MA, Buklijas T, Low FM. Epigenetic mechanisms that
underpin metabolic and cardiovascular diseases. Nature Reviews Endocrinology
2009; 5:401-8.
15. Bouchard L, Thibault S, Guay SP, Santure M, Monpetit A, St-Pierre J, et al.
Leptin gene epigenetic adaptation to impaired glucose metabolism during pregnancy.
Diabetes Care 2010; 33:2436-41.
16. Bouchard L, Hivert MF, Guay SP, St-Pierre J, Perron P, Brisson D. Placental
adiponectin gene DNA methylation levels are associated with mothers’ blood glucose
concentration. Diabetes 2012; 61:1272-80.
17. Ruchat SM, Houde AA, Voisin G, St-Pierre J, Perron P, Baillargeon JP, et al.
Gestational diabetes mellitus epigenetically affects genes predominantly involved in
metabolic diseases. Epigenetics 2013; 8:935-43.
18. Houde AA, Guay SP, Desgagné V, Hivert MF, Baillargeon JP, St-Pierre J, et al.
Adaptations of placental and cord blood ABCA1 DNA methylation profile to maternal
metabolic status. Epigenetics 2013; 8:1289-302.
19. El Hajj N, Pliushch G, Schneider E, Dittrich M, Müller T, Korenkov M, et al.
21
gestational diabetes mellitus. Diabetes 2013; 62:1320-8.
20. Lehnen H, Zechner U, Haaf T. Epigenetics of gestational diabetes mellitus and
offspring health: the time for action is in early stages of life. Molecular Human
Reproduction 2013; 19:415-22.
21. Ma RC, Tutino GE, Lillycrop KA, Hanson MA, Tam WH. Maternal diabetes,
gestational diabetes and the role of epigenetics in their long term effects on offspring.
Progress in Biophysics and Molecular Biology 2015; 118:55-68.
22. Finer S, Mathews C, Lowe R, Smart M, Hillman S, Foo L, et al. Maternal
gestational diabetes is associated with genome-wide DNA methylation variation in
placenta and cord blood of exposed offspring. Human Molecular Genetics 2015;
24:3021-9.
23. Aryee MJ, Jaffe AE, Corrada-Bravo H, Ladd-Acosta C, Feinberg AP, Hansen KD,
et al. Minfi: a flexible and comprehensive Bioconductor package for the analysis of
Infinium DNA methylation microarrays. Bioinformatics 2014; 30:1363-9.
24. Maksimovic J, Gordon L, Oshlack A. SWAN: Subset-quantile within array
normalisation for Illumina Infinium HumanMethylation450 BeadChips. Genome
Biology 2012; 13:R44.
25. Aulchenko YS, Ripke S, Isaacs A, van Duijn CM. GenABEL: an R library for
22
26. Huang DW, Sherman BT, Lempicki RA. Systematic and integrative analysis of
large gene lists using DAVID bioinformatics resources. Nature Protocols 2008;
4:44-57.
27. Maglott D, Ostell J, Pruitt KD, Tatusova T. Entrez Gene: gene-centered
information at NCBI. Nucleic Acids Res 2005; 33:D54-8.
28. Baron Gaillard CL, Pallesi-Pocachard E, Massey-Harroche D, Richard F, Arsanto
JP, Chauvin JP, et al. Hook2 is involved in the morphogenesis of the primary cilium.
Molecular Biology of the Cell 2011; 22:4549-62.
29. Krämer H, Phistry M. Genetic analysis of hook, a gene required for endocytic
trafficking in drosophila. Genetics 1999; 151:675-84.
30. Haeseleer F, Jang GF, Imanishi Y, Driessen CAGG, Matsumura M, Nelson PS, et
al. Dual-substrate specificity short chain retinol dehydrogenases from the vertebrate
retina. Journal of Biological Chemistry 2002; 277:45537-46.
31. Kanehisa M, Susumu G. KEGG: Kyoto encyclopedia of genes and genomes.
Nucleic Acids Research 2000; 28:27-30.
32. Huang DW, Sherman BT, Lempicki RA. Bioinformatics enrichment tools: paths
toward the comprehensive functional analysis of large gene lists. Nucleic Acids
Research 2009; 37:1-13.
23
subunit Csn8 is involved in maintaining proper duration of the G1 phase. Journal of
Biological Chemistry 2013; 288:20443-52.
34. Rolland T, Taşan M, Charloteaux B, Pevzner Samuel J, Zhong Q, Sahni N, et al.
A proteome-scale map of the human interactome network. Cell; 159:1212-26.
35. Johnson C, Marriott SJ, Levy LS. Overexpression of p101 activates PI3Kγ
signaling in T cells and contributes to cell survival. Oncogene 2007; 26:7049-57.
36. Shymanets A, Prajwal, Vadas O, Czupalla C, LoPiccolo J, Brenowitz M, et al.
Different inhibition of Gβγ-stimulated class IB phosphoinositide 3-kinase (PI3K)
variants by a monoclonal antibody. Specific function of p101 as a Gβγ-dependent
regulator of PI3Kγ enzymatic activity. Biochemical Journal 2015; 469:59-69.
37. Brock C, Schaefer M, Reusch HP, Czupalla C, Michalke M, Spicher K, et al.
Roles of Gβγ in membrane recruitment and activation of p110γ/p101 phosphoinositide
3-kinase γ. The Journal of Cell Biology 2003; 160:89-99.
38. Kohler C, Eriksson LG, Flood PR, Hardie JA, Okuno E, Schwarcz R. Quinolinic
acid metabolism in the rat brain. Immunohistochemical identification of
3-hydroxyanthranilic acid oxygenase and quinolinic acid phosphoribosyltransferase in
the hippocampal region. The Journal of Neuroscience 1988; 8:975-87.
39. Telkoparan P, Erkek S, Yaman E, Alotaibi H, Bayik D, Tazebay UH. Coiled-coil
24
interacts with the Ras-guanine nucleotide exchange factor 1B and is involved in
cytokinesis. PloS one 2013; 8:e69289.
40. Fryer AA, Nafee TM, Ismail KM, Carroll WD, Emes RD, Farrell WE. LINE-1 DNA
methylation is inversely correlated with cord plasma homocysteine in man: a
preliminary study. Epigenetics 2009; 4:394-8.
41. Fryer AA, Emes RD, Ismail KM, Haworth KE, Mein C, Carroll WD, et al.
Quantitative, high-resolution epigenetic profiling of CpG loci identifies associations
with cord blood plasma homocysteine and birth weight in humans. Epigenetics 2011;
6:86-94.
42. Glossop JR, Nixon NB, Emes RD, Haworth KE, Packham JC, Dawes PT, et al.
Epigenome-wide profiling identifies significant differences in DNA methylation
between matched-pairs of T- and B-lymphocytes from healthy individuals. Epigenetics
2013; 8:1188-97.
43. Byun HM, Siegmund KD, Pan F, Weisenberger DJ, Kanel G, Laird PW, et al.
Epigenetic profiling of somatic tissues from human autopsy specimens identifies
tissue- and individual-specific DNA methylation patterns. Human Molecular Genetics
2009; 18:4808-17.
44. Glossop JR, Emes RD, Nixon NB, Packham JC, Fryer AA, Mattey DL, et al.
25
methylome changes in T- and B-lymphocytes. Epigenomics 2015 Nov 10. [Epub
ahead of print].
45. Sturn A, Quackenbush J, Trajanoski Z. Genesis: cluster analysis of microarray
26
Table 1. Annotation for the 5 genes differentially methylated in 8 of 11 matched pairs,
as determined by genome-wide DNA methylation analysis. *The official gene symbol,
gene name and stated function were retrieved from the NCBI Gene database
(accessed September 2015). **The absolute β-value difference range is the minimum
to the maximum value of the individual absolute β-value differences for each
differentially methylated CpG.
Gene
symbol*
Absolute β-value
difference
range**
Gene name* Functional
summary
COPS8 0.05-0.84 Constitutive
photomorphogenic
homolog subunit 8
Regulator of multiple
signaling pathways
PIK3R5 0.02-0.82 Phosphoinositide-3-kinase,
regulatory subunit 5
Cell growth,
proliferation,
differentiation,
motility, survival, and
intracellular
trafficking
27
3,4-dioxygenase synthesis of
quinolinic acid
(QUIN), which is
an excitotoxin that
may participate in the
pathogenesis of
neurologic and
inflammatory
disorders
CCDC124 0.01-0.79 Coiled-coil domain
containing 124
Cell cycle, cell
division
C5orf34 0.01-0.77 Chromosome 5 open
reading frame 34
Unknown, but
sequence is
conserved in
chimpanzee, Rhesus
monkey, dog, cow,
mouse, rat, chicken,
28
Figure 1. Filtering criteria for the identification of CpGs differentially methylated
between GDM and normal pregnancies. The starting number of CpGs (484,273) was
derived through the removal of CpGs with high detection values (p >0.05) and those
with missing β-values in any one of the 22 samples, as described in the Materials and
Methods. Horizontal line denotes additional filtering steps. *According to Finer et al.
criteria.22 **According to Ruchat et al. criteria.17 GDM, gestational diabetes. SD,
[image:28.595.77.543.135.722.2]29
Figure 2. Venn diagrams illustrating comparison of genes differentially methylated in
GDM using maternal blood with those identified in cord blood and placenta of GDM
affected pregnancies from the cohorts of (A) Finer et al.22 and (B) Ruchat et al.17,
respectively. The genes from our dataset that were common with the other study are
shown in dark gray shading. Genes identified as differentially methylated in Finer et
al.22 were obtained from Supplementary file 2 of the published article, while the list of
differentially methylated genes identified by Ruchat et al.17 was kindly provided
30
Figure 3. Heatmap and dendrograms showing clustering45 for the 100 CpGs
identified as differentially methylated (mean difference in β-values >0.2) between
GDM and healthy pregnancies. DNA methylation across the 100 sites in each of the
samples was analysed by hierarchical clustering using the Euclidean distance and
average linkage criteria. Each row represents an individual CpG site and each
column a different sample. Healthy controls and GDM samples are shown by the
green and red bars, respectively. Slide type is also shown with slide 1 in green and
slide 2 in red. Color gradation from yellow to blue represents low to high DNA
methylation respectively, with β-values ranging from 0 (no methylation; yellow) to 1
[image:30.595.74.543.70.688.2]