1
Can we predict dividend cuts?
Enrico Onali Aston Business School
Aston University
Birmingham, B4 7ET
E-Mail: e.onali@aston.ac.uk
Phone: +44(0)1212043060
Abstract
I examine the predictability of dividend cuts based on the time interval between dividend announcement dates using a large dataset of U.S. firms from 1971 to 2014. The longer the time interval between dividend announcements, the larger the probability of a cut in the dividend per share, consistent with the view that firms delay the release of bad news.
JEL code: G35
2
Can we predict dividend cuts?
Abstract
I examine the predictability of dividend cuts based on the time interval between dividend announcement dates using a large dataset of U.S. firms from 1971 to 2014. The longer the time interval between dividend announcements, the larger the probability of a cut in the dividend per share, consistent with the view that firms delay the release of bad news.
JEL code: G35
3
I. Introduction
Dividend policy is a key topic in the mainstream finance literature. A hitherto undisputed finding is that publicly listed firms tend to smooth dividends to avoid dividend cuts (Lintner (1956)).1 Recent
contributions investigate the determinants of dividend smoothing both in the U.S. (Leary and Michaely (2011)) and globally (Javakhadze, Ferris and Sen (2014)).
A possible reason for dividend smoothing is provided by signalling theory: dividend changes convey information to the market on the value of the firm.2 Kalay and Loewenstein (1986) are the first to
specifically study the timing of dividend announcements and its informational content. Damodaran (1989) investigates day-of-the-week effects in dividend announcement dates. Hull (2013, 2015) studies the timing of dividend cuts in relation to the business cycle. Further research on this topic is, however, rather sparse.
In this paper, I investigate the timing preferences for dividend announcement dates using a large dataset of U.S. firms from the CRSP database from 1971 to 2014. In particular, I address the following research question: Can the timing of dividend announcements predict cuts in dividend per share (DPS)?
The relationship between the timing of dividend announcements and dividend cuts has already been addressed by the literature: Kalay and Loewenstein (1986) show that dividend cuts occur more often when dividend announcements are “late”. However, Kalay and Loewenstein (1986) focus on a very short time period (1978-1980), and base their analysis on a definition of “late” dividend announcement which is somewhat “arbitrary”, that is, by means of “manual inspection of the pattern of past dividend announcement dates” (Kalay and Loewenstein (1986), p. 376). Moreover, while the literature has
1 Michaely and Roberts (2006) provide evidence that for private firms dividend smoothing is less pronounced.
2 Seminal studies from the end of the sixties until the mid-eighties examine the informational content of dividend changes by investigating the
4
recently investigated the determinants of dividend smoothing both in the U.S. (Leary and Michaely (2011)) and globally (Javakhadze, Ferris and Sen (2014)), there is currently no empirical study that investigates predictability in dividend changes based on the timing of dividend announcements.
I provide evidence that extends the findings provided by Kalay and Loewenstein (1986). Kalay and Loewenstein (1986) find that “late” dividend announcements increase the probability of a dividend cut. This finding is ascribed to the fact that bad news (a dividend cut) tend to be delayed by firms. My findings corroborate Kalay and Loewenstein (1986): the number of calendar (or trading) days between two consecutive announcementsis associated with an increase in the probability of a dividend cut. The probability of a dividend increase, on the other hand, is uncorrelated with the timing of the dividend announcement. I also provide some evidence that dividend increases are associated with “early” dividend announcements.
The rest of the paper is structured as follows. Section II describes the data set and reports the main features of the sample. Section III investigates potential determinants of dividend changes, borrowing from the literature on the propensity to pay dividends and dividend smoothing. Finally, section IV concludes.
II. Sample selection and methodology
The data set of quarterly dividend announcements dates in CRSP is available for the period starting from 1st January 1962. I consider firms whose primary exchange is the NYSE, AMEX (now NYSE
5
DeAngelo, DeAngelo, and Stulz (2006)). Because I am interested in dividend announcement dates, rather than the propensity to pay dividends, all firms in the sample are dividend payers, although there may be periods for which dividend distributions are interrupted for a number of years.
My baseline regressions are based on Probit models:
Dit= f(Xit, C it) (1)
where Dit is a dummy variable equal to 1 if there is:
1. A DPS increase in quarter t relative to the previous quarter and 0 otherwise; 2. A DPS decrease in quarter t relative to the previous quarter and 0 otherwise.
I examine dividend increases and dividend decreases separately because “early” or “late” announcements are expected to increase the probability of a dividend cut, but not the probability of a dividend increase (Kalay and Loewenstein (1986)). I use the nominal DPS, rather than real DPS, as in previous literature on dividend announcements (for example, Aharony and Swary (1980); Kalay and Loewenstein (1986)).
The main variable of interest, Xit, is the number of calendar days between two consecutive
declaration dates (for quarter t – 1 and quarter t) for the same firm.3 For firms that do not omit
dividends, the number of calendar days between two consecutive announcements should be around 90.4
The control variables, represented by the vector Cit, are borrowed from the literature on dividend
smoothing and the propensity to pay dividends. Fama and French (2001) provide evidence that firms that are bigger, more profitable and with lower investment opportunities tend to pay dividends.
3 The number of calendar days between two announcements can be longer than a quarter for periods of disruption in dividend payments. For
example, if the company missed an announcement, this would result in around 180 calendar days between the two announcements. However, as reported in the notes to the table, all variables are winsorized at the 1st and 99th percentile. The first percentile is 44 and the 99th percentile is 182 calendar days. To understand whether dividend omissions have any impact on my estimates, I run robustness checks consi dering only cases for which there is no disruption, that is, cases where the announcements happen in two consecutive quarters. The results remain qualitatively and quantitatively unaltered and are available upon request.
4 As pointed out by an anonymous referee, the number of days before an announcement cannot be determined before the announcement date,
when the amount of the DPS becomes known. Therefore, it can be argued that Xit is not exactly a predictor of dividend changes. However, in
case of announcements that occur after the usual announcement date, investors can use the informational content of a delayed announcement
before they actually know the amount of the dividend. For example, if an announcement should occur around 90 days after the last one, and for
the current quarter an announcement has yet to be released 100 days after the previous one, investors can use this piece of information to
predict the amount of the dividend for the current quarter. In particular, the findings of this paper suggest that, if the announcement date occurs
6
DeAngelo, DeAngelo, and Stulz (2006) introduce the stage of the life cycle of a firm as a key factor for the decision to pay dividends. Recent literature points out that dividend smoothing (the tendency to avoid changes in the DPS) can be affected by information asymmetries.5 Such information
asymmetries are lower for firms that are bigger, older, with a high degree of asset tangibility and investment opportunities (Leary and Michaely (2011)). In light of this literature, the vector Cit consists
of the following variables:6 Firm age (the number of years since the firm first appeared in the
COMPUSTAT database); Profitability, proxied by the ratio of Earnings Before Interest, Taxes, Depreciation and Amortization (EBITDA) to total assets; size, as proxied by the market value of assets (Market cap) and the book value of assets (Total assets);7 asset tangibility, proxied by the ratio of
property, plant and equipment to total assets (Tangibility); the market-to-book ratio (MA/BA), which proxies for investment opportunities; the standard deviation of Profitability (Earnings volatility) and the Beta, which proxy for risk; and the Speed of Adjustment (SOA).8
For all regressions standard errors are clustered on the firm level and robust to heteroscedasticity, and year fixed effects are included. Data availability for the control variables requires the sample period to be from 1971 onwards. Because data for the beta is available from 1993 onwards, the results for the regressions where Beta is included consider the sample period 1993-2014.
III. Results
In Table 1, Panel A, I report the results for Probit regressions where the dependent variables are the dummy variables “Dividend increase” and “Dividend decrease”, as described in the previous section. In Panel B I report the values of the median, 25th and 75th percentile of all explanatory variables. The
5 Information asymmetries can be decreased by paying dividends, because they signal to the market of the value of the firm (Bhattacharya (1979);
John and Williams (1985); Miller and Rock (1985)).
6The related items from the COMPUSTAT database are as follows (Leary and Michaely (2011)): Book value of equity (BA) is equal to Total
assets (item #6) minus book liabilities (#181) minus preferred stock (#10, or #56 if 10# is missing, and #130 if both #10 and #56 is missing)
plus deferred taxes (#35). Asset tangibility is the ratio of property plant and equipment (#8) and Total assets. The market value of equity
(Market value) is the product of #24 and #25. Retained earnings, used to compute (RE/TE and RE/TA) is the item #259. MA/BA is computed as:
(Market value + Total assets – BA)/Total Assets.Operating income before depreciation is item #13, often referred to as EBITDA. Finally, as
said above, Firm age is the number of years since the firm first appeared in the COMPUSTAT database. To allow for the long sample period,
Earnings volatility is computed on an annual basis.
7 In multivariate regressions, consistent with previous literature, I employ the natural log of Market value and Total assets as a proxy for size.
7
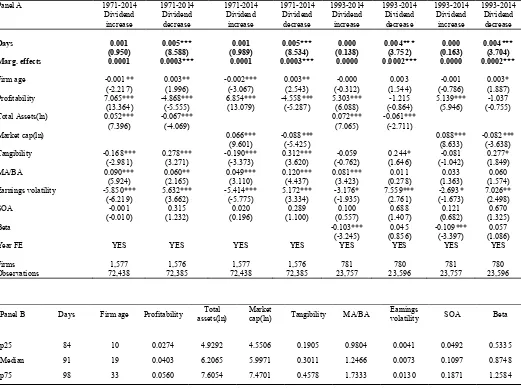
median for Days is 91 calendar days, while the 25th and 75th percentile is 84 and 98 calendar days,
respectively.
In all cases, Days does not correlate significantly with “Dividend increase”, but increases the probability of a dividend cut. In particular, considering the results in the third column of Table 1, the marginal effect of Days on the probability of cutting dividends when Days is equal to its sample median (91 days) is 0.0003, suggesting that one standard deviation increase in Days (around 20 calendar days) increases the probability of a dividend decrease by 0.6 percentage points. Since the mean for “Dividend decrease” is 0.0208, this change is hardly negligible (almost 30% of the mean). The marginal effect of Days remains virtually the same for column 5 of Table 1. For columns 7 and 9 the marginal effect is 0.0002.
An examination of the control variables shows that dividend cuts are more likely for firms that are, ceteris paribus, older, less profitable, smaller, with more tangible assets, better growth opportunities, and with higher earnings volatility.
The variation in “Days” can be picking up the variation in number of days-off and holidays, if “Days” is the number of calendar days between announcement dates. To further improve the robustness of my results, I consider the number of trading days between two consecutive
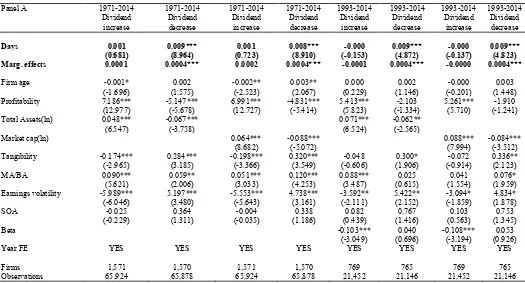
announcements. To define trading days, I consider the business calendar for the S&P500 index. Moreover, as explained in footnote 3, the number of calendar (or trading) days between two announcements can be longer than usual for periods with dividends omissions. Table 2 reports the results for the same regressions as for Table 1, but “Days” is in this case the number of trading days between two consecutive dividend announcements, rather than calendar days. Cases for which there is a disruption in dividend payments are excluded. The median of “Days” is 67 trading days, and the 25th
and 75th percentile are 63 and 72 trading days, respectively. The results remain virtually the same as
for Table 1, in terms of both statistical and economic significance.
8
employed for Table 2, but the dependent variable becomes one only if the change in DPS (positive or negative) is larger than 3%. Moreover, I add the variable “Share repurchases”, to assess the potential impact of share repurchases on dividend changes. The results for the main variable of interest, “Days”, remain substantially unaltered. The coefficient on share repurchases is statistically insignificant or weakly significant.9
Finally, it can be argued using the number of (calendar or trading) days between two consecutive dividend announcements (for example, Q4-2006 and Q1-2007) can lead to noise in the data if firms tend to have a target gap period between announcement dates. If a firm delays by N days the announcement for the current quarter, this automatically reduces the number of days before the announcement for the next quarter. This is represented graphically in Figure 1.
To avoid this problem, I exploit the fact that firms tend to choose the current dividend announcement date on the basis of the dividend announcement date for the same quarter of the previous year (for example, for Q4-2006 and Q4-2007). Therefore, in a further robustness check, rather than the number of trading days between announcement dates, “Days” is the difference between:
- The actual number of trading days between dividend announcement dates for the same quarter of two consecutive years, and
- The number of trading days in a calendar year. For the U.S., the expected number of trading days would be 252.
For cases where there are late announcements, this variable is positive, while for cases with early announcements this variable is negative. The results are reported in Table 4. Similar to the results reported in Table 3, the dependent variable is the probability of an increase/decrease in the DPS by 3% and I also consider the level of share repurchases as independent variable. The results for dividend cuts remain virtually unaltered. The results on dividend increases, unlike for other specifications, suggest
9 In untabulated tests I also exclude observations for which there are share repurchases concomitant with dividend changes. The results remain
virtually unaltered. However, when I consider only observations for which there are share repurchases concomitant with dividend changes, the
9
that positive news tend to be released early. The magnitude of the marginal effects of “Days” on “Dividend increase” are around 2.5-4 times larger than the marginal effects of “Days” on “Dividend decrease”. 10
IV. Conclusions
This paper examines predictability in dividend cuts for a large sample of U.S. firms for the period 1971-2014. I provide evidence that delaying the dividend announcement is associated with dividend cuts, while dividend increases tend be announced early, suggesting that managers delay the release of bad news.
References
Aharony, J. and I. Swary, 1980, Quarterly dividend and earnings announcements and stockholders’ returns: An empirical analysis, Journal of Finance35, 1–12.
Asquith, P. and W. Mullins, Jr., 1983, The impact of initiating dividend payments on shareholder’s wealth, Journal of Business56, 77–96.
Bhattacharya, S., 1979, Imperfect information, dividend policy, and “The bird in the hand” fallacy,
Bell Journal of economics10, 59–270;
Brickely. J.A., 1983, Shareholders wealth, information signalling and the specially designated dividend: An empirical study, Journal of Financial Economics12, 187–209.
Charest, G., 1978, Dividend information, stock returns and market efficiency II, Journal of Financial Economics6, 297–330.
Damodaran, Aswath, 1989, The weekend effect in information releases: A study of earnings and announcements, Review of Financial Studies2, 607–623.
10 In unreported results, similar to what I have done for footnote 9, I exclude observations for which there are share repurchases in the same
quarter as dividend changes. The results remain virtually the same as for Table 4. However, when I consider only observations for which there
10
DeAngelo, H., DeAngelo, L. and D. J. Skinner, 2004, Are dividends disappearing? Dividend concentration and the consolidation of earnings, Journal of Financial Economics72, 425–456.
DeAngelo, H., DeAngelo, L. and R. M. Stulz, 2006, Dividend policy and the earned/contributed capital mix: a test of the life-cycle theory, Journal of Financial Economics81, 227–254.
DellaVigna, S., and J. M. Pollet, 2009, Investor Inattention and Friday Earnings Announcements,
Journal of Finance64, 709–749.
Denis, D. J. and I. Osobov, 2008, Why do firms pay dividends? International evidence on the determinants of dividend policy’, Journal of Financial Economics89, 62–82.
Fama, E., L. Fisher, M. Jensen and R. Roll, 1969, The adjustment of stock prices to new information,
International Economic Review10, 1–21.
Fama, E. F., and K. R. French, 2001, Disappearing dividends: changing firm characteristics or lower propensity to pay?, Journal of Financial Economics60, 3–43.
Hull T. J., 2013, Does the timing of dividend reductions signal value? Empirical evidence, Journal of Corporate Finance22, 193–208.
Hull T. J., 2015, How the timing of dividend reductions can signal value, Journal of Corporate Finance30, 114–131.
Javakhadze, D., S. P. Ferris, and N. Sen, 2014, An international analysis of dividend smoothing,
Journal of Corporate Finance29, 200–220.
John, K., and J. Williams, 1985, Dividends, dilution, and taxes: a signaling equilibrium, Journal of Finance40, 1053–1070.
Kalay, A., and U. Loewenstein, 1986, The informational content of the timing of dividend announcements, Journal of Financial Economics 16, 373–388.
Knyazeva, A., and D. Knyazeva, 2014, Dividend smoothing: An agency explanation and new evidence, Mimeo.
Leary, M. T., and R. Michaely, 2011, Determinants of Dividend Smoothing: Empirical Evidence, Review of Financial Studies 24, 3197–3249.
Lintner ,J. 1956, Distribution of incomes of corporations among dividends, retained earnings and taxes, American Economic Review46, 97–113.
Michaely, R., and M. Roberts, 2006, Dividend Smoothing, Agency Costs, and Information Asymmetry: Lessons from the Dividend Policies of Private Firms, Working Paper, Cornell University.
Miller M., and K. Rock, 1985, Dividend policy under asymmetric information, Journal of Finance
11
Pettit. R., 1972, Dividend announcements, security performance and capital market efficiency,
Journal of Finance27, 993–1008.
12
Table 1. Number of calendar days between dividend announcements and changes in dividends.
The sample includes NYSE, NYSE MKT, and NASDAQ securities with share codes of 10 or 11 and distribution code 1232. I exclude utilities (SIC codes 4900-4949) and financial firms (SIC codes 6000-6999). “Days” is the number of trading days between two consecutive dividend announcement dates for a certain firm. “Dividend increase” and “Dividend decrease” are dummy variables equal to one if the dividend per share in a certain quarter for a certain firm is larger than, or smaller than, the dividend per share in the previous quarter, respectively. “Marg. effects” is the marginal effect for the variable “Days”, where “Days” is set equal to its median. All
variables are winsorized at the 1st and 99th percentile. Constant not reported but estimated for all regressions. Robust t-statistics clustered
at the firm level in parentheses. *** denotes p<0.01, ** denotes p<0.05, and * denotes p<0.1.
Panel A 1971-2014 1971-2014 1971-2014 1971-2014 1993-2014 1993-2014 1993-2014 1993-2014
Dividend increase Dividend decrease Dividend increase Dividend decrease Dividend increase Dividend decrease Dividend increase Dividend decrease
Days 0.001 0.005*** 0.001 0.005*** 0.000 0.004*** 0.000 0.004***
(0.950) (8.588) (0.989) (8.534) (0.138) (3.752) (0.163) (3.704)
Marg. effects 0.0001 0.0003*** 0.0001 0.0003*** 0.0000 0.0002*** 0.0000 0.0002***
Firm age -0.001** 0.003** -0.002*** 0.003** -0.000 0.003 -0.001 0.003*
(-2.217) (1.996) (-3.067) (2.543) (-0.312) (1.544) (-0.786) (1.887)
Profitability 7.065*** -4.868*** 6.854*** -4.558*** 5.303*** -1.215 5.139*** -1.037
(13.364) (-5.555) (13.079) (-5.287) (6.088) (-0.864) (5.946) (-0.755)
Total Assets(ln) 0.052*** -0.067*** 0.072*** -0.061***
(7.396) (-4.069) (7.065) (-2.711)
Market cap(ln) 0.066*** -0.088*** 0.088*** -0.082***
(9.601) (-5.425) (8.633) (-3.638)
Tangibility -0.168*** 0.278*** -0.190*** 0.312*** -0.059 0.244* -0.081 0.277*
(-2.981) (3.271) (-3.373) (3.620) (-0.762) (1.646) (-1.042) (1.849)
MA/BA 0.090*** 0.060** 0.049*** 0.120*** 0.081*** 0.011 0.033 0.060
(5.924) (2.165) (3.110) (4.437) (3.423) (0.278) (1.363) (1.574)
Earnings volatility -5.850*** 5.632*** -5.414*** 5.172*** -3.176* 7.559*** -2.693* 7.026**
(-6.219) (3.662) (-5.775) (3.334) (-1.935) (2.761) (-1.673) (2.498)
SOA -0.001 0.315 0.020 0.289 0.100 0.688 0.121 0.670
(-0.010) (1.232) (0.196) (1.100) (0.557) (1.407) (0.682) (1.325)
Beta -0.103*** 0.045 -0.109*** 0.057
(-3.245) (0.856) (-3.397) (1.086)
Year FE YES YES YES YES YES YES YES YES
Firms 1,577 1,576 1,577 1,576 781 780 781 780
Observations 72,438 72,385 72,438 72,385 23,757 23,596 23,757 23,596
Panel B Days Firm age Profitability assets(ln) Total Market cap(ln) Tangibility MA/BA volatility Earnings SOA Beta
p25 84 10 0.0274 4.9292 4.5506 0.1905 0.9804 0.0041 0.0492 0.5335
Median 91 19 0.0403 6.2065 5.9971 0.3011 1.2466 0.0073 0.1097 0.8748
13
Table 2. Number of trading days between dividend announcements and changes in dividends.
The sample includes NYSE, NYSE MKT, and NASDAQ securities with share codes of 10 or 11 and distribution code 1232. I exclude utilities (SIC codes 4900-4949) and financial firms (SIC codes 6000-6999). “Days” is the number of calendar days between two consecutive dividend announcement dates for a certain firm. “Dividend increase” and “Dividend decrease” are dummy variables equal to one if the dividend per share in a certain quarter for a certain firm is larger than, or smaller than, the dividend per share in the previous quarter, respectively. “Marg. effects” is the marginal effect for the variable “Days”, where “Days” is set equal to its median. All
variables are winsorized at the 1st and 99th percentile. Constant not reported but estimated for all regressions. Robust t-statistics clustered
at the firm level in parentheses. *** denotes p<0.01, ** denotes p<0.05, and * denotes p<0.1.
Panel A 1971-2014 1971-2014 1971-2014 1971-2014 1993-2014 1993-2014 1993-2014 1993-2014
Dividend increase Dividend decrease Dividend increase Dividend decrease Dividend increase Dividend decrease Dividend increase Dividend decrease
Days 0.001 0.009*** 0.001 0.008*** -0.000 0.009*** -0.000 0.009***
(0.681) (8.964) (0.723) (8.910) (-0.153) (4.872) (-0.137) (4.823)
Marg. effects 0.0001 0.0004*** 0.0002 0.0004*** -0.0001 0.0004*** -0.0000 0.0004***
Firm age -0.001* 0.002 -0.002** 0.003** 0.000 0.002 -0.000 0.003
(-1.696) (1.575) (-2.523) (2.067) (0.229) (1.146) (-0.201) (1.448)
Profitability 7.186*** -5.147*** 6.991*** -4.831*** 5.413*** -2.103 5.261*** -1.910
(12.977) (-5.678) (12.727) (-5.414) (5.823) (-1.334) (5.710) (-1.241)
Total Assets(ln) 0.048*** -0.067*** 0.071*** -0.062**
(6.547) (-3.758) (6.524) (-2.565)
Market cap(ln) 0.064*** -0.088*** 0.088*** -0.084***
(8.682) (-5.072) (7.994) (-3.512)
Tangibility -0.174*** 0.284*** -0.198*** 0.320*** -0.048 0.300* -0.072 0.336**
(-2.965) (3.185) (-3.366) (3.549) (-0.606) (1.906) (-0.914) (2.123)
MA/BA 0.090*** 0.059** 0.051*** 0.120*** 0.088*** 0.025 0.041 0.076*
(5.621) (2.006) (3.033) (4.253) (3.487) (0.615) (1.554) (1.959)
Earnings volatility -5.989*** 5.197*** -5.553*** 4.738*** -3.592** 5.422** -3.094* 4.834*
(-6.046) (3.480) (-5.643) (3.161) (-2.111) (2.152) (-1.859) (1.878)
SOA -0.025 0.364 -0.004 0.338 0.082 0.767 0.103 0.753
(-0.229) (1.311) (-0.035) (1.186) (0.439) (1.416) (0.563) (1.345)
Beta -0.103*** 0.040 -0.108*** 0.053
(-3.049) (0.696) (-3.194) (0.926)
Year FE YES YES YES YES YES YES YES YES
Firms 1,571 1,570 1,571 1,570 769 765 769 765
14
Table 3. Number of trading days between dividend announcements and changes in dividends: changes in DPS larger than 3%.
The sample includes NYSE, NYSE MKT, and NASDAQ securities with share codes of 10 or 11 and distribution code 1232. I exclude utilities (SIC codes 4900-4949) and financial firms (SIC codes 6000-6999). “Days” is the number of calendar days between two consecutive dividend announcement dates for a certain firm. “Dividend increase” and “Dividend decrease” are dummy variables equal to one if there is an increase or decrease by at least 3% in the DPS in a certain quarter for a certain firm. “Marg. effects” is the marginal effect for the variable “Days”, where “Days” is set equal to its median. “Share repurchases” is the level of share repurchases. All
variables are winsorized at the 1st and 99th percentile. Constant not reported but estimated for all regressions. Robust t-statistics clustered
at the firm level in parentheses. *** denotes p<0.01, ** denotes p<0.05, and * denotes p<0.1.
1971-2014 1971-2014 1971-2014 1971-2014 1993-2014 1993-2014 1993-2014 1993-2014
Dividend increase (>3%) Dividend decrease (<–3%) Dividend increase (>3%) Dividend decrease (<–3%) Dividend increase (>3%) Dividend decrease (<–3%) Dividend increase (>3%) Dividend decrease (<–3%)
Days 0.000 0.009*** 0.000 0.009*** 0.000 0.008*** 0.000 0.008***
(0.456) (8.770) (0.487) (8.709) (0.056) (4.406) (0.064) (4.338)
Marg. Effects 0.0001 0.0003*** 0.0001 0.0003*** 0.0000 0.0003*** 0.0000 0.0003***
Firm age -0.001** 0.004** -0.002*** 0.005*** -0.000 0.004** -0.001 0.005**
(-1.967) (2.367) (-2.800) (2.947) (-0.299) (2.138) (-0.735) (2.452)
Profitability 7.418*** -6.004*** 7.230*** -5.704*** 5.589*** -1.680 5.461*** -1.479
(13.433) (-5.374) (13.212) (-5.178) (6.285) (-1.007) (6.208) (-0.909)
Total Assets(ln) 0.047*** -0.065*** 0.067*** -0.062**
(6.415) (-3.000) (6.095) (-2.066)
Market cap(ln) 0.063*** -0.094*** 0.085*** -0.092***
(8.637) (-4.537) (7.707) (-3.123)
Tangibility -0.191*** 0.341*** -0.216*** 0.393*** -0.011 0.315* -0.036 0.360**
(-3.463) (3.362) (-3.900) (3.818) (-0.131) (1.899) (-0.442) (2.149)
MA/BA 0.080*** 0.004 0.041*** 0.074** 0.085*** -0.010 0.039* 0.046
(5.504) (0.103) (2.750) (1.979) (4.069) (-0.199) (1.852) (1.066)
Earnings volatility -5.948*** 7.898*** -5.490*** 7.303*** -3.524** 7.853*** -3.007* 7.163***
(-5.935) (4.586) (-5.531) (4.230) (-2.094) (3.054) (-1.830) (2.728)
SOA 0.000 0.574* 0.023 0.544* 0.109 0.965* 0.133 0.949*
(0.000) (1.861) (0.230) (1.716) (0.623) (1.802) (0.771) (1.703)
Beta -0.105*** 0.046 -0.112*** 0.065
(-3.148) (0.719) (-3.349) (1.037)
Share repurchases 0.000 -0.000 0.000 -0.000 -0.000 -0.000 -0.000* -0.000
(0.909) (-1.570) (0.300) (-1.241) (-0.974) (-1.274) (-1.774) (-1.008)
Year FE YES YES YES YES YES YES YES YES
Firms 1,565 1,564 1,565 1,564 765 761 765 761
[image:14.612.49.568.192.500.2]15
Table 4. Deviations from expected trading days between announcements and changes in dividends.
The sample includes NYSE, NYSE MKT, and NASDAQ securities with share codes of 10 or 11 and distribution code 1232. I exclude utilities (SIC codes 4900-4949) and financial firms (SIC codes 6000-6999). “Days” is defined as the difference between: the number of trading days between two announcements for the same quarter of two consecutive years (e.g., Q4-2006 and Q4-2007); and the number of trading days in a year (252). “Dividend increase” and “Dividend decrease” are dummy variables equal to one if there is an increase or decrease by at least 3% in the dividend per share in a certain quarter for a certain firm. “Marg. effects” is the marginal effect for the variable “Days”, where “Days” is set equal to its median. “Share repurchases” is the level of share repurchases. All variables are
winsorized at the 1st and 99th percentile. Constant not reported but estimated for all regressions. Robust t-statistics clustered at the firm
level in parentheses. *** denotes p<0.01, ** denotes p<0.05, and * denotes p<0.1.
1971-2014 1971-2014 1971-2014 1971-2014 1993-2014 1993-2014 1993-2014 1993-2014
Dividend increase (>3%) Dividend decrease (<–3%) Dividend increase (>3%) Dividend decrease (<–3%) Dividend increase (>3%) Dividend decrease (<–3%) Dividend increase (>3%) Dividend decrease (<–3%)
Days -0.004*** 0.011*** -0.004*** 0.011*** -0.005*** 0.009** -0.005*** 0.009**
(-4.584) (5.155) (-4.477) (5.062) (-2.948) (2.308) (-2.909) (2.288)
Marg. Effects -0.0010*** 0.0004*** -0.0010*** 0.0004*** -0.0012** 0.0003** -0.0011** 0.0003**
Firm age -0.001** 0.004** -0.002*** 0.005*** -0.001 0.003 -0.001 0.003
(-2.243) (2.355) (-3.110) (2.884) (-0.624) (1.427) (-1.069) (1.642)
Profitability 7.594*** -6.695*** 7.393*** -6.384*** 5.533*** -2.926* 5.392*** -2.731
(12.780) (-5.770) (12.542) (-5.598) (5.775) (-1.646) (5.689) (-1.577)
Total Assets(ln) 0.051*** -0.068*** 0.072*** -0.070**
(6.597) (-3.064) (6.257) (-2.365)
Market cap(ln) 0.068*** -0.095*** 0.091*** -0.094***
(8.852) (-4.453) (7.860) (-3.255)
Tangibility -0.185*** 0.360*** -0.212*** 0.406*** -0.014 0.453*** -0.040 0.488***
(-3.216) (3.369) (-3.659) (3.724) (-0.174) (2.653) (-0.483) (2.831)
MA/BA 0.081*** 0.040 0.040** 0.109*** 0.090*** 0.047 0.041* 0.102***
(5.270) (1.003) (2.519) (3.076) (4.024) (1.116) (1.836) (2.796)
Earnings volatility -6.368*** 7.254*** -5.867*** 6.761*** -4.608*** 6.403** -4.027** 5.858**
(-5.895) (3.706) (-5.469) (3.461) (-2.580) (2.445) (-2.301) (2.206)
SOA -0.036 0.558* -0.013 0.531* 0.092 1.135** 0.116 1.126**
(-0.352) (1.844) (-0.125) (1.714) (0.510) (2.065) (0.650) (1.979)
Beta -0.111*** 0.065 -0.118*** 0.079
(-3.227) (0.993) (-3.397) (1.215)
Share repurchases 0.000 -0.000 -0.000 -0.000 -0.000 -0.000 -0.000** -0.000
(0.304) (-1.264) (-0.364) (-1.008) (-1.468) (-0.904) (-2.053) (-0.726)
Year FE YES YES YES YES YES YES YES YES
Firms 1,540 1,539 1,540 1,539 741 736 741 736
16
Figure 1. Number of days between announcements and delayed announcements.
a) N1 = T2 – T1 = N2 = T3 – T2
T1 T2 T3
b) N1 = T2 – T1 > N2 = T3 – T2
T1 T2 T3