Predictive Intelligence for a Rail Traffic
Management System
Simon Roberts,Nottingham Geospatial Institute, University of Nottingham, UK Lukasz Bonenberg,Nottingham Geospatial Institute, University of Nottingham, UK
Xiaolin Meng,Nottingham Geospatial Institute, University of Nottingham, UK Terry Moore,Nottingham Geospatial Institute, University of Nottingham, UK
Chris Hill,Nottingham Geospatial Institute, University of Nottingham, UK
BIOGRAPHIES
Dr Simon Roberts work combines geospatial analysis and modelling, the development of geospatial databases, information systems design, and interactions of any system with a geospatial aspect. He is currently involved in the development dynamic mapping for predictive contextual intelligence for intelligent future transport.
Dr Lukasz Bonenberg is a Senior Experimental Officer at University of Nottingham, focusing on GNSS, low-cost navigation and sensor fusion.
Dr Xiaolin Meng is an associate professor at the NGI, is the Course Director for MSc PNT, UK Director of Sino-UK Geospatial Engineering Centre, Faculty of Engineering.
Professor Terry Moore is the director of the NGI at the University of Nottingham; where he is the professor of Satellite Navigation. He has 30 years of research experience in surveying, positioning, and navigation technologies. He is a member of Council and a fellow of the Royal Institute of Navigation.
Dr Chris Hill is an associate professor at the NGI. He has a PhD from the University of Nottingham on the subject of Satellite Laser Ranging, and has worked on a variety of GPS and GNSS research projects over the last 20 years. He is a fellow of the RIN. ABSTRACT
As the demands on terrestrial transport systems increase, there is a growing need for greater efficiencies. More intelligent mobility and ultimately autonomous transport assets will deliver these efficiencies through the evolution of cooperative intelligent transport system (C-ITS) technology. Central to this evolution will be the capability to accurately and precisely position assets within their environment and relative to each other to predefined and regulated standards.
The core of modern positioning and navigation methods are the global navigation satellite systems (GNSS) (e.g. GPS, Galileo, GLONASS and BeiDou). These systems rely on line of sight radio frequency signals, which are vulnerable to obstruction and/or interference (e.g. multipath and/or non-line of sight reception). As a result, the position accuracy is degraded and therefore GNSS would greatly benefit froma prioriintelligence that predicts where and when obscuration or interference will occur. Similarly, a real time assessment of where and when GNSS signal reception will be restored and the location of the satellites in the sky will aid in restoring satellite lock. This paper describes a computer vision system that utilises 360oimages to derive a prioriintelligence to predict changes in the environment that may threaten position and navigation integrity.
INTRODUCTION
Traditionally, train operations are conducted by mechanical and electro-mechanical safety systems or, in some other cases in which there are no safety systems and the signalling is based on human decision, by telephone block operation or visual evaluation of train positioning. Within the ERTMS, the train positioning function is performed by the odometer system, which provides the distance travelled in respect to the last balise reference group which is used to reset the confidence error cumulated by the odometer with the travelled distance. The evolution of ERTMS has foreseen the adoption of GNSS (Global Navigation Satellite System) technology to improve the self-capability of a train in the definition of its own position, without support from the track side automatic train control (ATC) system. The adoption of GNSS offers the possibility of reducing/eliminating the balises along the tracks and replacing them with the virtual balise functionality for minimising the impacts at system level [3]. This will lead to many operational benefits [4] including:
A reducing the safety distance and tolerances by means of more accurate positioning;
An improvement in the availability of odometric sensors;
A reduction in the problems faced by traditional systems when running at high speeds;
A reduction in the overall cost of railway control systems and improvements in safety.
GNSS are a cornerstone of modern position, navigation and timing (PNT) technologies; however, current, modernised and future GNSS (i.e. GPS, GLONASS, Galileo, BeiDou, etc.) all suffer from the same lack of resilience and vulnerabilities to interference that are well documented in the literature [e.g. 5]. Various strategies exist for the mitigation of inaccuracies in positioning resulting from clock and ephemeris errors, ionospheric and atmospheric effects, code phase synchronisation and ambiguity resolution of the carrier phase signals etc. These include the real-time kinematic (RTK) and precise point positioning (PPP) algorithms, satellite and ground based augmentation systems (SBAS and GBAS), receiver autonomous integrity monitoring (RAIM) and its variants (e.g. Advanced-RAIM [A-RAIM], Carrier-Phase RAIM [C-RAIM]). In addition, receiver design, configuration and signal processing techniques all have a direct impact on positioning accuracy, with high-end survey grade receivers, in combination with the mitigation strategies mentioned, are capable of sub-centimetre accuracy.
However, even the most advanced receivers and processing algorithms cannot overcome the limitations to GNSS arising from obscuration of the line-of-sight (LOS) signal, reception of non-line-of-sight (NLOS) signals and reception of reflected or multipath signals. For these reasons, techniques such as the integration of information from other sensors (e.g. LiDAR, RADAR, inertial measurement units [IMUs], odometers and vision systems) through techniques including Kalman filtering and map matching and image recognition are used to augment GNSS positioning or to replace it in GNSS denied areas.
Given that the availability and quality of GNSS positioning is largely a function of the environment in immediate vicinity to a receiver that will block or reflect GNSS signals, a priori intelligence capable of predicting GNSS outages and reception of NLOS signals, areas of high multipath and loss of connectivity for RTK/PPP corrections would significantly aid in positioning using an integrated system of sensors. Similarly, such a priori intelligence can inform of the length of time such a sensor system must be relied upon and could also be used to assess the reliability of GNSS positioning while it is available.
This paper describes a system, which utilises 360oimages to derive a priori intelligence to predict changes in the environment that may threaten position and navigation integrity (e.g. GNSS outages and multipath effects). The system makes use of real world data collected by the Nottingham Geospatial Institute (NGI) and simulation studies using the Institute’s Spirent GSS8000 multi-GNSS simulator.,
METHODS
The GNSS and IMU data are post-processed using Novatel Inertial Explorer to provide the baseline accuracy measures and an assessment of the quality of the solution made . The image data are incorporated into a database and processed to extract the percentage of sky in clear view (skyview) in each scene. The processing algorithms are described in the following sections. Derivation of skyview percentage and elevation masks
A major obstacle to deriving information relating to the driving environment is the necessity to undertake some form of survey, either from the air or on the ground. In the UK aerial LiDAR (Light detecting and ranging) surveys that have been undertaken by the Environment Agency in England and Wales and in Scottland by Scottish Government, SEPA and Scottish Water are now freely available as part of the Government’s Open Data initiative.
However, the LiDAR data have two drawbacks: firstly the coverages are incomplete as the data are primarily acquired for flood management purposes. Secondly, the data are available at 2m, 1m, 0.5m and 0.25m spatial resolution as digital surface models (DSMs) (i.e. 3d representations of the Earth’s surface including features such as buildings and trees etc.) and digital terrain models (DTMs) (i.e. 3d representations of the Earth’s surface with features removed). The different resolutions result in edge effects that introduce artefacts into the data that result in uncertainty as the exact height of buildings and the distance from an observer’s position on the ground to a point at which a feature blocks out a view of the sky. As a consequence, there is uncertainty in the elevation angle derived from DSMs of different resolutions (Figure 1).
A second method explored for deriving skyview and elevation masks is via 360ophotography. The advantage of this technique is that acquisition of the 360o imagery has already been undertaken for large parts of the world as part of Google’s Street View programme. Each Street View scene is identified by a unique ‘PanoID’ that contains, among other things, information relating to the latitude/longitude of the scene’s location, the direction of travel of the Google Street View survey vehicle, and the vehicle’s orientation (roll, pitch and yaw).
For the purpose of deriving skyview and elevation masks, the NGI has developed a JavaScript web crawler that originates at a specified latitude/longitude on Google Maps and then spreads out from that point collecting each adjacent Street View scene’s ID, the lat/long coordinates and heading along with the actual image data for that
scene (Figure 2). The 360oimages are then processed to derive an estimation of the skyview percentage contained in each image in the steps shown in Figure 3 as follows:
a. Removal of imagery below the horizon and adjustment to account for lever arm offset of the camera; b. Edge detection using the Canny edge detector, a multi-stage algorithm, with the following steps:
1. Noise reduction: since edge detection is susceptible to noise in the image, the first step is to remove the noise with a 5 × 5 Gaussian filter.
2. Find the intensity gradient of the image: the smoothed image is then filtered with a Sobel kernel in both the horizontal and vertical directions to produce the first derivative in the horizontal (Gx) and vertical (Gy) directions. From these two images, it is possible to find the edge gradient and direction for each pixel as follows:
(1) where G is the edge gradient
(2) where is the gradient direction.
The gradient direction is always perpendicular to the edges. It is rounded to one of four angles representing vertical, horizontal and two diagonal directions. For the proposed system, the gradient direction is in the vertical direction.
3. Non-maximum suppression: after deriving the gradient magnitude and direction, a full scan of the image is performed to remove any unwanted pixels which may not constitute an edge. For this, each pixel is compared to the local maximum in its neighbourhood in the gradient direction.
c. Convert to binary and fill holes in image by changing connected background pixels (0s) to foreground pixels (1s), stopping when it reaches object boundaries.
d. Polar coordinate transformation where Cartesian (x, y) in image space is transformed to Polar (r, θ) as follows:
[image:3.595.295.551.181.347.2](3)
e. Rotation and orientation so that north is at 0o in the polar coordinate image and calculation of the skyview percentage in each image (derived from the heading information contained in Street View PanoID);
f. Segmentation of the image into 5o of azimuth and derivation of elevation masks for each segment at 5o intervals, in line with the input parameters utilised by the Spirent GSS8000 multi-GNSS simulator.
g. The segmented images then undergo a reverse polar coordinate transformation to Cartesian (x, y) image space and saved as an 18 × 72 cell ASCII file, with values of 1 representing open sky and 0 areas where the sky is obscured. For ground truthing purpose and to verify the procedures outlined further in this paper, the NGI collected 360o imagery for selected locations using an nctech iSTAR imaging system.
Construction of Spatial Database and Dynamic Mapping System
In the first instance, the skyview percentage for the location of each Street View image, the number of visible GPS satellites are incorporated into the spatial database. The integration process utilises the QGIS open source geographical information system software that interfaces with the OpenGeo Suite1, which includes GeoServer, PostGIS, GeoWebCache and GeoExplorer functionalities. These provide a spatially enabled object-relational database, a software server for loading and sharing geospatial data, a tile cache server that accelerates the serving of maps and a web application for composing, styling, and
[image:4.595.71.527.83.492.2]1For a description of the OpenGeo suite seehttp://suite.opengeo.org/docs/latest/intro/whatis.html
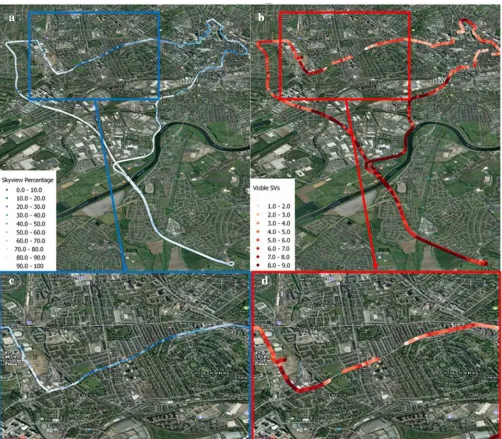
publishing maps. This allows visualisation of ‘hotspots’ in terms of areas with high / low skyview obscuration, processed GNSS quality and the number of visible satellites as shown in Figure 4.
The final component of the SQL database are 18 × 72 cell worksheets containing the GPS satellites’ PRN identifier and associated azimuth/elevation look angles (segmented at 5ointervals as per the elevation mask files). Matlab code for deriving look angles from RINEX navigation files are provided as part of GPS EASY Suite II available from [6], with alternate procedures for deriving a satellite’s azimuth and elevation angles outlined in [7] and [8], which provide the Local Sidereal Time (LST) at the time of the GNSS survey and the look angles respectively. Satellite azimuths and elevations are calculated from information extracted from the Two-Line Element Set (TLES) describing the satellites’ orbits, available at www.celestrak.com. The TLES data contain the following information required for deriving each satellite’s angle of azimuth and elevation at a given point in time:
Epoch Test Time: i.e. the time at which the orbital elements were taken. The epoch test time is important because the orbital elements provided by the TLES change over time;
Right Ascension of Ascending Node: i.e. the longitude of the point at which the orbit crosses the equatorial plane moving south to north;
Argument of Perigee: i.e. the angle, in the plane of the satellite’s orbit, between the ascending node and the orbit’s closest point to the earth (point of periapsis), measured in the direction of the satellite’s motion;
Inclination: i.e. the angle between the earth’s polar axis and an orthogonal line to the satellite’s orbital plane;
Mean Anomaly: i.e. the position (in degrees) of a satellite in orbit;
Mean Motion, n: the number of times, per day, that the satellite completes one revolution around the earth. Within each worksheet for satellite look angles, a cell with a value represents a satellite’s position in the sky (Figure 5). For the purpose of this experiment, satellite look angles were calculated for 30 minute intervals and for one location centred in central Nottingham. With regard to the look angles, comparisons were made between azimuths and elevations for two locations ~112km (70 miles apart) – roughly the maximum distance a vehicle would travel in one hour on the UK’s motorway network and for the same location at a one hour interval. The effects of location and time on satellite look angles are shown to more critical due to time difference rather than in a change of location as shown in Table 1.
a b
d e f
[image:5.595.56.542.82.341.2]c
Within the SQL database, the worksheets for the satellite azimuths and elevations are compared to those containing the ASCII obscuration maps derived from the Google Street View
imagery. The output from the SQL query is a table that is attached via the PanoID to that scene’s latitude/longitude coordinates for incorporation in the GeoServer web mapping functionality. The structure of the table columns is as follows:
• Lat, Lon, PanoID, Visible PRNs, Elevation, Azimuth, Obscured PRNs, Elevation, Azimuth.
A graphical representation of the detection of visible and obscured SQL database output and GPS satellites is shown in Figure 6 and Figure 7.
[image:6.595.47.549.86.525.2]Within the GeoServer GIS database, the output points from the SQL query are classified as points with ≤4 GPS
Table 1 - Comparison of satellite look angles (degrees) for same location at one hour intervals (light grey) and for different locations at one hour intervals (dark grey)
Diff. 8.00 – 9.00
Diff. 9.00 – 10.00
Diff. Lat/Lon 8.00
Diff. Lat/Lon 9.00
Diff. Lat/Lon 10.00
Az El Az El Az El Az El Az El
-3 +25 -41 +15 -1 0 +1 0 +1 +1
-34 -8 -21 -20 0 0 0 +1 0 +1
-26 -19 --- --- 0 +1 -1 +1 ---
----199 -9 +22 -24 +7 +1 -3 -1 -2 0
-4 +30 -98 +13 -1 +1 -2 +1 -5 -1
+5 -26 --- --- -1 +1 -2 -1 ---
---+17 +12 --- --- -1 -1 -1 0 ---
----69 -15 --- --- -1 0 --- --- ---
----135 -29 --- --- -1 0 --- --- ---
--- --- +285 +32 --- --- --- --- 0 0 Figure 4 - Maps of (a) skyview percentage for the location of each image; (b) number of visible satellites; (c) detailed scene of skyview percentage; and (d) detailed view of number of visible satellites
a
b
satellites predicted to be visible at a particular point and at a particular time and those with >4 satellites predicted to be visible. Those points classified as ≤4 GPS satellites predicted to be visible are separated from the database and their vicinities are joined together using a buffer operation in the GIS. This allow a comparison of the predicted number of satellites with the actual number of satellites visible in the GPS data collected on surveys undertaken along the testbed route shown previously in Figure 4. The output from this comparison is shown in Table 2 and Figure 8.
Discussion
The aim of the proposed methodology is to providea priori prediction for the predefined path of GPS satellites on an epoch by epoch basis. To demonstrate this a further comparison has been conducted by calculating satellite visibility for each epoch of the collected dataset. Initial comparison with real data demonstrates that in 80% of collected epochs the satellites’ visibility have been properly identified. In most of the remaining cases, real data had too many visible satellites - those additional satellites are likely to be a multipath signal and do not require further investigation.
In a number of cases, a visible satellite has been recorded by the receiver with a few epochs delay. This might be a combination of the model's spatial and temporal resolution, delay in tracking and processing GNSS data and require further investigation. Initial results indicate that this delay might have a constant component but further research is required. The authors will first use GSS8000 to create the artificial block to specific satellites assessing delay on the receiver end. Then they will re-create skyview at the specific locations, as predicted by the SQL database, to verify if the delay is constant. This will be compared with the real world dataset.
The proposed SQL database can be extended to include additional information, such as GSM signal strength, a good indication of data quality. This can be used to determine areas of poor connectivity, which will affect RTK/PPP corrections. This significantly aids in a priori intelligence about positioning quality for an integrated system of sensors, as discussed before. Further Work
[image:7.595.49.547.85.234.2]The algorithm proposed in this paper is using a JavaScript web crawler to extract 360ophotos from Google Street View. This approach has limitations due to the speed of photographs update not able to fully account for the changes in the urban landscape. It is also suffering from the problem of the temporal obstructions, such as large vehicles or scaffolding. This is a two-fold problem: temporal obstruction could be erroneously recorded on the existing dataset (creating false negatives) or exist during data collection (creating false positives).
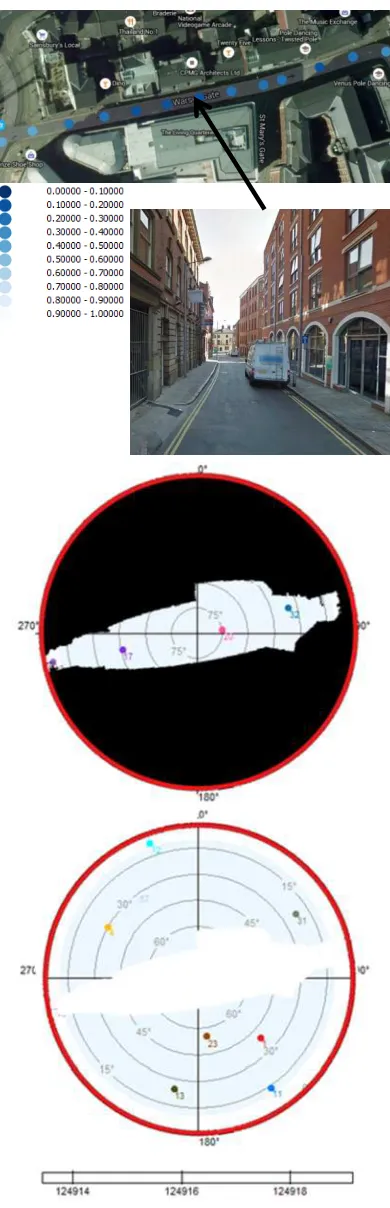
[image:7.595.300.553.265.471.2]Figure 6 - SQL database representation of elevation mask (top), satellite azimuth/elevations (middle) and mask (bottom)
To address this further research will look into the utilisation of 360ostreet view cameras. These are now available of purchase at $300-500 providing high-quality results - photos can be extracted from 24fps live stream video or taken at a 4s interval with a Google specific API. This approach requires not only spatial but also temporal analysis of the obstructions.
This leads to the second problem - size and accessibility of the SQL database. Currently, for simplicity SQL provides obstruction information collected at the 1s interval) with large spatial sparsity (data is only provided for the predefined roads). Further data collection would increase the database size and greatly increase access time. This problem has been described and addressed in the [9,10]. The authors are intending to compare this solution with spatially aware clusterisation - that is providing a single mask for areas that are co-located and have similar obstruction matrix.
Conclusions
The Google Street View database allows the extraction of elevation masks and skyview for any location where Google has undertaken surveys. This allows predictions of the number of visible satellites to be made with a high degree of certainty (>80% accuracy). As with any vision based system, there are limitations arising from the frame rate at which the images are extracted, with the amount of corresponding features from frame to frame decreasing with the higher velocity at which the survey vehicle is travelling. However, we feel this limitations may be mitigated by focussing the system to acquire lock and extract position solutions from satellites with geometry that reduce dilution of precision. Concentrating on these satellites will automatically remove from the solution, any non-line of sight signals and therefore minimise the multipath effect.
[image:8.595.47.242.83.687.2]More investigations are required to determine if the lag in re-acquiring satellite lock is a systematic effect and can therefore be predicted and mitigated. Similarly, the SQL database will need to be expanded to include elements such as GSM signal strength and/or loss of signal, to take into account the availability of real time kinematic corrections. Also, the database should take into account the availability of fixed solutions, as the
Figure 6 - Example of real-world location and derived skyview map (top), with visible satellites (middle) and obscured satellites (bottom) as presented in Figure 6
Table 2 - Comparison of predicted visible satellites vs. actual visible satellites for Nottingham testbed
Discrepancy (predicted vs. actual) Count Percentage
-9 2 0.094
-8 15 0.710
-7 13 0.616
-6 20 0.947
-5 13 0.616
-4 33 1.563
-3 62 2.938
-2 58 2.748
-1 103 4.881
0 1740 82.46
1 39 1.848
2 6 0.284
3 5 0.236
4 1 0.047
[image:8.595.284.529.544.743.2]information from the best quality solutions may be used to calibrate other sensors (e.g. odometers, IMUs etc.). More precise knowledge of a vehicle’s velocity and its trajectory may then be used to precisely predict loss of signal/reacquisition of signal for more effective navigation solutions.
Acknowledgements
This research was funded by Horizon 2020 as part of the RHINOS (Rail High Integrity Overlay System). REFERENCES
[1] CER (Community of European Railway and Infrastructure Companies ) (2014) The Economic Footprint of Railway Transport in Europe. Brussels, October 2014. Available online at
http://www.cer.be/sites/default/files/publication/The_Economic_Footprint_-_web_-_final_final_30_Sept_0.pdf
[2] Control command and signalling - CCS TSI,http://www.era.europa.eu/Document-Register/Pages/CCS-TSI.aspx
[3] NGTC WP-7 Satellite – Mid Term Conference – Munich 29th October 2015.
http://www.ngtc.eu/ngtc-mid-term-conference-on-going-work-on-converging-the-urban-and-mainline-rail-signalling-systems/
[4] Marradi, L., Galimberti, A., Foglia, L., Zin, A., Pecchioni, C., Doronzo, M., Garcia-Consuegra, E.J.G. and Lekchiri, M., 2012, December. GNSS for enhanced odometry: The GRAIL-2 results. In Satellite Navigation Technologies and European Workshop on GNSS Signals and Signal Processing,(NAVITEC), 2012 6th ESA Workshop on (pp. 1-7). IEEE.
[5] Gerdan, G. P., Coombe, L. J., & Takac, F. (1995). The effects of RF interference, multipath and signal obstruction on the GPS observables. 1995. citeseerx. ist. psu. edu/viewdoc/download.
[6] Kai Bore (2009) The GPS EASY Suite II: A Matlab Companion, [online], available athttp://www.insidegnss.com/node/1372
[accessed August 2017]
[7] Bate, R. R., Mueller, D. D., & White, J. E. (1971). Fundamentals of astrodynamics. Courier Corporation.
[8] Wertz, James R. and Larson, Wiley J. (editors). Space Mission Analysis and Design, Third Edition. Microcosm Press, El Segundo, California, 1999.
[9] P. Nelson, C. Linegar, and P. Newman (2015) “Building, Curating, and Querying Large-scale Data Repositories for Field Robotics Applications,” in International Conference on Field and Service Robotics (FSR), Toronto, ON, Canada’