Run Spot Run: Capturing and Tagging Footage of a Race
by Crowds of Spectators
Martin D Flintham, Raphael Velt, Max L Wilson, Edward J Anstead, Steve Benford,
Anthony Brown, Timothy Pearce, Dominic Price, James Sprinks
Mixed Reality Lab, School of Computer Science
University of Nottingham, UK
{martin.flintham, raphael.velt, max.wilson, edward.anstead, steve.benford, anthony.brown,
timothy.pearce, dominic.price, james.sprinks}@nottingham.ac.uk
ABSTRACT
There has been a massive growth in the number of people who film and upload amateur footage of events to services such as Facebook and Youtube, or even stream live to services such as LiveStream. We present an exploratory study that investigates the potential of these spectators in creating footage en masse; in this case, during a live trial at a local marathon. We deployed a prototype app, RunSpotRun, as a technology probe to see what kinds of footage spectators would produce. We present an analysis of this footage in terms of its coverage, quality, and contents, and also discuss the implications for a) spectators enjoying the race, and b) extracting the stories of individual runners throughout the race. We conclude with a discussion of the challenges that remain for deploying such technology at a larger scale.
Author Keywords
Video; public settings; marathon; crowd sourcing; tagging; story telling.
ACM Classification Keywords
H.5.m. Information interfaces and presentation (e.g., HCI): Miscellaneous.
INTRODUCTION
There has been a massive growth in amateur video capture and sharing by spectators at public events, ranging from marathons and cycle races, to music festivals and gigs, and even marches and protests. This has been fuelled by the increased ownership and sophistication of smartphones that enable spectators to capture videos in the first place, coupled with the emergence of social media services such as YouTube and Facebook that allow them to subsequently share and tag them. This emerging practice is now being
further driven through a new generation of streaming services such as Bambuser, LiveStream and UStream that allow spectators to broadcast live video footage across low-bandwidth mobile internet connections such as 3G [10]. Consequently, capturing and sharing video documentation is fast becoming an integral part of attending events [1].
Our interest here lies in how we might better support this emerging practice by enabling spectators to more actively and systematically capture video from public events. We seek to do this in a way that delivers a video corpus with sufficiently broad coverage, quality and structure to facilitate the telling of various stories after the event. This both draws on and contributes to a growing interest in HCI in crowdsourcing documentary media, including previous research addressing the optimization of groups capturing video on the ground [17] and the post-hoc integration of user-generated content into multimedia archives, either automatically (using audio features) or through additional contextual metadata such as location and time [22,23]. Our interest also relates to previous research into the generation of souvenirs and stories from everyday experiences, including creating multimedia photostories from a theme park visit [6], collaborative collection of photos of a rally competition [18], and supporting everyday storytellers with lightweight approximations of professional broadcast editing [3].
This focus of this paper, however, is on driving the systematic and widespread capture of video by spectators during an event. We describe how the deployment of a prototype system called RunSpotRun ‘in the wild’ at a public marathon enabled spectators to generate a corpus of tagged videos of runners. We then present an analysis of this corpus from the point of view of coverage, quality and content and show how it might underpin the generation of various stories from the race. This enables us to:
• Determine whether it is feasible for spectators to
generate a video corpus that offers good coverage of a race, geographically, temporally and of individuals;
• Reveal the nature of the videos that spectators capture
in terms of their content and quality;
• Understand how this video capture and tagging affects
the experience of spectating;
Permission to make digital or hard copies of all or part of this work for personal or classroom use is granted without fee provided that copies are not made or distributed for profit or commercial advantage and that copies bear this notice and the full citation on the first page. Copyrights for components of this work owned by others than ACM must be honored. Abstracting with credit is permitted. To copy otherwise, or republish, to post on servers or to redistribute to lists, requires prior specific permission and/or a fee. Request permissions from [email protected].
• Discuss opportunities and challenges for scaling-up
this approach in the future.
TELLING STORIES FROM MARATHONS
We have chosen marathon races as suitable target for exploring how spectators can crowd-source video for several reasons. First, their distributed nature makes them difficult to capture in detail using conventional means. Second, they involve large crowds of active spectators who line the streets at many different vantage points along the course. Third, we suggest that there is a strong desire for participants to tell their personal stories to family, friends and to sponsors; indeed the proliferation of race-souvenir photography is perhaps evidence of this, as is the use of live meta-data to increase engagement with spectators [5]. We therefore begin by briefly considering some of the ways in which this is currently achieved and how these have motivated our own approach.
Marathon photo and video souvenir services
Various companies have been springing up to capture photos and more recently videos from marathons, using additional technologies to record the positions of runners at key locations in order to index into and subsequently identify runners in the captured media. Many marathons use systems such as ChronoTrack (www.chronotrack.com) or Ultra (rfidtiming.com/ultra-2/) which time runners using RFID tags attached to the their shoelaces and reader-gates deployed at the start, end or other strategic locations. This technology was used [21,24] by Asics at the New York Marathon to publish the progress of runners online and to allow friends and family to send messages of support to screens around the course via social media (www.supportyourmarathoner.com). Marathon Photos, on the other hand, (www.marathon-photos.com) provides a commercial photography service for international long distance running events. Entering the name of the event and runner name or number extracts a set of professionally generated photos and videos of their race captured at the finish line. The service also allows the user to locate additional footage by sorting their multimedia dataset by time, location, runner gender and runner clothing.
However, the collective use of these systems to create navigable corpuses of video is still in its infancy, and many problems remain to be solved. Tracking technologies such as RFID have a limited granularity, and at smaller events this technology is likely to have gates only at the start and the end of the race. Similarly the amount and variety of complimentary professional footage is limited, typically being captured from a small number of locations.
Television coverage of marathons
There is also a longstanding tradition of professional outside broadcasting of marathons. However broadcasters face two key challenges: they cannot be at every event and they typically can only offer very limited coverage when
they are present. Recent coverage of an event such as the London Marathon required 51 HD cameras [20] to deliver live coverage that, necessarily, focused on a relatively small proportion of the runners taking part. While the relatively few elite athletes provide a natural focus for broadcasters, there is an increasing interest in reporting the stories of the swathes other amateur and charity runners who take part. Perhaps the bigger challenge lies in the many thousands of other races at which broadcasters simply cannot be present, from small fun-runs to large annual city-based marathon events involving thousands of participants, many of whom run for charitable causes, and which also attract large crowds of spectators to support them. One solution for documenting these events may lie in amateur video footage, and leveraging the ad-hoc and informal video capture using mobile phones that is increasingly a ubiquitous part of the spectator experience [12]. Indeed, some amateurs already systematically organize themselves to capture and curate collections of video, particularly from music gigs [16,19].
APPROACH
We undertook a study to explore how spectators at a marathon might collectively generate a video corpus that covered the event. Our study unfolded in three stages: capturing a video corpus, interviewing spectators about their experiences, and visualizing and analyzing the footage that they captured.
Capturing and live-tagging a video corpus
We designed and implemented RunSpotRun primarily to crowd-source short video clips of a live marathon via consumer smart phones used by spectators while watching the race. At the same time the system also collects both automatic and spectator entered meta-data regarding clips and the runners in the race to aid future indexing and navigation. The system comprises an Android client application that captures video, tags of runners as entered by spectators, and the reported position of the spectator.
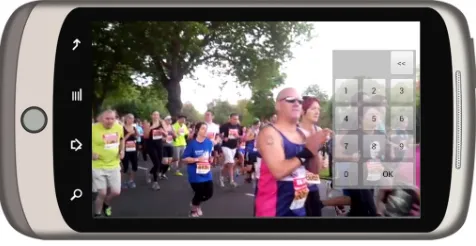
The RunSpotRun Android application, shown in figure 1, presents a camera preview to spectators, and that is locked to always display in landscape mode in order to consistently capture video in this format. A large button enables users to begin recording video and audio using the built-in camera and microphone and this is then stored locally. The maximum length of an individual video clip is limited by the underlying storage on the phone; so that spectators can either collect a large number of individual clips by starting and stopping broadcasting, or can continually record for long periods of time.
simplest – and we hoped most reliable – baseline for noting the presence of interesting runners in video clips, given that significant occlusion of numbers was likely to be an issue. On entry of a runner number the application updates a local tag document with the runner number, a unique identifier for this spectator, the spectator’s position as reported by GPS, a unique identifier for the current video clip and current time-stamp. The application also periodically logs and reports the spectator’s GPS position even when they are not tagging. In the study, this metadata was synchronized with a master server whenever the network allowed, while video files were stored locally and manually recovered after the event. The current version of the app allows spectators to choose to upload videos at their convenience.
Figure 1: The RunSpotRun capturing interface
Deploying RunSpotRun
We conducted a full field trial of RunSpotRun at our local city marathon in September 2013. This annual race consists of a full marathon (26 miles), a half marathon (13 miles) and a junior mini marathon. Over 8000 entrants attempted the 2013 event across these disciplines, and in our trial we focused on the half marathon as the most popular event with over 6500 runners [15]. The course of each race starts and ends at an embankment next to the river, to the south of the city centre. While completing the course runners get to take in several of the city’s major landmarks, running on a mixture of temporarily closed public roads and thoroughfares, and private land. In the past the race has attracted over 10,000 spectators [14].
Participants
For this trial, we recruited spectators to attend the marathon and use RunSpotRun while watching the race at various points along the course. These participants were recruited through mailing lists and through the recommendation of participating runners who knew of friends or family who would be attending to spectate. Some had planned to attend as spectators anyway as part of a planned day out. Overall, participants consisted of one family group, 4 pairs, and 8 individuals. Spectators were allowed to move around the course and to film and tag freely; however on occasion during the trial we sent messages through the application
notifying them of ongoing race information so that they could plan their activities.
Spectators were briefed on their participation one or two days before the marathon, and loaned an Android smartphone with the application preloaded. We conducted these sessions in advance of the marathon to ensure that the spectators underwent their usual ‘spectating activity’, as far as possible, situating themselves along the course at a location of their choosing rather than the nearest section to the briefing site. Spectators were not given a prescribed location from which to view the marathon, nor were they given particular directions as to the duration or manner of videos that they might capture. However we did require them to spend at least 90 minutes attending the marathon, during which they were asked to both use the application but also to move around the course and act as normal spectators as much as dedicated camera operators.
Interviewing the spectators
Our recruited spectators were interviewed about their experience after the marathon. Interviews were semi-structured and focused on asking spectators about the location they chose to spectate from and their rationale for choosing these, any other locations they subsequently moved to, the videos they captured, the runners they tagged, their experience using the application and their overall experience of attending the event.
Post-race tagging of the video corpus
After the event, we undertook two further tagging exercises in order to better classify and understand the content that has been captured. To support this, we developed a browser-based tagging interface that presented a user with a two-minute segment of video footage and allowed them to enter tags, either for a moment in time or for a configurable duration. First, we used this browser to comprehensively categorise all footage according to four key dimensions so as to help us understand the overall, nature and quality of the captured video material:
• Runner density: none, sparse, average, many, dense • Type of camera shot: non footage, blurry, walking
with camera, still shots, tracking shots
• Elements of the race, including: race, off-race, start
line, finish line and incidental footage or scenery
• Area of the race: urban or countryside
connected to the project to apply the schema to the broader video corpus, or adding additional tags by free text.
Visualising and exploring the corpus
We then developed an interactive visualization to enable us to explore our tagged video corpus in greater depth. This involved two further steps that we briefly note before presenting our findings. First, we developed a simple technique for translating the reported GPS positions of spectators into a distance along the half-marathon course. Second, we used this as the basis for the more complex task of inferring the runners’ positions throughout the race at different times. We obtained public data giving each runner’s official start and finish time as they crossed the start and finish gates published by the race organisers after the event. We then worked out a series of further positions/times for each occasion they had been tagged by a spectator (with a known position). This allowed us to estimate their path as being a series of linear segments connecting their official start point, any subsequent points at which they were tagged, and their final end point.
FINDINGS
Our 17 participants recorded a total of 412 videos, totaling 11 hours 29 minutes of footage. The videos range in duration from 2 seconds to 31 minutes 10 seconds with an average length of 1 minute 48 seconds. Spectators produced a mean of 31.8 videos each, with one uploading as many as 64. In total spectators entered 3108 live-tags of runners during the race. Of the total amount of footage, 33 minutes was excluded from the corpus, due to being damaged or infringing on ethical and privacy issues (e.g., due to children being without filmed with parental permission). This left 10 hours and 56 minutes of footage that was tagged and analysed. We categorized all of the video using our schema, and subsequently a sample of (55% of the footage, or ~200 videos) was free tagged, applying a total of 486 unique tags.
Overall coverage
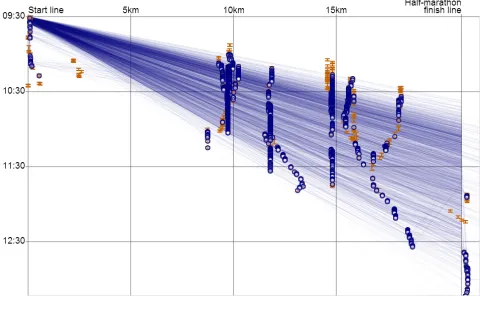
Figure 2 visualises the overall spatial and temporal coverage of our video corpus. The horizontal axis shows distance along the half-marathon course while the vertical axis shows time running downwards from 09:30 when the race began until sometime after 12:30 when it finished. Each blue line describes the trajectory of an individual runner as a simple linear interpolation between start and end times. Brown rectangles show the locations and times of captured videos while blue circles show individual tags of runners. The combination of all runner trajectories generates a quadrilateral shape whose vertices are, at the top left, the moment the starting gun was fired, at the bottom left, the latest crossing of the start line, and at the right, the moments when the fastest and the slowest runners crossed the finishing line. The visualization shows that there was good temporal coverage of the event. For example, videos located between 8.5 and 10.5km appear to
[image:4.612.318.558.116.272.2]cover 87% of the time frame within which the race passes through this region. Spatial coverage was patchy however, with spectators tending to remain in one place, except for a few who moved along the course.
Figure 2: Race visualization
Geographic coverage
Figure 3 sheds further light on the geographic distribution of the videos by plotting them on a map of the racecourse.
Figure 3: Geospatial video coverage of the course
This reveals how notable geographic properties of the route affected capture. The start and finish line of the route are close to one another, enabling a spectator to watch the start of the race, then move a short distance to observe runners returning and crossing the finish line. There is also a very tight switchback, where a few metres away runners move in the opposite direction to those who started earlier. Similarly the route includes a much larger switchback around a park area, allowing spectators to see the runners more than once.
[image:4.612.320.556.339.467.2]footage was of urban sections of the race, while 30.2% was of countryside and park areas. While we might expect the start and finish lines to be popular viewpoints, they received little coverage at 2.5% and 5.1% respectively, perhaps because they are crowded with runners and officials.
Spectators discussed their own “starting location”, or the point on the marathon route that they chose to begin spectating. Reasons for selecting a starting location were varied. Half of the interviewed participants commented on the fact that they chose their starting location as being conveniently close to where they live. Other participants appeared to choose their location either based on prior knowledge of good vantage points, e.g. “we stood near the west entrance…my brother was running and that’s where I stood last year to see him”, or based on being in search of a good atmosphere, e.g. “The embankment, the start line, we thought it was the busiest…the more exciting, where all the atmosphere was…a good place to spot people.”
While some spectators tended to remain in a single location for the duration of their spectating, particularly the pairs and the family group who remained in the relatively pleasant environs of the park, others moved to a new location during the event. Some spectators commented that they changed location in order to capture a variety of footage; one spectator noted how they stayed on “[ ] mainly…different sides of the road, different angles…We ended up at the finish line eventually. But that was later.” Another spectator stated how they slowly walked alongside the route: “Started from the station, followed the marathon down the river… arrived at the finish line. Stayed at the finish line for a while…then walked back along the river… I went quite late, so I tried to… not film the best ones, but the last ones in a way.”
Coverage of tags
We now turn our attention to the coverage of tagging. Of the 412 videos captured, 212 were explicitly tagged with runner numbers at least once. Spectators entered 3108 live-tags in total, generating on average 164 live-tags each, with one prolific spectator managing 561 during the event, while conversely two of the spectators managed less than 10. 2140 distinct runner numbers were entered, of which 1805 exist in the official results. 25% of all runners taking part in the marathon were tagged at least once, and of these runners spectators generated an average of 1.4 tags of each.
Video content
According to the tags generated during our post-hoc tagging exercise, 10.8% of our corpus was footage of very dense periods of runners passing, 34.6% was of ‘many’ runners; 32.9% was of an average number of runners, and 19.2% was of areas of the course with sparse numbers of runners. 72.1% of the video was footage that also included other spectators, while only 1.3% was of the scenery, and wider environment around the race, rather than of the race itself. As shown in figure 4 the most sparsely populated footage is
of the fastest and slowest racers, whilst the denser footage is from around the start line or featuring the majority of middle-speed racers. This allows us to filter the footage to show just professional runners, or instead just the main body of fun runners.
Some tags and videos appear to be outside of the normal envelope, for example near the start line and more than half an hour after the official start. A closer look at the videos in this cluster reveals that these tags correspond to children participating in the 2.5km-long mini-marathon, which started later, from the same location. When comparing the official results for the mini-marathon and the half-marathon, it appears that bib numbers are not unique between races and that these tags have been erroneously attributed to adult runners. Similarly a cluster of videos past the finish line, and after the apparent finish time, show how spectators have captured videos of runners cooling down after the race. Interestingly, one of the spectators spoke about filming these aspects of the race other than runners just passing by “I did enjoy the social aspects which I could film at the finish line…people who had arrived, who had their families, who were laying down near the river. I enjoyed all the atmosphere of an event, a happy event.” Unsurprisingly, spectators reported that it was difficult to tag all runners in shot when the race was at is most densely packed. They therefore developed strategies for prioritizing: “I tried to tag some people, especially ones…that were very happy, or were interacting with other people, some were wearing really funny clothes.” Some spoke about runners who stood out as warranting tagging” “People with fancy dresses, like Robin Hood, like Santa Claus. Other people were dressed up like hospital doctors.”
Our collection of free-text post-tags provided more specific and descriptive labels, referring to notable features such as types of scenery – “lake”, “grass section”, features of individual runners – “green wig”, “sickbed on wheels”, “pace setter”, or elements surround the race – “police”, “background music”, “balloons”.
Camera-work and video quality
According to our post-hoc analysis, 87% or 9.5 hours of footage comprised close range shots taken from a vantage point immediately adjacent to the course, while only 7% was from a distance. Both of these, however, included mixed quality footage. 6.8% was considered ‘non-footage’ captured accidentally, often of spectators feet or the inside of pockets. A further 2.4% was considered blurry footage. From the free-tagged footage, a total of 5% of the footage was tagged as ‘shaky’, and 4.5%, was tagged as being considered unusable ‘Junk footage’. Interestingly, one spectator consistently produced this junk footage.
5.9% of the footage appeared to be tracking specific targets (classified as a ‘tracking shot’). 10.4% of the footage was captured while the spectator was walking alongside the route whilst filming. One spectator described their strategy for choosing how to film - to treat the event as if they were recording official race footage. They said, “I was thinking as a professional video man. I was trying to make as many different recordings as possible from different angles and different points of view, just to have a variety of footage.”
Inappropriate videos
Given the uncontrolled nature of the filming, some potentially inappropriate footage was recorded and highlighted with post-tagging. In our dataset, 8 tags were assigned using the word ‘toilet’, and highlight runners entering the toilets adjacent to the course. 31 segments of video were also tagged as featuring ‘children’, while only 4 were of the children’s race itself. Some videos also clearly show car registration plates driving behavior, and audio of a phone call captured from the companion of one spectator.
Similarly, the video contained footage that runners or spectator might potentially prefer not be published. 3 post-tags were used to tag tired runners. Similarly post-tags like ‘Slow Coaches’ and ‘Really slow people’ were used. Others include footage of ‘cramp’ and ‘encouragement of a failing’. Some tags may be inconsiderate, such as ‘ridiculous shorts’. One spectator highlighted the unnatural feeling of videoing and live-tagging strangers in public, “Pulling out a phone and shooting video in public, really not my thing…you could feel quite self conscious about it.”, however this contrasts with our observations of spectators filming the event in order to capture friends and family.
Creating video stories of the race
We now drill deeper into our data to show how it is possible to search the corpus in order to reveal stories of individual runners or of the event as a whole.
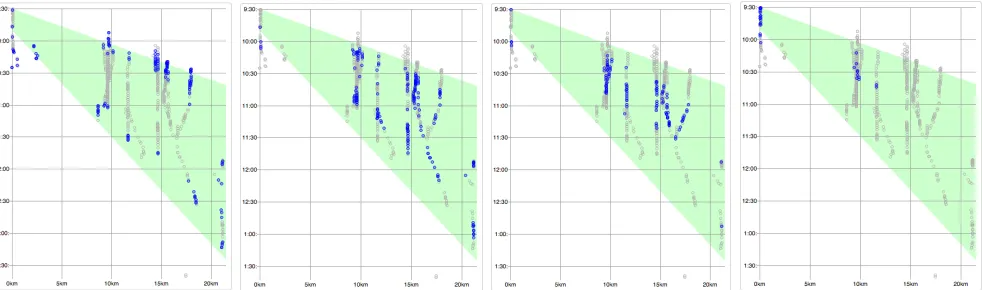
We begin by using our visualization to demonstrate how we might tell the story of a typical runner. In figure 5 we have isolated the trajectory of one runner, bib number 1134, who was live-tagged on 4 occasions by our spectators. We used this to cue up a video playlist of the specific times within
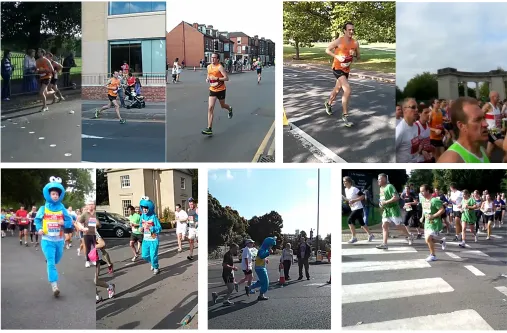
[image:6.612.63.554.50.195.2]these videos at which they had been tagged. Figure 6 (top left) shows that the runner, wearing an orange top, is clearly visible as the videos play out. Next, we can extract other videos that intersect this runner’s traectory, but in which they were not explicitly tagged. Inspecting these implicated videos reveals that the runner is clearly visible in four of them, for example as shown in figure 6 (top right), including a video where the density of runners was far too great for our spectators to tag all of those passing by, and runner 1134 is only partially visible in the shot, but recognizable by their orange top. In total, we have extracted a playlist of 8 videos of runner 1134, each with a segment showing them entering and running through the shot.
Figure 5: Visualizing the progress of runner 1134
Next we use a combination of live-tags and post-tags to construct a story of one of the many costumed fun runners taking part in the race (often running for charity). Runner 2574 shown in figure 6 (lower left) is dressed as the children’s television character “cookie monster” and has been live-tagged in 3 times in our corpus. However, their highly visible costume has also resulted with them being further post-tagged multiple times as “cookie monster” and also with the more general “costume” and “fun runner” tags. These tags allow us to identify 6 more videos in which the same runner can be seen.
Finally, we use our tags to create playlists of videos that tell broader stories of the marathon as an event, rather than
focusing on an individual runner. Many runners dressed as the popular hero Robin Hood. The collection of post-tags contains 60 tags of Robin Hood across all videos, allowing us to create playlist highlighting this unique feature of the race from a larger set of runners (e.g., figure 6, lower right).
Spectating and filming
We end by drawing on the interviews with spectators to understand some key aspects of their experience, both as spectators of the marathon, and as active spectators engaged in using RunSpotRun.
Live-tagging of runners’ bib numbers at such a high-density event produced some interesting user feedback. One spectator noted “It was hard sometimes, if you were trying to read numbers on the vest… whilst typing at the same time. You didn’t have time to concentrate as much on the runners,” similarly, another participant said “They were just such a big crowd, very close to each other…I keyed in as many numbers as possible”. The family group acted as a team to collaboratively tag, with one member reading out the runner numbers as they passed, while another typed the numbers in while filming. One spectator indicated how the density of runners made them select a certain filming and tagging strategy; “When we eventually went from a trickle
of people to thousands of people, non stop….it made more sense to pick a spot, turn on the broadcasting…and occasionally tag when I could.”
Spectators did not spend the entirety of their time filming, and this is revealed by the data. However RunSpotRun did have some impact on the normal spectator experience, with one spectator noting how using the mobile phone affected their ability to clap runners along, “Because I’m holding the phone in my hands, I can’t do anything else…you cannot clap and do anything”. Another similarly noted that their obligations as a spectating friend took priority over using the application, in that when they did see a runner they knew they clapped and cheered rather than tagged the runner, and when they had passed were unable to then tag them as their number was only visible from the front, despite having videoed them. Spectators provided important insights into the difficulty of attempting to spot a particular runner in the crowd. One spectator stated “you were very much sort of looking for that person, that made you stop recording and tagging everyone – you kind of just thought, well I’ll wait and see if I can see this person coming.” Conversely, spectators commented on the potential value of the corpus of videos as a motivation for engaging with the application. One spectator commented “It was a really
[image:7.612.58.565.57.390.2]good atmosphere, I’m really glad I took part. It’s just a really good experience…if I tag a lot of people, maybe they can log in somewhere… and have their own little video of them running the marathon.” Similarly, another spectator said, “I think if we could use this properly, they can get more photos of themselves, and that could be a very good thing.” Finally, a spectator commented that they introduced their own element of competition into the tagging activity - “it was to try and beat other people that motivated me.”
DISCUSSION
Our findings suggest that the approach of crowdsourcing videos at a marathon is feasible. Even a small proportion of spectators were able to film and tag a good proportion of runners (though many were not tagged). Our corpus showed good temporal coverage but more patchy geographic coverage. Many of the videos were deemed to be of a usable quality and we have shown that it is possible to mine the corpus to extract stories of individuals and the wider race. We saw how spectators naturally cluster around key areas, including loops and switchbacks that afford good vantage points for capturing the race. We revealed that while they are able to film and tag spectators, this becomes difficult when the race is crowded and when they need to clap and cheer people they know (who may be key targets). We now consider how this approach can enable various forms of storytelling and the challenges of going public.
Enabling Storytelling
The associated metadata generated by our spectators and our tagging exercises makes this video material inherently searchable and therefore open to flexible future uses. Our visualizations and resulting playlists of video segments are generated from a corpus of data that is searchable by runner, spectator, location, time and tags, and we have seen that the video content is of sufficient quality and detail that it is possible to drill into the corpus to extract several videos of particular runners that can be used to begin to tell individual and broader stories of the marathon experience. This approach could extend existing television broadcasting approaches by providing complementary, concurrent and navigable footage. For example, broadcasters might draw on this material during a TV broadcast, or as part of a “red button” (interactive UK digital television) service or companion application that allows viewers to explore it for themselves. Similarly our ad-hoc individual runner stories could sit alongside official finish-line photography that also allows imagery and footage to be identified by runner number. However, we also note the potential for online and social media, where people could search out clips of themselves or chosen runners and construct short individual video montages as souvenirs of the marathon experience. Many runners participate to raise money for charity, and ultimately generating documentary videos may form a key support and possibly important motivator of this activity.
Improving coverage
However, future applications such as these may require greater coverage, especially of runners, but perhaps also geographically. We might assume a larger number of spectators using RunSpotRun would equate to an equivalent increase in coverage of a race. However, our study suggests that this cannot be taken for granted, as spectators tend to gather around certain locations, and factors such as the density of runners at any given point affects tagging activity, and our subsequent ability to explore the corpus. One implication is that we need to investigate techniques to optimize and balance coverage along the route.
easy tagging of predicted runners when they are eventually seen, or to include photographs akin to a “spotters guide”.
Going Public
While deploying RunSpotRun at scale, perhaps involving hundreds of the many spectators present, might deliver greatly enhanced video coverage, there are a number of further challenges that need to be met to realize this.
Motivation
The spectators who took part in our study may have been highly motivated to engage with the capture and tagging activity due to the fact that they were explicitly asked to do so. We are aware that the majority of normal spectators at the marathon may be less so, and are likely to behave differently; as with all crowdsourcing activities there is a significant challenge in understanding how to motivate a large number of participants.
One solution may lie in social media, and in making the capturing activity a social and collaborative task by having runners solicit spectators in capturing video of them by indicating in advance why they will be running and what they will be wearing. Spectators may be willing to engage with activity due to their involvement or engagement with the event and its participants for purely intrinsic reasons [1], however it is important to do so without taking them away from the default spectating experience [7]. Previous research [2][26] on tagging multimedia collections has identified that one category of motivation is “social organisation”, that individuals may be happy to take the time to tag because it helps to enrich and document the mutual experience so it can be more easily shared. Another solution may lie in the fact that many runners take part in marathons to raise money for charity, and capturing video might even become tied into charitable giving. However, a more realistic view might be to consider a stratified approach in which many spectators film a little, perhaps looking for family members or other key individuals, while a few might be motivated to film much more extensively.
Indexing the video corpus
There are further challenges regarding our capturing and tagging methodology. As above, we might attempt to automatically detect and reduce instances of poor quality, for example by detecting shaky or blurred shots, or more proactively directing shots to avoid duplicate content [17]. Our visualization interface helps to identify and remove some obvious errors, such as the reuse of runner numbers in the children’s race, however further development of the mobile interface could also help prevent other keying errors. We also recognize the significant potential to integrate the tagging data with other existing runner tracking systems, for example RFID gates and self-logged runner GPS data. While we saw no evidence that the live-tagging interface adversely affected the quality of the footage, in the longer term image-processing technologies
bring the potential to automatically tag runners, both live and post-hoc. However, the crowded nature of races may make this a challenge for automated systems (as for humans) and an outcome of our study is a dataset that can help drive forward the development of such approaches. The addition of rich post-tagging of the video corpus may require a different approach to operate at scale with many hours more footage than we tagged in our study. Again, a computer vision approach could aid some aspects such as classifying the density of runners and quality of camera work. However, a useful and complementary approach may lie in crowdsourcing. We have seen how it is possible to predict videos in which runners may appear from estimates of their race trajectories. This suggests extending our post-tagging interface to enable online viewers to not only search for videos of specific runners, but also to retag them when they find them. In turn, further tagging might improve estimated trajectories and so make it easier to predict likely videos, which in turn would drive further tagging. However, any approach that opens up the corpus to a wider audience must be sensitively structured to take account of issues of consent and to deal with undesirable footage, perhaps by requiring runners to specifically opt into being tagged themselves in advance, or approving content.
Direction and Slow Search
One final discussion point concerns a potential longer-tem consequence of success. If we solve the problems of large-scale motivation and tagging by many spectators then we could potentially generate very large corpuses of video. A particular challenge in the future may arise from flooding mobile networks with data, especially at crowded public events where an unusually large number of people occupy a small number of mobile network cells. The ability to upload video would be severely compromised. A potential solution may be to continue with our strategy of transmitting meta-data (tags, locations) as near to real time as possible in order to support direction of capture, social coordination and motivational activities, but to intelligently upload videos selectively with a view to minimizing network congestion, to provide an engaging online view.
The rapid publishing of metadata followed by actual videos sometime later, opens up a novel space of possibilities for constructing slow-search [25] viewing interfaces. We might enable online viewers to search for footage of particular runners based on the currently available metadata and show estimates of when the actual videos might be available if they are prepared to wait for them to be uploaded. Indeed, upload of selected videos might be prioritized or negotiated based on demand – who wants them when – or coverage – if they are of unusual or sparsely covered locations.
CONCLUSIONS
shown that a small number of spectators acting freely around the marathon route can capture a significant amount of video and also concurrently index it with tags. Further post-tagging and inspection of the video corpus has subsequently allowed us to extract and construct short video souvenirs of individual runners and the broader event. We conclude that our approach is promising, but we have also highlighted specific challenges that remain, particularly regarding how RunSpotRun can be deployed to large numbers of spectators. We believe that our approach is also applicable to other sporting events that involve crowds of spectators lining a linear, geographically distributed course, for example cycling or rallying events, and perhaps to other kinds of public events beyond these.
ACKNOWLEDGMENTS
We gratefully acknowledge the support of the Horizon Centre for Doctoral Training (EP/G037574/1). This work was also supported by a Google Research Award.
REFERENCES
1. Ames, M., Eckles, D., Naaman, M., Spasojevic, M., and House, N. 2010. Requirements for mobile photoware. Personal Ubiquitous Computing.14, 2, 95-109
2. Ames, M. and Naaman, M., 2007. Why we tag. In Proc. Of CHI ’07. ACM, NY.
3. Bartindale, T., Hook, J., and Olivier, P. 2009. Media Crate: tangible live media production interface. In Proc of TEI '09. ACM, New York, NY, USA, 255-262. 4. Ben-Ami, I., Basha, T. and Avidan, S., 2012. Racing
Bib Numbers Recognition. In Proc of British Machine Vision Conference 2012. 19.1-19.10.
5. Curmi, F., et al. 2013. HeartLink: open broadcast of live biometric data to social networks. In Proc. of CHI '13. ACM, New York, NY, USA, 1749-1758
6. Durrant, A., et al. 2011. Automics: souvenir generating photoware for theme parks. In Proc. Of CHI. ACM, NY, 1767-1776
7. Engström, A., Perry, M., and Juhlin, O. 2012. Amateur vision and recreational orientation:: creating live video together. In Proc of CSCW '12. ACM, New York, NY, USA, 651-660
8. Esbjörnsson, M. et al., 2006. Watching the cars go round and round. In Proc. Of CHI ’06. ACM, NY. 9. Jacucci, G. et al., 2007. Comedia. In Proc. Of CHI ‘07
ACM, NY.
10.Juhlin, O., Engström, A. and Reponen, E., 2010. Mobile broadcasting: the whats and hows of live video as a social medium. In Proc. of MobileHCI ’10. ACM, NY 11.Kennedy, L. and Naaman, M.. 2009. Less talk, more
rock: automated organization of community-contributed collections of concert videos. In Proc of WWW '09. ACM, New York, NY, USA, 311-320.
12.Laibowitz, M.,et al. 2010. Multimedia content creation using societal-scale ubiquitous camera networks and human-centric wearable sensing. In Proc. of Multimedia '10. ACM, New York, NY, USA, 571-580
13.Ludvigsen, M. and Veerasawmy, R., 2010. Designing technology for active spectator experiences at sporting events. In Proc. of OZCHI ’10. ACM, NY
14.Nottingham Evening Post Article. 2012.
http://www.nottinghampost.com/guide-Nottingham-s-
Robin-Hood-Half-Marathon/story-17004302-detail/story.html
15.Nottingham Marathon Results. 2013. http://robinhoodhalfmarathon.co.uk/ 16.Radiohead Prague. 2009.
http://radiohead-prague.nataly.fr/. Retrieved 09/14
17.De Sá, M., Shamma, D., and Churchill, E. 2014. Live mobile collaboration for video production: design, guidelines, and requirements. Personal Ubiquitous Computing. 18, 3 (March 2014), 693-707.
18.Salovaara, et al. 2006. Collective creation and sense-making of mobile media. In Proc. of CHI ‘06. ACM, NY, 1211-1220
19.Shrestha, P., et al 2010. Automatic mashup generation from multiple-camera concert recordings. In Proc. of Multimedia '10. ACM, New York, NY, USA, 541-550. 20.SiSLive, 2011. Case Study: London Marathon 2012,
Available at: http://www.sislive.tv/case-studies/LondonMarathon.pdf
21.Sniderman, Z., 2011. New York Marathon Runners Getting Digital Love from RFID Chips. 28/10/2011. Available at: http://mashable.com/2011/10/27/marathon-runners-rfid-chips/
22.Snoek, C., et al. 2010. Crowdsourcing rock n' roll multimedia retrieval. In Proc. of Multimedia '10. ACM, New York, NY, USA, 1535-1538
23.Sundaram, H. and Campbell, M., 2008. Event Mining in Multimedia Streams. Proceedings of the IEEE, 96(4), pp.623–647.
24.Swedberg, C., 2011. New York City Marathon Offers Enhanced RFID-enabled Apps. RFID Journal. 25.Teevan, J., Collins-Thompson, K., White, R., and
Dumais, S. 2014. Slow search. Commun. ACM 57, 8 (August 2014), 36-38.
26.Van Velsen, L. and Melenhorst, M. 2009. Incorporating user motivations to design for video tagging. Interacting with Computers, 21(3), pp.221–228