Contents
The current situation 4
Methodology 5
Results 7
Conclusions 17
Acknowledgments 18
Appendix 1 – About the authors 19
Appendix 2 – Examples of Australian climate change programmes 20 Appendix 3 – Comparisons with other studies on climate change 21
This report is the second of three in a series of research projects carried out by ACCA Australia/NZ, in collaboration with Net Balance Foundation Limited, investigating trends in selected areas of sustainability reporting and disclosures in Australia. The three topics are: stakeholder engagement (published in March 2007), climate change and human capital management.
The aim of this trilogy of research projects is to delve deeper into these 3 key areas of sustainability reporting by analysing the level and quality of disclosures by large Australian corporates. Climate change (the theme of this particular report) is rarely out of the news, and if not addressed, is widely considered to be the single biggest threat to society and the environment. Recent publications such as the reports by the Intergovernmental Panel on Climate Change, UK’s Stern Review as well as international treaties and initiatives such as the Kyoto Protocol, Asia Pacific Partnership on Clean Development and Climate and the EU Emissions Trading Scheme all serve to find a solution to this growing global problem. As the products and services of large organisations contribute significantly to climate change, they are expected (and in some cases required by law) to mitigate their impacts by reducing their greenhouse gas
The overwhelming evidence produced by the scientific, environmental and economic
communities can leave few people in doubt that climate change is now a serious threat to humanity and the environment. There are likely to be severe consequences for both developed and developing countries if global temperatures continue to rise at the same rate as they have in recent years. The recently published Stern Review quantified this statement and estimated that a “Business as Usual” scenario will result in a 5–10% loss of global GDP and a projected increase in temperature of 5-6 degrees Celsius during the next century. This scenario takes the world into territory that has never been
experienced by humans before. Alternatively, taking “immediate drastic action” to stabilise carbon emissions by 2050 was estimated to be at a cost of about around 1% of GDP – a significant difference.
There are currently several programmes in Australia combating climate change and greenhouse gas emissions at both the federal and state level (see Appendix 2), but there is no commonly agreed overall plan or policy in place
to halt or slow the increasing emissions. Australia is not a signatory of the principal international climate change initiative – the Kyoto Protocol – but did create the Asia-Pacific
Partnership on Clean Development and Climate with the US in 2005, with the aim of promoting cooperation and increased investment in
developing low emissions technologies between the six participating countries: Australia, China, India, Japan, Korea and the US.
Stakeholders including consumers, shareholders, communities and employees, now expect global corporations to pro-actively address climate change in their product design, operations and processes. Furthermore, stakeholders expect global corporations to report such efforts from both a risk management and corporate
responsibility perspective, to their stakeholders in a transparent way. Initiatives such as the Carbon Disclosure Project globally and the Investor Group on Climate Change in Australia promote improved reporting. This report aims to analyse and discuss the extent to which Australian corporations are disclosing their climate change management efforts.
This report summarises the findings of research carried out by an independent analyst on the largest 50 companies in Australia (as at
December 2006) using the Australian Securities Exchange (ASX) Top 50 (by market
capitalisation) index. The research was based on a series of “Yes/No” climate change criteria, originating from those developed by
FTSE4Good’s Climate Change Advisory Committee. The criteria that companies were assessed against in this study were divided into three different sections, as follows:
• Governance & Management, which considered whether reporters explain the governance structures in place within the organisation to manage and mitigate climate change – for example – target setting, Board and senior responsibility for climate change, climate change policies and public position statements.
• Data and Indicators, which focussed on disclosure of KPIs relating to climate change and an explanation of any trends in performance. This section also considered methods used in collecting data and reporting and whether the information was externally assured.
• Performance and transformational initiatives, which examined whether the reporter has in place (and reported upon) any initiatives to increase energy efficiency and reduce emissions of its products and services. This includes fuel switching programmes, product innovation, R&D, low carbon technology and carbon capture & storage.
Information used in the analysis included hard copy sustainability/CSR/social and environmental reports, web-based reports and any social and environmental information included in the annual report and associated accounts.
Methodology
1 Alumnia 2 Amcor Ltd 3 AMP Limited
4 ANZ Banking Group LTD 5 Aristocrat Leisure Limited 6 Australian Gas Light Company 7 AXA Asia Pacific Holdings Ltd 8 BHP Billiton Ltd
9 Bluescope Steel Limited 10 Boral
11 Brambles Industries Ltd 12 Centro Properties Ltd 13 Coles Myer Ltd
14 Commonwealth Bank Of Australia 15 CSL Ltd
16 Fairfax (John) Holdings Limited 17 Fosters Group
18 GPT Group
19 Insurance Australia Group (IAG) 20 James Hardie Industries N.V. 21 Lend Lease Corporation Ltd 22 Macquarie Airports
23 Macquarie Bank Limited 24 Macquarie Goodman Group 25 Macquarie Infrastructure Group
26 Mirvac Group
27 National Australia Bank 28 Newcrest Mining Limited 29 Orica Ltd
30 Origin Energy Ltd 31 Promina Group Limited
32 Publishing & Broadcasting Limited 33 Qantas Airways Ltd
34 QBE Insurance Group Limited 35 Rinker
36 Rio Tinto Ltd 37 Santos Limited 38 St George Bank Ltd 39 Stockland
40 Suncorp-Metway Ltd 41 Tabcorp Holdings Limited 42 Telecom Corporation Of NZ Ltd 43 Telstra Corporation Limited. 44 Toll Holdings Limited 45 Transurban Group 46 Wesfarmers LTD 47 Westfield Group
[image:6.595.57.540.135.544.2]48 Westpac Banking Corporation 49 Woodside Petroleum Limited 50 Woolworths Ltd
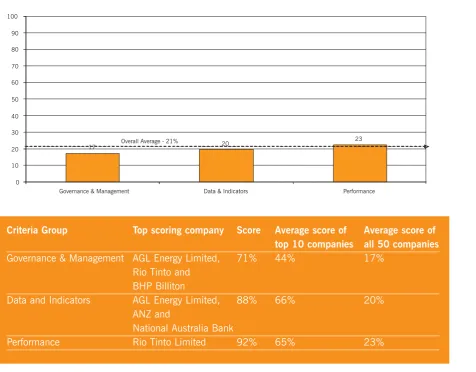
Table 2: top scoring companies in each criteria group
OVERALL
There is a large variation in performance of the companies included in this study. The scores ranged from 82% (AGL Energy Limited), to fifteen companies who scored nothing at all – 0%. The average score of all 50 companies was just 21%, illustrating that there is significant progress to be made on climate change disclosures for the majority of the companies included in the research. The same was true of the individual criteria sections – scores ranged from 92% down to 0%. (See table 2 for the top scoring companies in each criteria group.)
Criteria Group Top scoring company Score Average score of Average score of
top 10 companies all 50 companies
Governance & Management AGL Energy Limited, 71% 44% 17% Rio Tinto and
BHP Billiton
Data and Indicators AGL Energy Limited, 88% 66% 20% ANZ and
National Australia Bank
Performance Rio Tinto Limited 92% 65% 23%
Overall average percentage of the ASX 50 companies in each of the criteria groups
17 20
23
0 10 20 30 40 50 60 70 80 90 100
The top 10 companies’ performance (based on overall percentage score) ranged from 82% (AGL Energy Limited) down to 43% (Westpac Banking Corporation) with only two companies scoring over 75%.
These top scoring companies were from a variety of different sectors including Mining & Resources, Banking and Finance, Insurance, Building and Construction and Energy. Energy was the highest scoring sector overall in the analysis with 73%, but there was no leading sector in the top 10 companies. (However, there were only two companies in the Energy sector included in the study compared to, for example, seven in the Mining and Resources sector).
Results
Top 10 performing Australian companies in the ASX 50
0 10 20 30 40 50 60 70 80 90 100
AGL Energy Limited
Rio Tinto Limited
Australia And New Zealand Banking Group
Limited
BHP Billiton
Limited
Origin Energy Limited
Telstra Corporation
Limited.
Boral Limited National Australia Bank
Limited
Insurance Australia Group Limited
Westpac Banking Corporation
Average overall score for each sector
0 20 40 60 80 100
Ene
rgy Foo
d & Beve
rage* Min
ing &
Reso urces Teleco mm s Div
ersified Indu
strial Ban
king & Fina
nce
Buildi
ng &
Con stru ctio n Manu fact
urin
g Insur
ance Retail Infrast
ruct ure
Prope
rty Invest
men
t Gam
ing
Log istics
* Tran
spo rt* Med ia Hea lthca re*
CRITERIA GROUP RESULTS
Governance & Management
Performance of top 10 performing companies in the Governance & Management criteria group
0 10 20 30 40 50 60 70 80 90 100
AGL Energy Limited
Rio Tinto Limited
BHP Billiton
Limited
Origin Energy Limited
Insurance Australia Group Limited
Australia And New Zealand Banking Group
Limited
Boral Limited Westpac Banking Corporation
Telstra Corporation
Limited.
National Australia Bank
Limited
- climate change policy (operations) - climate change policy (products) - emissions targets (operational) - emissions targets (product) - responsibility for climate change
- public position statement on science of climate change - public position statement on binding targets
Number of companies scoring 0-7 in Governance & Management criteria group
48% 18% 16% 6% 6% 6% 0% 0%
Score 0 Score 1 Score 2 Score 3 Score 4 Score 5 Score 6 Score 7 * 7 being the maximum score in this criteria group
Performance by the 50 companies against the Governance and Management criteria was found to be varied with only 26 of the 50 companies going some way towards meeting the criteria. No company scored the maximum and the majority of the companies fulfilled just 1 or 2 of the criteria out of a maximum of seven.
Results
BEST PRACTICE CASE STUDY AGL Energy Limited – score 71%
AGL Energy’s report clearly references the organisation’s greenhouse gas policy, which sets out AGL’s support for a National policy on climate change and how the business is reducing the emissions of its operations.
AGL’s report also explains that the Environment Leadership Team (chaired by the MD) leads the implementation of AGL’s environmental and greenhouse principles and policy. There are public statements outlining AGL’s position on the scientific consensus of climate change and publicly binding targets – the latter is shown below:
“Australia has not ratified the Kyoto Protocol, and currently has no national emissions trading scheme or national greenhouse gas reduction target. However, a number of policy instruments … are in place for reducing greenhouse gas emissions (either directly or via targets for renewable or low-emissions generation).
AGL:
• supports the introduction of a long-term emissions reduction target with clear interim milestones and the creation of a national emissions-trading scheme
• is a strong supporter of renewable energy and supports cost effective initiatives to increase the uptake of renewable energy
Data and Indicators
Twenty-five companies from the sample of 50 did not provide any information on emissions data trends or collection methods nor state that emissions and climate change data are externally assured. Three companies – AGL Energy, ANZ and National Australia Bank had the equal top score in this area with 88%. This was significantly higher than the average score of all 50 companies for this area, which was 20%.
Eighteen of the 50 companies include emissions data spanning 2-3 years (or more) arising from their operations, but only 12 of these explained any trends that occurred over time (either positive or negative). Nine of the companies publicly reporting their emissions data had the information externally assured and just five referred to all the relevant Energy indicators in the GRI Guidelines (2002) – see Appendix 4.
Percentage of companies scoring 0-8 in the Data & Indicators criteria group
48% 12% 14% 6% 8% 4% 2% 6% 0%
Score 0 Score 1 Score 2 Score 3 Score 4 Score 5 Score 6 Score 7 Score 8 * 8 being the maximum score in this criteria group
Performance of top 10 companies in Data & Indicators criteria group
0 10 20 30 40 50 60 70 80 90 100
AGL Energy Limited
Australia And New Zealand Banking Group Limited
National Australia Bank
Limited
BHP Billiton
Limited
Telstra Corporation
Limited.
Boral Limited Rio Tinto Limited
Origin Energy Limited
Insurance Australia Group Limited
Westpac Banking Corporation - emissions data
- energy benchmark - verification of data - reference to GHG protocol - use of GRI indicators
- explanation of performance trends
Results
BEST PRACTICE CASE STUDY National Australia Bank – score 88%
NAB’s report includes detailed emissions data for the previous 2 years (which was when the organisation’s first sustainability report was published). KPIs include: total stationary energy consumption, total green energy purchased, stationary energy-related greenhouse emissions, total fuel-related greenhouse emissions and greenhouse emissions (tCO2-e) per vehicle for Australia, New Zealand and the UK. This data was prepared using the GRI indicators and spot checks were carried out during the external assurance process. The report also explains any trends in performance with regards to energy use:
Performance
Disclosures on the following transformational initiatives are included in this criteria group:
Thirty two of the 50 companies analysed were found to have reported upon (to differing degrees) the initiatives they have in place to reduce their carbon emissions and improve energy efficiency of products and operations. The highest scoring company in this criteria group is Rio Tinto Ltd with 92% and the average of all fifty companies was 23% - the highest of the three criteria groups.
Performance of top 10 performing companies in Performance criteria group
0 10 20 30 40 50 60 70 80 90 100
Rio Tinto Limited
AGL Energy Limited
Origin Energy Limited
Telstra Corporation
Limited.
Australia And New Zealand Banking Group Limited
BHP Billiton
Limited
Boral Limited National Australia Bank
Limited
Westpac Banking Corporation
Insurance Australia Group Limited
Initiative Product Operational
Fuel Switching ✗ ✓
Demand Side Management ✗ ✓
R&D into low carbon technology ✓ ✓
Production of low carbon technology ✓ ✓
Generation of renewable energy ✗ ✓
Product/ service innovation ✓ ✗
Carbon capture and storage (sequestration) ✗ ✓
Supply Chain / upstream influence ✗ ✓
New Business Model – life cycle analysis of product ✓ ✗
Breakthrough Project ✗ ✓
Results
The three elements of performance or initiatives that most companies disclosed information on were: fuel switching, production of low carbon technologies for product innovation and engagement with supply chains to influence their energy management processes. Sixteen companies state that they are involved in local Australian climate change initiatives – namely the Greenhouse Challenge and the Investor Group on Climate Change. However, just five companies state that they consider their products’ entire life cycle with respect to its carbon footprint during design. These companies are AGL Energy Ltd, ANZ, BHP Billiton, Rio Tinto Ltd and Santos Ltd.
BEST PRACTICE CASE STUDY 1 Rio Tinto – score 92%
Rio Tinto’s report explains how it engages and influences its suppliers and customers in their energy management:
“Rio Tinto is working with customers and suppliers to find ways to reduce Greenhouse Gas (GHG) emissions in their processes and the end use of Rio Tinto products. We believe these efforts will assist our products in contributing to sustainable development and stabilising the earth's climate…
• In late 2004, the Rio Tinto Energy Group developed its own Product Stewardship Action Plan in association with Japanese customers, and this is being implemented. Coverage of greenhouse issues is a key consideration, for Rio Tinto Energy offices in both Japan and Melbourne.
• The Energy Group is working with customers in the US and Japan. A study has been completed of Japans' possible policy responses to the issue of climate change.”
Percentage of companies scoring 0-13 in the Performance criteria group
36%
16% 8%
4% 8% 4%
6% 6%
2%
2% 4%
2% 2%
0%
BEST PRACTICE CASE STUDY 2 AGL Energy – score 85%
AGL Energy’s Report explains how the company both generates and purchases electricity from renewable sources:
“AGL generates electricity from a number of renewable energy sources, including wind, hydro, solar and landfill gas.
In addition, AGL purchases renewable energy from a number of renewable energy generators, through power purchase contracts. By purchasing renewable electricity AGL is able to reduce the greenhouse gas intensity of electricity supplied to consumers and comply with legislated schemes such as the NSW Greenhouse Gas Abatement Scheme and the Mandatory Renewable Energy Target.”
BEST PRACTICE CASE STUDY 3 Origin Energy – score 77%
Origin Energy provides energy saving advice and has a number of energy saving products which help residential and commercial customers reduce their energy use. An example of this is their
GreenEarth electricity product, highlighted below:
Results
• Reports should clearly state the governance structures in place for managing energy use and climate change impacts, and link these impacts to business risks and opportunities. Ideally, as the issue is such an important one, overall responsibility should lie with a Board member or Board committee.
• Organisations should have in place policies for managing the energy efficiency of both their operations and products, and include or reference these policies in their reporting. • Alongside the internal policies described
above, companies should issue public position statements on the organisation’s overall scientific consensus of climate change and binding targets set by common agreements such as the Kyoto Protocol. Such public position statements help governments understand business’ position on the issue and develop policies accordingly. • Targets are a critical part of managing
performance and indicate an organisation’s true commitment to mitigating its impacts on climate change. Emissions targets disclosed in reporting should, ideally, be both short and long term (with a specified time scale) and quantifiable.
• Reporters should be recording their emissions data over time, dividing it into business units or geographical operating units where necessary. Any trends should be explained, along with any re-statements of information.
• External assurance of the GHG data adds credibility and reassures readers that the information is correct. Certain trading schemes around the world actually require auditing of the GHG data, so this will become an expected requirement in the future. • Use of the GRI environmental indicators in
preparing reports helps to identify which (energy related) indicators are relevant to the business and should therefore be included. It also helps in comparing performance of different businesses due to defined reporting requirements of the GRI. Where indicators are not considered material to the business, an explanation should be included within the GRI index.
• Both direct and indirect impacts relating to energy use and emissions should be explained in reports – this helps readers understand the organisation’s wider carbon footprint and how it is being mitigated. • Readers, specifically those concerned about
climate change or view it as an investment risk, are perhaps most interested in what the organisation is actually doing to reduce its carbon emissions (both direct and indirect) so any transformational initiatives either in place already, or being planned, should be
disclosed in reporting.
Recommendations for improving climate change reporting of Australian companies
• Although there were some high quality disclosures on climate change from a few companies, there is significant scope for improvement. This is demonstrated by an average overall score of just 21% across all 50 companies
• Areas of (relative) strengths identified in the analysis included disclosures of operational climate change policies, provision of
emissions data over 2-3 years (or more) and participation in local Australian climate change initiatives, for example, Greenhouse Challenge.
• Areas of reporting that were particularly weak were the limited application of the energy related GRI indicators in reporting, lack of reference to GHG reporting protocols and methodologies used and failure to identify senior members of staff or committees with responsibility specifically for climate change.
• Australian reporters do not seem, as yet, to be systematically reporting on their
commitment to mitigating climate change or disclosing performance information relating to this area (see Appendix C for comparison against levels of disclosure by UK
companies). This is perhaps surprising, as climate change has been identified as one of the main future risks to society and the environment, and as a consequence should be classed as a key risk to business as well. • Reporting on company performance and
Richard Francis, ACCA Australia/NZ Vicky McAllister, ACCA UK
Terence Jeyaretnam, Net Balance Foundation Grant Bransgrove, Net Balance Foundation Eva Bellamy, csr specialist, UK
ABOUT THE AUTHORS
ACCA
The ACCA has, for many years, been considered a leader in sustainability related issues, including reporting, assurance, research and corporate governance. The Sustainability Reporting Awards (formally Environmental Reporting Awards) was set up initially in the UK over 15 years ago, designed to highlight and reward best practice approaches to reporting, increase awareness of key accountability and
transparency issues and encourage the uptake of reporting. Since then, a number of national ACCA offices have set up their own awards schemes, including in Australia/NZ in 2003
Net Balance Foundation
Net Balance Foundation Limited (www.netbalancefoundation.org) is a not-for-profit think-tank specifically set up to work with small to medium enterprises, research groups, industry groups, professional
EXAMPLES OF AUSTRALIAN CLIMATE CHANGE PROGRAMMES
Mandatory Renewable Energy Target review (MRET)
In 2004, the Australian government reconfirmed its commitment to the MRET at 9,500GWh by 2010. Its role is to both encourage investment in renewable energy technologies and to reduce greenhouse gas emissions. Under MRET, large wholesalers of electricity are required to obtain a prescribed number of Renewable Energy Certificates (RECs) as a percentage of the electricity they wholesale or face financial penalties of AUD $40 [U.S. $31] for every REC they do not obtain. Each REC represents 1 megawatt-hour (MWh) of electricity created by renewable energy generators. Due to the Australian Federal’s Government’s reluctance to extend this target, there have been several state schemes set up (or due to be set up soon) as well, for example, NSW Government's NGAC scheme (NGACs), the NSW Government NRET scheme (NRET) and the Victorian Government's VRET scheme (VRET).
New South Wales Greenhouse Gas Abatement Scheme
This emissions trading scheme, one of the first in the world, was introduced in 2003. It aims to reduce greenhouse gas emissions associated with the production and use of electricity, by using project-based activities to offset the production of greenhouse gas emissions. The scheme establishes annual state wide targets and requires electricity retailers to meet benchmarks based on their share in the electricity
market. If these benchmarks are not met, a penalty has to be paid.
Greenhouse Challenge Plus
This scheme allows Australian companies to form working partnerships with the Australian Government to improve energy efficiency and reduce greenhouse gas emissions. It builds on the successful
Greenhouse Challenge programme, combining Greenhouse Friendly™ and the Generator Efficiency Standards into a single industry programme. Objectives include providing a vehicle through which organisations can report their greenhouse gas emissions and abatement schemes and therefore a single entry point for industry reporting on climate change.
COMPARISONS WITH OTHER STUDIES ON CLIMATE CHANGE
ACCA UK research on climate change
In 2006, as part of the Awards for Sustainability Reporting theme, the ACCA carried out research into the standard of UK companies’ reporting on climate change. This research was carried out in partnership with FTSE Group and 42 high and medium impact entrants into the awards were included in the analysis. Some key results from the UK analysis, are as follows:
Carbon Disclosure Project Report 2006 – Australia and New Zealand
This research report is based on submissions from Australian and New Zealand companies (listed on the S&P ASX100 and/or New Zealand Stock Exchange NZ50 indices) in response to an information request
sent by the Carbon Disclosure Project (CDP)1and Investor Group on Climate Change Australia/New
Zealand (IGCC)2for investment-relevant information concerning their greenhouse gas emissions and
climate change stance. The summary of the report’s findings is as follows:
• Australian and New Zealand companies are
responsive to investor interest in climate change related issues.
• Companies are generally aware of climate
change related risks, but implementation appears limited.
• Regulatory uncertainty is an issue for many
companies.
• Strategic and financial impacts of future
climate change regulation are complicated and difficult to quantify for many companies.
• Extreme weather events and other physical
risks significantly impact (often adversely) many Australian and New Zealand companies.
• The majority of companies do not have
clearly defined internal accountabilities for climate change related issues.
• Few companies fully quantify and verify
emissions from owned and controlled entities.
• Most emission reduction initiatives do not
have clearly defined targets and timelines.
• Low participation in emissions trading
schemes.
• Few companies demonstrated a sophisticated
understanding of the implications of energy pricing changes on profitability.
1. www.cdproject.net 2. www.igcc.org.au
Criteria UK Australia
(% of companies) (% of companies)
Policy on climate change (operational) 80% 42% Public position statement on the scientific consensus 50% 16% of climate change
External assurance of climate change data 55% 18%
Use of GHG Protocol 14% 2%
Appendix 3
A Climate Leadership Index (CLI) was also developed for the first time during the project, which is based solely on the information submitted by the companies. The CLI included the following companies:
* Australian listed (ASX100) ** New Zealand listed (NZ50) † Dual listed (ASX100 & NZ50)
Sector Company
Banks ANZ Banking Group†
National Australia Bank† Westpac†
Construction materials Boral*
Energy Origin Energy*
Food products, beverages Goodman Fielder† Lion Nathan†
Health care DCA Group*
Symbion Health* Hotels, restaurants and leisure Tabcorp Holdings*
Industrials Transurban Group*
Information technology Computershare*
Insurance Insurance Australia Group*
Metals and mining BHP Billiton*
Rio Tinto† Real estate investment trusts GPT Group*
Investa Property Group* Mirvac Group*
Retailing Warehouse Group**
Telecommunication services Telstra†
GRI CRITERIA ON ENERGY USE (2002 VERSION)
The following indicators were considered key, when reporting on climate change:
EN3 Direct Energy use segmented by primary source
EN4 Indirect energy use
EN8 Greenhouse gas emissions
EN17 Initiatives to use renewable energy sources and to increase energy efficiency
EN18 Energy consumption footprint (i.e. annualised lifetime energy requirements)
EN19 Other indirect energy use and implications, such as organisational travel, product lifecycle
management and use of energy intensive materials
A study by the Association of Chartered Certified Accountants Completed May 2007
Recommendations for climate change reporting – Climate change:
UK corporate reporting, ACCA UK 2007
Policy:climate change policies would be more meaningful (and would be more useful) if they
reflected specifically those particular climate change issues relevant to the company’s operations, products and business sector. More contextual information should also be provided so the rationale behind the policy and its objectives can be more clearly understood.
Product impacts:companies whose products give rise to substantial carbon emissions tend to be poor at reporting these emissions or expressing their view of the appropriate allocation of responsibility for them. For those companies where product responsibility is a material issue, thorough reporting of their ‘downstream’ emissions is necessary. The company’s view of the nature of its responsibility for product emissions should also be a key part of any policy the company has on climate change.
Information and communication:good communication of climate change information to stakeholders
is critical. The general picture currently is that much reporting tends to be buried or mixed with other issues. Navigation and accessibility could both be improved, as could the general location of climate change disclosures, particularly on corporate websites.
Targets:this information is important so that stakeholders can understand the suitability of targets. Company targets should also be reported in the context of national and international targets set by government, or initiatives such as Kyoto.
Assurance and verification:providing assurance is fundamental to adding credibility to any report. Where GHG emissions are significant it is important to ensure that emissions data are accurate and reliable. Companies should also explain the process and boundaries behind the assurance procedure as well as the methodology, to add context for the report-user.
Context and quantification:more contextual information should be given when describing a
company’s transformational initiatives to show how they will be or how they are expected to be genuinely transformational – it is not enough to give just a straightforward description of the initiative itself. The management structures must also be better explained to show how transformational initiatives will deliver change and not achieve only incremental steps to improved performance.
Scope and methodology:companies should include in their reporting an overview of the scope of the