www.wjpr.net Vol 6, Issue 12, 2017. 1058
DESIGN AND DEVELOPMENT OF SINGLE CORE OSMOTIC PUMP
(SCOP) FOR POORLY SOLUBLE DRUG
Nityanand Zadbuke*1, Sadhana Shahi2, Rajendra Marathe2, Rajesh Nawale2 and Satish Rojekar3
1
Department of Pharmaceutics, Yash Institute of Pharmacy, Aurangabad - 431134,
Maharashtra, India.
2
Department of Pharmaceutics, Government College of Pharmacy, Aurangabad - 431005,
Maharashtra, India.
3
Department of Pharmaceutical Sciences & Technology, Institute of Chemical Technology,
Matunga (E), Mumbai- 400019, Maharashtra, India.
ABSTRACT
The present work aims towards the design and development of
controlled release formulation of poorly soluble drug Carbamazepine
(CBZ) based on osmotic technology by using single core osmotic
pump (SCOP) approach. Carbamazepine (CBZ) is a first-line
antiepileptic drug (AED) drug used for the treatment of partial and
tonic-clonic seizures. The concentrations of Natrosol 250L (rate
controlling polymer) and Sodium chloride (Osmogen) added to the
core tablet were optimized. Cellulose acetate (CA) and Polyethylene
glycol (PEG 8000) were used as semipermeable membrane and pore
former, respectively. The effect of different formulation variables
namely concentration of rate controlling polymer and osmogen in the
core tablet, % pore former, % weight gain, orifice diameter, pH of the dissolution medium
and agitation intensity on the in vitro release was studied. CBZ release was directly
proportional to % of Osmogen and inversely proportional to % of rate controlling polymer in
core tablet. The system was found to deliver CBZ at a zero order rate for 24 h independent of
pH and agitation intensity can be useful as improved AEDs efficacy, tolerability and patient
compliance.
KEYWORDS: SCOP, Natrosol 250L, Cellulose acetate, Osmogen, PEG 8000.
Volume 6, Issue 12, 1058-1081. Research Article ISSN 2277– 7105
Article Received on 16 August 2017,
Revised on 07 Sept. 2017, Accepted on 28 Sept. 2017
DOI: 10.20959/wjpr201712-9767
*Corresponding Author Nityanand Zadbuke Department of
Pharmaceutics, Yash
Institute of Pharmacy,
Aurangabad - 431134,
www.wjpr.net Vol 6, Issue 12, 2017. 1059 INTRODUCTION
The novel drug delivery systems are gaining popularity over conventional drug delivery
because of its many add-on features. The conventional dosage form results in constantly
changing, unpredictable and often sub-therapeutic plasma concentrations, leading to marked
side effects in some cases. Conventional oral drug delivery system releases the drug
immediately and does not release the drug in a controlled manner and effective concentration
at target site which leads to major drawback of fluctuating drug levels. Better therapy
management demands for controlled or modified release drug delivery systems. The osmotic
drug delivery is a very promising approach which utilizes the principle of osmotic pressure
for controlled delivery of drugs. The system embraces simple and ease of formulation,
improved patient compliance, reduced dosing frequency and prolong therapeutic effect with
uniform blood concentration.[1,3] The osmotic systems form a major segment of drug delivery
products because of their advantages and strong market potential.[4,5]
Epilepsy is a chronic disorder in which nerve cell activity in the brain is disturbed, causing
seizures or periods of unusual behavior, sensations and sometimes loss of consciousness
demands better management since it can be dangerous during activities such as driving or
swimming. The drug Carbamazepine (CBZ), a first-line antiepileptic drug (AED) is
promising for the treatment of partial and tonic-clonic seizures.[6] CBZ belongs to class II of
BCS classification having low solubility and high permeability.[7] It is well absorbed from
gastrointestinal tract possessing bioavailability upto 80% and 76% protein binding and is
metabolized in liver by CYP3A4 to active epoxide form (10-11 epoxy Carbamazepine). CBZ
is a narrow therapeutic index drug with initially its plasma half life is 20-40 hours but,
decreases to 10-15 hours on chronic medication due to auto-induction of metabolism. Serum
carbamazepine levels fluctuate considerably, even with multiple daily doses[8,9] and can be
associated with transient adverse effects at peak concentrations. In patients receiving
polytherapy, it is of great clinical importance to assure a steady level of CBZ during 24 hour
carbamazepine therapy. The literature envisaged reveals the need for the development of
controlled-release formulations of AEDs to overcome the fluctuations in serum drug levels as
associated with conventional drug delivery systems for improved anti-epileptic therapy.[10,13]
The conversion of CBZ to Carbamazepine dihydrate (CBD) in the gastrointestinal tract is one
of the major rate-limiting steps in bioavailability of oral dosage forms. Dihydrate of CBZ has
one-third solubility as compared to its anhydrous form. The burst release of CBZ from
www.wjpr.net Vol 6, Issue 12, 2017. 1060 facilitates the formation of CBD resulting in poor dissolution rate and bioavailability.
Another approach to address the issue is the formulation of controlled release dosage forms
that would prevent the burst release, super-saturation, and CBD formation. The prevention of
the formation of CBD crystals is of great importance since the crystals dissolve slowly and
may lead to unpredictability in bioavailability profile. The controlled release formulations of
CBZ can be useful as AEDs with improved efficacy, tolerability and patient compliance in
comparison to immediate-release formulations.[14,17]
Single core osmotic pumps (SCOP) are reliable system for delivery of low solubility drug and
a suitable dosage form for oral drug delivery. The SCOP comprises of a single layer of
osmotic core with the drug, surrounded by a semi-permeable membrane. This membrane
consist of an orifice through which drug is delivered. The dosage form when in contact with
aqueous fluids, imbibes water at a rate determined by the fluid permeability of the membrane
and osmotic pressure of the core formulation. The rate of imbibitions of water is determined
by the fluid permeability of the membrane and the osmotic pressure of the compressed tablet.
This osmotic imbibition of water results in the formation of a saturated solution of drug
within the core, which is released at controlled rate through the delivery orifice. The tablets
formulated using poorly soluble drugs devoid of polymers results in settling of drug particles
in the core and poor drug delivery unless the tablet is constantly agitated to prevent the drug
particles from settling. The rate of settling is enhanced in case of large drug particles with
high density. The use of hydrophilic polymers may circumvent the issue and prevent the
settling of the drug particles before they exit through the delivery orifice.[18,23]
Drug release from these systems is independent of pH and other physiological parameters.
Zero order release characteristics could be achieved by optimizing the parameters of the
delivery system.
MATERIALS AND METHODS Materials
Carbamazepine was procured as a gift sample from Swapnroop Drugs and Pharmaceutical,
Aurangabad, India. The excipients was received as a gift samples, Hydroxyethyl cellulose
(NATROSOL 250L) - DKSH India Pvt. Ltd. Mumbai, Cellulose acetate (CA-398-10NF) -
Signet Pharma, Mumbai, India. The Sodium lauryl sulfate (KOLLIPHOR® SLS Fine) -
www.wjpr.net Vol 6, Issue 12, 2017. 1061 K30), Polyethylene glycol (PEG 8000) and Magnesium stearates - Shreya Life Sciences Pvt.
Ltd., Aurangabad, India. All other chemicals used were of analytical grade.
Drug Analysis
CBZ was analyzed by double-beam UV–visible spectrophotometer (Shimadzu 1700 Pharm
Spec) at λ max 284 nm. Calibration curves were prepared in deionized water, pH 1.2,
phosphate buffer 6.8 and phosphate buffer 7.4 in the concentration range of 4–20 µg/ml. No
enzymes were added to pH 1.2, phosphate buffer 6.8 and phosphate buffer 7.4.[24]
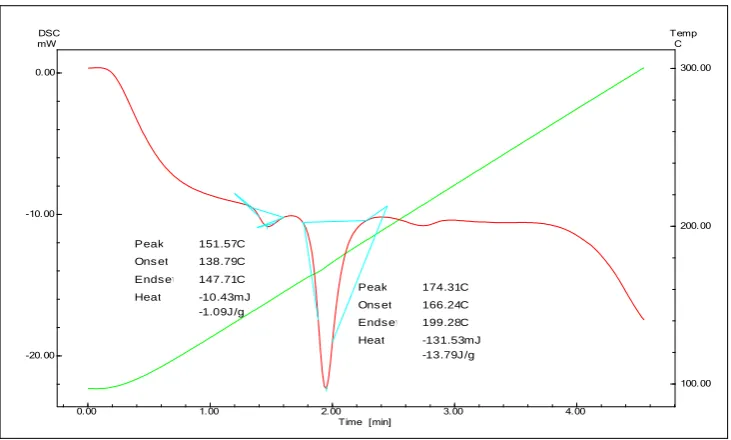
Drug‑Excipients Compatibility Study
The drug‑excipients compatibility study was done by differential scanning calorimetry
(DSC), using a SHIMADZU DSC‑60 differential scanning calorimeter. The system was
calibrated with a high purity sample of Indium. The DSC thermograms were scanned at the
heating rate of 20°C/min over a temperature range of 70‑300°C. Peak transitions and
enthalpy of fusion were determined for the samples using TA60 integration software. The
DSC analysis shows no change in endothermic peak of CBZ. The study indicated that there
was no drug-excipient incompatibility/interaction (Fig. 1 and 2).
0.00 1.00 2.00 3.00 4.00
Time [min] -20.00
-15.00 -10.00 -5.00 0.00 mW DSC
100.00 200.00 300.00 C Temp
167.26x100C
Ons et
205.59x100C
Endset
175.28x100C
Peak
-139.52x100mJ
-45.01x100J/g
[image:4.595.115.482.438.685.2]Heat
www.wjpr.net Vol 6, Issue 12, 2017. 1062
0.00 1.00 2.00 3.00 4.00
Time [min] -20.00 -10.00 0.00 mWDSC 100.00 200.00 300.00 C Temp
138.79x100C Ons et
147.71x100C Ends et
151.57x100C Peak
-10.43x100mJ -1.09x100J /g Heat
166.24x100C Ons et
199.28x100C Ends et
174.31x100C Peak
[image:5.595.116.482.75.295.2]-131.53x100mJ -13.79x100J /g Heat
Fig. 2: DSC thermogram of Carbamazepine with other excipients (Lubricated blend).
Design and Development of Single Core Osmotic Pump (SCOP) Tablet
The tablets were prepared by wet granulation technique. The ingredients were weighed
accurately as per the formula depicted in the Table.13. The weighed quantity of ingredients
was blended for 15-20 min and granulated with water. The wet mass was passed through
sieve no. 20. The resultant granules were dried in hot air oven at 60 ± 5°C to get loss on
drying (LOD) not more than 2.5% w/w. The dried granules were lubricated and core tablets
were compressed at an average weight of 350 mg using 9.50 mm concave punches plain on
both side and 7.0-9.0 kg/cm2 hardness on 12 station rotary tablet machine (Labpress, Cip
Machinery Ltd.).
The core tablets were coated with solution of acetone: water containing cellulose acetate
along with pore former i.e. PEG 8000 to get a weight gain of 7% w/w using R & D pan coater
(Ideal Cuers Ltd.) having pan with 3 baffles, pan speed 20-25 rpm, pump speed 1rpm, inlet
temperature 45˚C, air flow 1 kg/cm², spray nozzle diameter 1 mm, Air gun distance from
tablet bed being 10 cm. The coated tablets were mechanically drilled on one side with 0.6
mm drill.
In vitro Drug Release Study
The drilled tablets were subjected to an in vitro drug release study as per USP Dissolution
Test. The dissolution study was performed using the USP Apparatus 1 (Basket) in 900 ml of
www.wjpr.net Vol 6, Issue 12, 2017. 1063 interval of 1, 2, 3, 4, 6, 8, 9, 10, 12, 16, 20 and 24 h. The withdrawn samples were replaced
with fresh dissolution medium. The samples were filtered through Whatman filter paper and
analyzed by double-beam UV–visible spectrophotometer (Shimadzu 1700 Pharm Spec) at λ
max 284 nm.
The Effect of Formulation Variables on Drug Release
The formulated tablets were evaluated to study the effects of variables such as the amount of
rate controlling polymer and osmogen in the core tablet, concentration of pore former and
%weight gain by coating, orifice diameter, pH of the dissolution medium and agitation
intensity on drug release.
RESULTS AND DISCUSSION
Solubility Enhancement of CBZ by PVP K30 and Sodium Lauryl Sulfate (SLS) Physical Mixtures (PMs)
In the present study PVP K30 and SLS were added to the core tablet to enhance the solubility
of CBZ in an aqueous medium.[25,26] (Table 1)
Table 1: Solubility of CBZ in various CBZ-PMs
Physical Mixture Code Ratio Solubility (mg/mL)
Pure CBZ CBZ 1 0.229
CBZ/PVP K30 PM1 1:0.25 0.301
CBZ/PVP K30/SLS PM2 1:0.20:0.010 0.411
CBZ/PVP K30/SLS PM3 1:0.15:0.015 0.522
Results revealed that, SLS in combination with PVP K30 improves the wettability and
contributes to solubility enhancement of CBZ. Therefore, through the combining effects of
solubility enhancement of both PVP K30 and SLS adding small amounts to tablet core can
improve release pattern. PM3 is used for the optimization of tablet core formulation.
Selection of Rate Controlling Polymer
In the present study for the selection of hydrophillic rate controlling polymer in the core
tablet, preliminary batches were prepared using 10% w/w of core weight of Hydroxyethyl
cellulose (Natrosol 250L), Hydroxy propyl methyl cellulose (Methocel K4M), Sodium
carboxymethyl cellulose (Sodium CMC) and Xanthan Gum (Xantural 75).
The concentration of drug, osmogen, other excipients in the core tablet, coating composition
www.wjpr.net Vol 6, Issue 12, 2017. 1064 for 24 h in 900 ml dissolution medium (deionized water) using USP Apparatus 1 (Basket)
with 100 rpm.
Table 2: Selection of hydrophilic rate controlling polymer.
Ingredients Weight (mg)
E1 E2 E3 E4
Intragranular Composition
Carbamazepine 200.00 200.00 200.00 200.00
Hydroxy propyl methyl cellulose
(Methocel K4M) 35.00 - - -
Hydroxyethyl cellulose (Natrosol 250L) - 35.00 - -
Sodium carboxymethyl cellulose - - 35.00 -
Xanthan Gum (Xantural 75) - - - 35.00
Sodium chloride 50.00 50.00 50.00 50.00
Lactose anhydrous 62.00 27.00 27.00 27.00
Polyvinylpyrrolidone (Kollidon 30) 30.00 30.00 30.00 30.00
Sodium lauryl sulfate 3.00 3.00 3.00 3.00
Purified water q.s. q.s. q.s. q.s.
Magnesium stearate 5.00 5.00 5.00 5.00
Core Tablet Weight 350.00 350.00 350.00 350.00
Extended Release Coating Composition
Cellulose acetate 398-10 23.27 23.27 23.27 23.27
Polyethylene glycol (PEG 8000) 1.23 1.23 1.23 1.23
Acetone q.s q.s q.s q.s
Water q.s q.s q.s q.s
Coated Tablet Weight 374.50 374.50 374.50 374.50
The selected polymers were evaluated for their effectiveness for delivering a poorly water
soluble CBZ from SCOP for parameters lag time (TL) and Q3, Q6, Q12, Q24 (% drug release
after 3h, 6h, 12h, and 24h, respectively).
The results revealed that the lag time for formulations containing Methocel K4M (E1),
Sodium CMC (E3) and Xantural 75 (E4) was 3h, 2h and 2h respectively. The shortest lag
time (TL: 1 h) and drug release for Q3, Q6, Q12 and Q24 from the formulationE2 comprising of
Hydroxyethyl cellulose (Natrosol 250L) as a hydrophilic rate controlling polymer showed
promising release for a period of 24h and was selected for further studies. The Q3, Q6, Q12 and
Q24 for formulation containing Natrosol 250L (E2) were 8.12%, 27.43%, 55.33% and
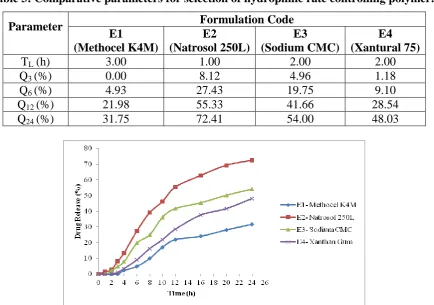
www.wjpr.net Vol 6, Issue 12, 2017. 1065 Table 3: Comparative parameters for selection of hydrophilic rate controlling polymer.
Parameter Formulation Code
E1
(Methocel K4M)
E2 (Natrosol 250L)
E3 (Sodium CMC)
E4 (Xantural 75)
TL (h) 3.00 1.00 2.00 2.00
Q3(%) 0.00 8.12 4.96 1.18
Q6 (%) 4.93 27.43 19.75 9.10
Q12 (%) 21.98 55.33 41.66 28.54
Q24 (%) 31.75 72.41 54.00 48.03
Fig. 3: Release profiles of formulations E1-E4 for selection of hydrophilic rate controlling polymer.
Hydroxyethyl cellulose (Natrosol 250L) with drug particles forms a viscous suspension in
water and expels the contents through the orifice with a relatively low force. The
effectiveness of HEC is possibly related to its rheological properties, rate of hydration and the
pressure produced during swelling maintained the integrity of the system for as period of 24
h. The uniform rate of swelling of the polymer ensured the drug is release at a relatively
constant rate.
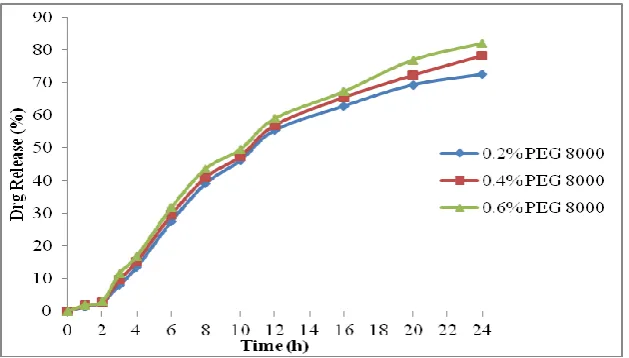
Effect of Concentration of Pore Former on Drug Release and Coat Consistency
To investigate the effect of concentration of pore former on drug release and coat
consistency, the core tablets of formulation E2 were coated with varying concentration of
pore former PEG 8000 and solid content, % weight gain and orifice diameter was kept
constant (Table 4).
www.wjpr.net Vol 6, Issue 12, 2017. 1066 Table 4: Coating compositions to study effect of concentration pore former on drug release.
Ingredients Formulation Code
E2A E2B E2C
Cellulose Acetate 398-10 (%) 3.80 3.60 3.40
PEG 8000 (%) 0.20 0.40 0.60
Acetone (w/w) q.s. q.s. q.s.
Purified water (w/w) q.s. q.s. q.s.
Parameter
CA : PEG 8000 95:05 90:10 85:15
Solid content (%) 4.00 4.00 4.00
Weight gain (%) 7.00 7.00 7.00
Orifice Diameter (mm) 0.6 0.6 0.6
The drug release increased with an increase in the level of PEG 8000 (Fig. 4). This could be
accounted to an increased hydrohilicity of semi-permeable membrane and rate of water
penetration across the membrane. The formulation E2B comprising of CA: PEG in the ratio
of 90:10 resulted in a good hydrophilic/lipophilic balance in semi-permeable structure and
[image:9.595.164.433.115.273.2]drug release profile with zero order kinetic (Table 5).
Fig. 4: Effect of concentration of pore former on drug release.
Table 5: Effect of concentration of pore former on coat consistency.
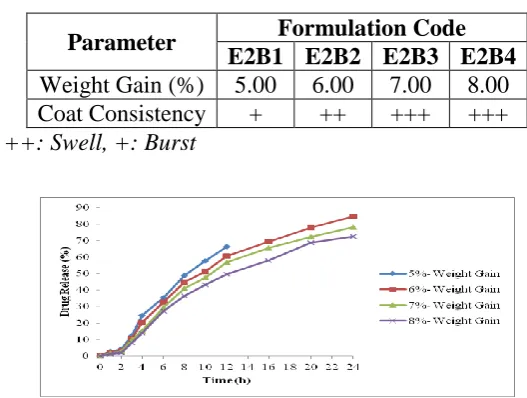
[image:9.595.142.457.401.580.2]www.wjpr.net Vol 6, Issue 12, 2017. 1067 Effect of % Weight Gain on Drug Release and Coat Consistency
To investigate the effect of weight gain on drug release and coat consistency, the core tablets
of formulation E2 were coated to achieve a weight gain of 5% w/w, 6% w/w, 7% w/w and
[image:10.595.132.459.206.371.2]8% w/w, respectively, whilst the solid content, CA:PEG ratio of 90:10 was kept constant
[image:10.595.142.452.209.369.2](Table 6).
Table 6: Coating compositions to study effect of % weight gain on drug release.
Ingredients Formulation Code
E2B1 E2B2 E2B3 E2B4
Cellulose Acetate 398-10 (%) 3.60 3.60 3.60 3.60
PEG 8000 (%) 0.40 0.40 0.40 0.40
Acetone (w/w) q.s. q.s. q.s. q.s.
Purified water (w/w) q.s. q.s. q.s. q.s.
Parameter
Weight gain (%) 5.00 6.00 7.00 8.00
Solid content (%) 4.00 4.00 4.00 4.00
CA:PEG 8000 90:10 90:10 90:10 90:10
Orifice Diameter (mm) 0.6 0.6 0.6 0.6
The results revealed that with an increase in the %weight gain the consistency of coat
improved (Table 7) but the drug release decreased (Fig. 5). The increase in the %weight gain
resulted in an increase in the resistance of the membrane to water diffusion but the rate of
imbibing water decreased leading to decrease in liquefaction rate of the tablet core and drug
release. The formulation E2B3 with 7% weight gain was further selected for the development
of SCOP with a desired consistency for a period of 24 h.
Table 7: Effect of % weight gain on coat consistency.
Parameter Formulation Code E2B1 E2B2 E2B3 E2B4
Weight Gain (%) 5.00 6.00 7.00 8.00
Coat Consistency + ++ +++ +++
+++: No change, ++: Swell, +: Burst
[image:10.595.159.423.534.733.2]www.wjpr.net Vol 6, Issue 12, 2017. 1068 Effect of Various Concentrations of Rate Controlling Polymer and Osmogen in Core Tablet on Drug Release
To study the effect of various concentrations of rate controlling polymer and osmogen in core
tablet on drug release a 32 factorial design of experiment was constructed where
concentration of hydrophillic rate controlling polymer Hydroxyethyl cellulose i.e. Natrosol
250L (%) and osmogen i.e. sodium chloride (%) in core tablet were selected as the factors.
All other formulation and processing variables were kept constant throughout the study
(Table 8).
Table 8: Formulation of factorial design formulations.
Ingredients (mg) Formulations
Core Tablet F1 F2 F3 F4 F5 F6 F7 F8 F9
Carbamazepine 200.0 200.0 200.0 200.0 200.0 200.0 200.0 200.0 200.0
Hydroxy ethyl cellulose 21.00 21.00 21.00 28.00 28.00 28.00 35.00 35.00 35.00
Sodium chloride 49.00 56.00 63.00 49.00 56.00 63.00 49.00 56.00 63.00
Lactose anhydrous 42.00 35.00 28.00 35.00 28.00 21.00 28.00 21.00 14.00
Polyvinylpyrrolidone 30.00 30.00 30.00 30.00 30.00 30.00 30.00 30.00 30.00
Sodium lauryl sulfate 3.00 3.00 3.00 3.00 3.00 3.00 3.00 3.00 3.00
Purified water q.s. q.s. q.s. q.s. q.s. q.s. q.s. q.s. q.s
Magnesium stearate 5.00 5.00 5.00 5.00 5.00 5.00 5.00 5.00 5.00
Core tablet weight (mg) 350.0 350.0 350.0 350.0 350.0 350.0 350.0 350.0 350.0
Extended release coating
Cellulose acetate 398-10 22.05 22.05 22.05 22.05 22.05 22.05 22.05 22.05 22.05
PEG 8000 2.45 2.45 2.45 2.45 2.45 2.45 2.45 2.45 2.45
Acetone q.s. q.s. q.s. q.s. q.s. q.s. q.s. q.s. q.s.
Water q.s. q.s. q.s. q.s. q.s. q.s. q.s. q.s. q.s.
Total weight (mg) 374.5 374.5 374.5 374.5 374.5 374.5 374.5 374.5 374.5
Drilling
Orifice Diameter (mm) 0.60 0.60 0.60 0.60 0.60 0.60 0.60 0.60 0.60
Dissolution Studies
Factorial design batches of SCOP were subjected to in vitro drug release studies in 900 mL
deionized water using USP Apparatus 1 (Basket) at 100 rpm for 24 h. Fig. 6 summarizes the
dissolution profiles of factorial design batches. From the dissolution profiles it is evident that
an increase in % of osmogen (sodium chloride) resulted in an increase in the drug release
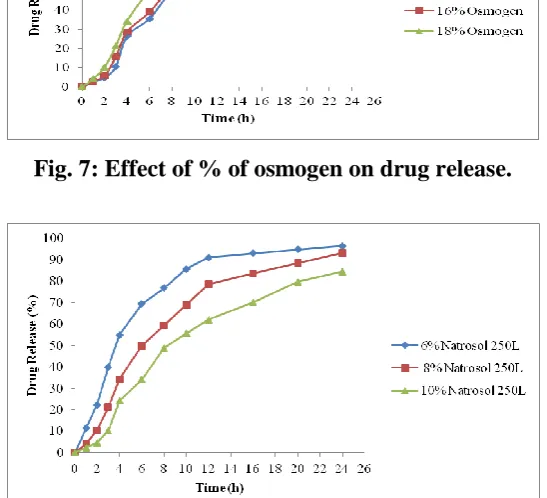
(Fig. 7). The increase in % of rate controlling polymer (Natrosol 250L) in the core tablet
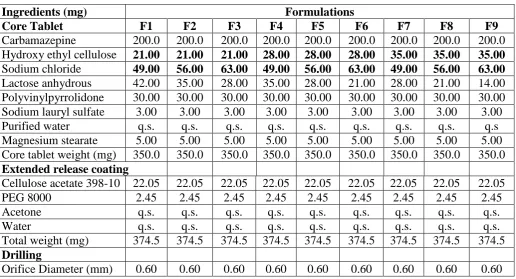
showed decrease in drug release (Fig. 8). The formulation F6 meets USP Dissolution Test
[image:11.595.42.559.268.547.2]www.wjpr.net Vol 6, Issue 12, 2017. 1069 Fig. 6: Dissolution profiles of factorial design batches (F1-F9).
Fig. 7: Effect of % of osmogen on drug release.
Fig. 8: Effect of % of rate controlling polymer on drug release
Analysis of Data by Design Expert Software
The 32 factorial design was selected to study the effect of independent variables % of
Natrosol 250L (X1), % of Sodium chloride (X2) in core tableton dependent variables Q3, Q6,
Q12 and Q24. A statistical model incorporating interactive and polynomial terms was utilized
to evaluate the responses.
[image:12.595.161.435.303.552.2]www.wjpr.net Vol 6, Issue 12, 2017. 1070 Where, Y is the dependent variable, b0 is the arithmetic mean response of the nine runs and
bi(b1,b2,,b12,b11 and b22) is the estimated coefficient for the corresponding factor Xi
(X1,X2,X12,X11,and X22), which represents the average results of changing one factor at a time
from its low to high value.The interaction term (X1X2) depicts the changes in the response
when two factors are simultaneously changed. The polynomial terms (X12 and X22) are
included to investigate nonlinearity. The Q3, Q6, Q12 and Q24 for the nine formulations of
design showed a wide variation. The responses of the formulations prepared by 32 factorial
designs were observed. The responses clearly indicated that the Q3, Q6, Q12 and Q24 values are
strongly dependent on the selected independent variables. The fitted regression equations
relating the responses Q3, Q6, Q12 and Q24 are shown in the following equations, respectively.
Final Equations in Terms of Coded Factors:
Q3 = 15.56 – 14.09 X1 + 2.48 X2 – 0.52 X1X2 + 7.99 X12 + 0.42 X22
Final equations in Terms of Actual Factors:
Q3 =15.5644 – 14.0916*Natrosol 250L +2.4800*Sodium chloride – 0.5175*Natrosol
250L*Sodium chloride + 7.9883 *Natrosol 250L2 + 0.4233 *Sodium chloride2
(r2=0.9822)
Final Equations in Terms of Coded Factors:
Q6 = 40.76 – 17.35 X1 + 3.99 X2 – 0.12 X1X2 + 7.95 X12 + 1.07 X22
Final equations in Terms of Actual Factors:
Q6 = 40.7600–17.3533*Natrosol 250L +3.9900*Sodium chloride – 0.1150*Natrosol
250L*Sodium chloride + 7.9500 *Natrosol 250L2 + 1.0700 *Sodium chloride2
(r2=0.9818)
Final Equations in Terms of Coded Factors:
Q12 = 68.84 – 13.63 X1 + 4.65 X2 – 0.51 X1X2 + 3.90 X12 + 1.20 X22
Final equations in Terms of Actual Factors:
Q12= 68.8366– 13.6266*Natrosol 250L +4.6500*Sodium chloride – 0.5100*Natrosol
250L*Sodium chloride + 3.9000 *Natrosol 250L2 + 1.2000 *Sodium chloride2
(r2=0.9718)
Final Equations in Terms of Coded Factors:
www.wjpr.net Vol 6, Issue 12, 2017. 1071 Final equations in Terms of Actual Factors:
Q24= 89.1477– 6.4183*Natrosol 250L +2.9350*Sodium chloride + 0.4825*Natrosol
250L*Sodium chloride – 1.1516 *Natrosol 250L2 + 0.0583 *Sodium chloride2
(r2=0.9901)
The regression coefficient values are the estimates of the model fitting. The r2 was high
indicating the adequate fitting of the quadratic model. The polynomial equations can also be
used to draw conclusions considering the magnitude of co-efficient and the mathematical sign
it carries; i.e. positive or negative.
The first variable X1 (% of Natrosol 250L) in core tablet showed negative coefficient in case
of responses Q3, Q6, Q12 and Q24 i.e. increase in % of Natrosol 250L resulted in the decrease
drug release. The second variable X2 (% Sodium chloride) showed positive coefficient for
responses Q3, Q6, Q12 and Q24 i.e. increase in % of Sodium chloride resulted in the increase in
the drug release.
ANOVA Study
The evaluation and interpretation of research findings are important and the significance of
p-value is valuable in research findings. The coefficients of X1 and X2 were found to be
significant at p<0.05, hence confirmed the significant effect of both the variables on the
selected responses. Overall both the variables caused significant change in the responses.
ANOVA and Multiple regression analysis were done using Stat-Ease Design Expert 7.1.4
software.
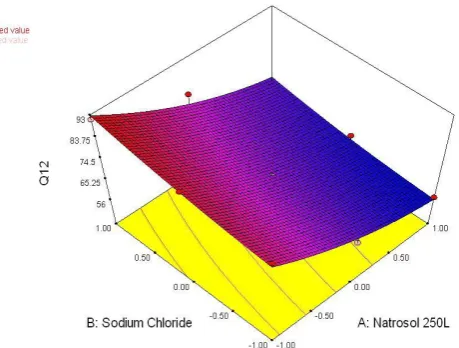
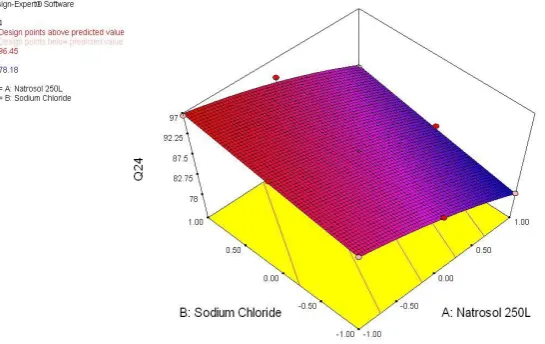
Response Surface Plots
The response surface plots were generated using Design Expert 7.1.4 software (Fig. 9-12) to
observe the effect of independent variables on the response studied such as Q3, Q6, Q12 and
Q24 respectively. The response surface plots revealed that the various combinations of
independent variables X1 and X2 may satisfy any specific requirement (i.e. maximum drug
www.wjpr.net Vol 6, Issue 12, 2017. 1072 Fig. 9: Response surface plot of Q3
Fig. 10: Response surface plot of Q6
[image:15.595.201.431.561.735.2]www.wjpr.net Vol 6, Issue 12, 2017. 1073 Fig. 12: Response surface plot of Q24
Optimization (Model Validation)
The two formulations MVF1 and MVF2 were formulated for the model validation. The tablet
properties were evaluated and found within limits (Table 9, 10). The close resemblance
between predicted and observed response values indicates the validity of the generated model
[image:16.595.74.509.436.500.2](Table 11).
Table 9: Core tablet properties evaluation.
Formulation Code
Thickness (mm)
Hardness (Kg/ cm2)
Friability (%)
Drug Content (%)
MVF1 5.463 ± 0.012 7.830 ± 0.018 0.157 ± 0.012 99.478 ± 0.024 MVF2 5.489 ± 0.027 7.586 ± 0.024 0.148 ± 0.015 99.589 ± 0.048 All reading taken in triplicate, n ± SD
Table 10: Coated tablet properties evaluation of formulations MVF1 and MVF2.
Formulation Code Average Weight (mg) Thickness (mm) Diameter (mm) MVF1 375.667 ± 0.011 5.793 ± 0.023 9.698 ± 0.012 MVF2 376.667 ± 0.012 5.796 ± 0.025 9.745 ± 0.019 All reading taken in triplicate, n ± SD
Table 11: Comparison of predicted and experimental values of MVF1 and MVF2.
Responses MVF1 MVF2
Predicted Experimental Predicted Experimental
Q3 (%) 35.00 37.30 15.56 14.92
Q6 (%) 63.13 65.98 40.76 38.65
Q12 (%) 84.46 86.88 68.83 66.98
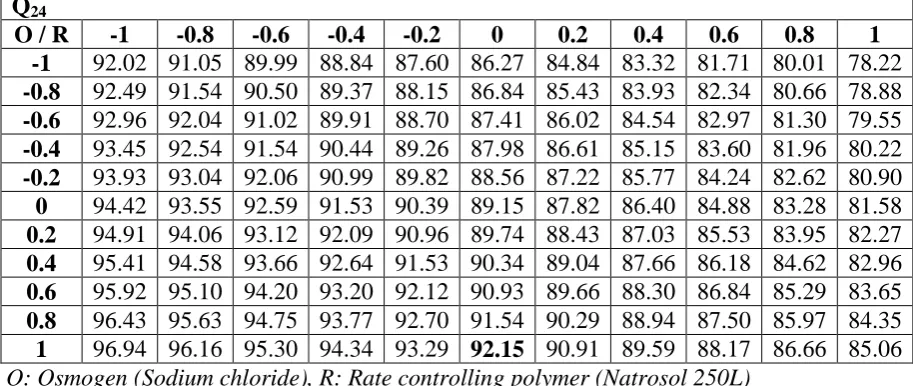
www.wjpr.net Vol 6, Issue 12, 2017. 1074 Grid Analysis
The grid analysis was performed for selection of the optimized level for Q3, Q6 Q12 and Q24.
The best results for Q3, Q6, Q12 and Q24 was obtained at the middle level concentration of %
Natrosol 250L (8% w/w) and upper level concentration of % sodium chloride (18% w/w) in
core tablet which revealed the release profile (Q3, Q6, Q12 and Q24) as per the USP acceptance
criteria (Table 12-15). The formulation F6 was selected as optimized formulation.
Table 12: Search for optimized level for Q3.
Q3
O / R -1 -0.8 -0.6 -0.4 -0.2 0 0.2 0.4 0.6 0.8 1
-1 35.06 29.47 24.52 20.21 16.53 13.50 11.11 9.35 8.23 7.76 7.92
-0.8 35.51 29.90 24.93 20.59 16.90 13.84 11.43 9.65 8.52 8.02 8.16 -0.6 35.99 30.36 25.37 21.01 17.30 14.22 11.79 9.99 8.83 8.31 8.44 -0.4 36.51 30.85 25.84 21.47 17.73 14.64 12.18 10.36 9.18 8.64 8.74 -0.2 37.06 31.38 26.35 21.95 18.20 15.08 12.60 10.76 9.57 9.01 9.08
0 37.64 31.95 26.89 22.47 18.70 15.56 13.06 11.20 9.98 9.40 9.46
0.2 38.26 32.54 27.47 23.03 19.23 16.07 13.55 11.67 10.43 9.83 9.87
0.4 38.91 33.17 28.07 23.62 19.80 16.62 14.08 12.18 10.92 10.29 10.31
0.6 39.59 33.83 28.72 24.24 20.40 17.20 14.64 12.72 11.43 10.79 10.79
0.8 40.31 34.53 29.39 24.89 21.03 17.81 15.23 13.29 11.99 11.32 11.30
1 41.06 35.26 30.10 25.58 21.70 18.46 15.86 13.89 12.57 11.89 11.84
O: Osmogen (Sodium chloride), R: Rate controlling polymer (Natrosol 250L)
Table 13: Search for optimized level for Q6.
Q6
O / R -1 -0.8 -0.6 -0.4 -0.2 0 0.2 0.4 0.6 0.8 1
-1 70.02 56.71 51.04 46.00 41.60 37.84 34.71 32.22 30.36 29.14 28.56
-0.8 70.46 57.14 51.47 46.43 42.02 38.25 35.12 32.62 30.76 29.54 28.95 -0.6 70.98 57.66 51.98 46.93 42.52 38.75 35.61 33.11 31.25 30.02 29.42 -0.4 71.59 58.26 52.58 47.53 43.11 39.34 36.19 33.69 31.82 30.58 29.98 -0.2 72.28 58.95 53.26 48.21 43.79 40.00 36.86 34.35 32.47 31.23 30.63
0 73.06 59.73 54.03 48.97 44.55 40.76 37.61 35.09 33.21 31.97 31.36
0.2 73.92 60.59 54.89 49.82 45.39 41.60 38.44 35.92 34.04 32.79 32.18
0.4 74.88 61.53 55.83 50.76 46.32 42.53 39.37 36.84 34.95 33.70 33.08
0.6 75.91 62.56 56.85 51.78 47.34 43.54 40.37 37.84 35.95 34.69 34.07
0.8 77.03 63.68 57.97 52.89 48.44 44.64 41.47 38.93 37.03 35.77 35.14
1 78.24 64.88 59.16 54.08 49.63 45.82 42.64 40.10 38.20 36.93 36.30
www.wjpr.net Vol 6, Issue 12, 2017. 1075 Table 14: Search for optimized level for Q12.
Q12
O / R -1 -0.8 -0.6 -0.4 -0.2 0 0.2 0.4 0.6 0.8 1
-1 82.41 78.38 74.67 71.26 68.17 65.39 62.92 60.77 58.92 57.39 56.17
-0.8 83.01 78.96 75.23 71.80 68.69 65.89 63.40 61.22 59.36 57.81 56.57 -0.6 83.71 79.64 75.88 72.44 69.30 66.48 63.97 61.78 59.89 58.32 57.06 -0.4 84.50 80.41 76.63 73.17 70.01 67.17 64.64 62.43 60.52 58.93 57.65 -0.2 85.39 81.28 77.48 73.99 70.82 67.96 65.41 63.17 61.25 59.63 58.33
0 86.37 82.24 78.42 74.92 71.72 68.84 66.27 64.01 62.07 60.43 59.11
0.2 87.45 83.30 79.46 75.93 72.72 69.82 67.23 64.95 62.98 61.33 59.99
0.4 88.63 84.46 80.60 77.05 73.81 70.89 68.28 65.98 64.00 62.32 60.96
0.6 89.90 85.71 81.83 78.26 75.01 72.06 69.43 67.11 65.10 63.41 62.03
0.8 91.27 87.05 83.15 79.57 76.29 73.33 70.68 68.34 66.31 64.59 63.19
1 92.73 88.50 84.58 80.97 77.67 74.69 72.02 69.66 67.61 65.87 64.45
O: Osmogen (Sodium chloride), R: Rate controlling polymer (Natrosol 250L)
Table 15: Search for optimized level for Q24.
Q24
O / R -1 -0.8 -0.6 -0.4 -0.2 0 0.2 0.4 0.6 0.8 1
-1 92.02 91.05 89.99 88.84 87.60 86.27 84.84 83.32 81.71 80.01 78.22
-0.8 92.49 91.54 90.50 89.37 88.15 86.84 85.43 83.93 82.34 80.66 78.88 -0.6 92.96 92.04 91.02 89.91 88.70 87.41 86.02 84.54 82.97 81.30 79.55 -0.4 93.45 92.54 91.54 90.44 89.26 87.98 86.61 85.15 83.60 81.96 80.22 -0.2 93.93 93.04 92.06 90.99 89.82 88.56 87.22 85.77 84.24 82.62 80.90
0 94.42 93.55 92.59 91.53 90.39 89.15 87.82 86.40 84.88 83.28 81.58
0.2 94.91 94.06 93.12 92.09 90.96 89.74 88.43 87.03 85.53 83.95 82.27
0.4 95.41 94.58 93.66 92.64 91.53 90.34 89.04 87.66 86.18 84.62 82.96
0.6 95.92 95.10 94.20 93.20 92.12 90.93 89.66 88.30 86.84 85.29 83.65
0.8 96.43 95.63 94.75 93.77 92.70 91.54 90.29 88.94 87.50 85.97 84.35
1 96.94 96.16 95.30 94.34 93.29 92.15 90.91 89.59 88.17 86.66 85.06
O: Osmogen (Sodium chloride), R: Rate controlling polymer (Natrosol 250L)
Effect of pH on Drug Release
The effect of pH on drug release for the optimized formulation (F6) was studied by
performing dissolution studies in 0.1 N HCl, pH 4.5 acetate buffer and pH 6.8 phosphate
buffer for 24 h. The system was independent of the pH since no significance in drug release
was observed (Fig. 13). This was an important performance test because, if the semi
permeable membrane was truly selective, diffusion of ions into the osmotic pump would be
negligible which should affect the release profiles. In other words, the osmotic tablets
exhibited media independent release. Thus, the fluid in different parts of GI tract will scarcely
www.wjpr.net Vol 6, Issue 12, 2017. 1076 Fig. 13: Effect of pH on drug release.
Effect of Agitation Intensity on Drug Release
To study the effect of agitation intensity, optimized formulation (F6) was subjected to
dissolution in deionized water at 50, 100 and 150 rpm. There was no significant difference in
the release profile of the system with change in agitation intensity (Fig. 14).
Fig. 14: Effect of agitation intensity on drug release.
Effect of Orifice Diameter on Drug Release
The effect of orifice diameter was studied on coated tablets of optimized formulation (F6)
were mechanically drilled on one side with 0.4 mm, 0.6 mm and 0.8 mm drill.
The drug release increased, while lag time decreased with an increase in orifice diameter
from 0.4 mm to 0.8 mm, respectively (Fig. 15). The orifice diameter 0.6 mm showed
[image:19.595.156.441.361.527.2]www.wjpr.net Vol 6, Issue 12, 2017. 1077 Fig. 15: Effect of orifice diameter on drug release.
Surface Morphology Study
To evaluate the surface morphology of the coating membrane, surfaces of the optimized
formulation (F6) were examined using scanning electron microscopy (SEM) both before and
after dissolution (JEOL JSM 6380) (Fig. 16). Membranes were dried at 45ºC for 12 hours and
stored between sheets of wax paper in a dessicator until examination.
Fig. 16(a) shows membrane structure before dissolution, initially the surface of coated tablets
was smooth before coming into contact with aqueous environment and coats appeared to be
free of pores. A microporous structure of the membrane after dissolution was observed from
Fig. 16(b) which shows SEM of membrane after dissolution. The significant porosity has
resulted due to leaching of water-soluble additive i.e. PEG 8000 during dissolution.
[image:20.595.127.467.513.633.2]
Fig. 16: SEM microphotographs of SCOP tablet at 2500x (a) before dissolution, (b) after dissolution.
Stability Study
The optimized formulation (F6) was packed in aluminium foil and subjected to stability
www.wjpr.net Vol 6, Issue 12, 2017. 1078 withdrawn at time intervals of 1, 2 and 3 month. The samples were evaluated for appearance,
assay and in vitro release profile (Table 16).
Table 16: Stability study.
Tests Limits Initial 1 Month 2 Months 3 Months
Appearance White to off white Complies Complies Complies Complies
Assay (%)
Carbamazepine USP (NLT 90% to NMT 110% of labeled amount of Carbamazepine)
101.20 99.63 100.60 100.18
Drug
Release (%)
3h =10 to 35 9h=35 to 65 12h =65 to 90 24 h =NLT 75
21.24 49.89 78.66 93.12 21.18 49.75 78.52 93.10 20.95 48.91 77.96 92.98 21.15 49.50 77.92 92.94 CONCLUSION
The solubility of poorly water soluble CBZ is enhanced through the incorporation of
optimized concentration of PVP K30 and SLS in the core tablet. The statistical approach for
formulation optimization is a useful tool, particularly when two or more variables are to be
evaluated simultaneously. A 32 factorial design was performed, and the desired release of
CBZ from the SCOP was achieved through careful monitoring of the selected formulation
variables. The variables Hydroxyethyl cellulose i.e. Natrosol 250L (%) and osmogen i.e.
sodium chloride (%) in core tablet evaluated in the study exhibited significant effect on the
responses Q3, Q6, Q12 and Q24 of the formulations. It was evident that an increase in % of
osmogen (sodium chloride) resulted in an increase in the drug release. The increase in % of
rate controlling polymer (Natrosol 250L) in the core tablet showed decrease in drug release.
Increase in concentration of pore former the drug release was found to be increased. The
results revealed that with an increase in the %weight gain the consistency of coat improved
but the drug release decreased. The grid analysis was performed for the selection of
optimized level for release profile (Q3, Q6, Q12 and Q24) revealed F6 as the optimized
formulation. The best results for Q3, Q6, Q12 and Q24 was obtained at the middle level
concentration of % Natrosol 250L (8% w/w) and upper level concentration of % sodium
chloride (18% w/w) in core tablet showed the release profile (Q3, Q6, Q12 and Q24) as per the
USP acceptance criteria. Hydroxyethyl cellulose (Natrosol 250L) with drug particles forms a
viscous suspension and prevents settling of drug particles inside the core tablet and ensured
the drug is release at a relatively constant rate. The optimized formulation (F6) delivered
www.wjpr.net Vol 6, Issue 12, 2017. 1079 diameter is one of the critical parameter that greatly influences release rate and 0.6 mm is
selected as optimized diameter to achieve desired drug release from the SCOP. Overall, a
controlled release SCOP system for CBZ has been successfully developed using the 32
factorial design. Finally, it is concluded that release of CBZ is significantly controlled for 24
h from the single core osmotic pump tablet and thus it is a promising approach for the better
management of partial and tonic-clonic seizures.
ACKNOWLEDGEMENT
We thank to Principal, Government College of Pharmacy Aurangabad for support and
institutional facility.
REFERENCES
1. Li X, Jasti BR. Osmotic Controlled Drug Delivery Systems, In: Design of Controlled
Release of Drug Delivery Systems. McGraw Hill, 2006; 203-29.
2. Vincent M, Joerg O, Nicoletta L, Robert G. Oral Osmotically Driven Systems: 30 Years
of Development and Clinical Use. European Journal of Pharmaceutics and
Biopharmaceutics, 2009; 73: 311–23.
3. Hui HR, Robinson JR, Lee VH. Design and fabrication of oral controlled release drug
delivery systems. (Second edition), New York; Marcel Dekker, 1987; 373-74.
4. Verma RK, Mishra B, Garg S. Osmotically Controlled Oral Drug Delivery. Drug
Development and Industrial Pharmacy, 2000; 26(7): 695-708.
5. Vyas SP, Khar RK. Controlled Drug Delivery: Concepts and Advances. (First Edition),
New Delhi; Vallabh Prakashan, 2002; 477-502.
6. Tripathi, K. D. Essential of Medical Pharmacology. (Sixth Edition), New Delhi; Jaypee
Brother Medical Publishers, 2008; 401.
7. Provisional BCS Classification, http://www.tsrlinc.net/search.cfm.
8. Hoppener RJ, Kuyer A, Meijer JW, Hulsman J. Correlation between daily fluctuations of
carbamazepine serum levels and intermittent side effects. Epilepsia, 1980; 21: 341–50.
9. Johannessen SI, Gerna M, Bakke J, Strandjord RE, Morselli PL. CSF concentrations and
serum protein binding of Carbamazepine and carbamazepine-10,11-epoxide in epileptic
patients. Brit J Clin Pharmacol, 197; 3: 575–82.
10. Eeg-Olofsson O, Nilsson HL, Tonnby B, Arvidsson J, Grahn PA, Gylje H, Larsson C,
www.wjpr.net Vol 6, Issue 12, 2017. 1080 plasma and saliva in children with epilepsy: A comparison between conventional and
slow-release formulations. J Child Neurol, 1990; 5: 159–65.
11. Mirza WU, Rak IW, Thadani VM, Cereghino JJ, Garnett WR, Brown LM, Zhang Y,
Belendiuk GW. Six-month evaluation of Carbatrol (extended-release carbamazepine) in
complex partial seizures. Neurology, 1998; 51: 1727–29.
12. Miller AD, Krauss GL, Hamzeh FM. Improved CNS tolerability following conversion
from immediate- to extended-release carbamazepine. Acta Neurol Scan, 2004; 109:
374–77.
13. Emilio P. Extended-release formulations of antiepileptic drugs: rationale and comparative
value. Epilepsy Currents, 2009; 9(6): 153–57
14. Deshmukh V, Pawar A, Deshmukh T, Deshmukh M, Patil RY. Preparation and
evaluation of slow release carbamazepine alginate-talc beads. Current Pharmaceutical
Research, 2011; 1(3): 271-9.
15. Wikipedia, https://en.wikipedia.org/wiki/Carbamazepine.
16. Katzhendler I, Friedman M. Zero-order sustained release matrix tablet formulations of
carbamazepine. US Patent 5980942, 1999.
17. Puthli, P., S.; Menon, G., S. Oral osmotic controlled drug delivery system for a sparingly
soluble drug. US Patent 6534090, 2003.
18. Khanna, S.C.; Ruettimann, T. Oral therapeutic system having systemic action. US Patent
4857336, 1987.
19. Lu EX, Jiang ZQ, Zhang QZ, Jiang XG. A water-insoluble drug monolithic osmotic tablet
system utilizing gum Arabic as an osmotic, suspending and expanding agent. J. Control.
Release, 2003; 92(3): 375-82.
20. Liu X, Chen, D, Zhang R. Evaluation of monolithic osmotic tablet system for nifedipine
delivery in vitro and in vivo. Drug Dev. Ind. Pharm, 2003; 29(7): 813–19.
21. Shokri J, Ahmadi P, Rashidi P, Shahsavari M, Rajabi-Siahboomi A, Nokhodchi A.
Swellable elementary osmotic pump (SEOP): an effective device for delivery of poorly
water-soluble drugs. Eur. J. Pharm. Biopharm, 2008; 68(2): 289–97.
22. Kenneth C, Waterman EL. Osmotic delivery system. US Patent 0161882 A1, 2003.
23. Anne B, Rebecca C. Osmotic delivery system. US Patent 0175346 A1, 2003.
24. Borse MP, Mulgund SV. UV spectrophotometric estimation of carbamazepine in bulk
and tablet dosage form. Scholars Research Library Der Pharmacia Letter, 2015; 7(5):
www.wjpr.net Vol 6, Issue 12, 2017. 1081 25. Hadjira R, Jumah MMS, Eltayeb SE, Narimane L, Jie Z, Qineng P. Carbamazepine
solubility enhancement in tandem with swellable polymer osmotic pump tablet: a
promising approach for extended delivery of poorly water-soluble drugs. Asian Journal of
Pharmaceutical Sciences, 2014; 9: 146-54.
26. Higuchi T, Connors KA. Phase-solubility techniques. Adv Anal Chem Instrum, 1965; 4:
117-212.
27. United States pharmacopeia and national formulary (USP 37-NF 32). Rockville (MD):