www.wjpr.net Vol 4, Issue 06, 2015.
1671
“
“FORMULATION, DEVELOPMENT AND ABSORPTION
ENHANCEMENT OF METFORMIN HYDROCHLORIDE BY USING
SPRAY DRYING TECHNIQUE
”
”
Karale Amit Ashok* and Ambekar Abdul Wahid
Department of Pharmaceutics, P.D.V.V.P.F’s College of Pharmacy, Vilad Ghat, Ahmednagar
- 414111, Maharashtra India.
ABSTRACT
The present study is to formulate an anti-diabetic tablet containing
permeation enhancer which enhances gastrointestinal absorption of
poorly absorbable anti-diabetic drug. Metformin hydrochloride (HCl)
is a BCS class III drug which has high solubility and poor intestinal
absorption characteristic. The gastrointestinal absorption of metformin
hydrochloride was enhanced using permeation enhancer like
cyclodextrin. The permeation of drug was measured by everted sac
technique using chicken intestine. The drug was absorbed through
chicken intestine mainly by passive diffusion mechanism. The
absorbed drug was determined by using U.V Visible
Spectrophotometer at 234nm. After analyzing the results it was found
that cyclodextrin enhance the absorption of metformin hydrochloride
from chicken intestine. This cyclodextrin was used to reduce dose of
metformin hydrochloride in tablet dosage form. For optimizing the dose of metformin
hydrochloride, different batches of different permeation enhancer were used and tablets were
prepared by direct compression method with different concentration of permeation enhancer
and metformin hydrochloride. Metformin hydrochloride exhibits poor compressibility during
compaction, often resulting in weak and unacceptable tablets with a high tendency to cap.
The purpose was to develop directly compressible metformin hydrochloride by the
spray-drying technique in the presence of polymer. This help in increase in the flow property of
metformin HCL. The permeability of this drug was increased by the addition of cyclodextrin
which acts as a permeation enhancer. This in turn results in better absorption enhancement.
Volume 4, Issue 6, 1671-1693. Research Article ISSN 2277– 7105
*Correspondence for
Author
Karale Amit Ashok
Department of
Pharmaceutics,
P.D.V.V.P.F’s College of
Pharmacy, Vilad Ghat,
Ahmednagar - 414111,
Maharashtra India. Article Received on 04 April 2015,
www.wjpr.net Vol 4, Issue 06, 2015.
1672 KEYWORDS: Metformin HCl, Spray drying, Permeation enhancer, Cyclodextrin, Everted sac method.
INTRODUCTION
Diabetes mellitus is a chronic metabolic disorder, resulting from insulin deficiency,
characterized by hyperglycemia, altered metabolism of carbohydrates, protein and lipids, and
an increased risk of vascular complications. Predisposition to diabetes mellitus is inherited,
although the genetic factors are complex. This is one of the most widely studied, researched
and advance areas in the medical field. Millions of people have diabetes. Even children suffer
from this disease. That is why I feel that we are fortunate that our disease has been diagnosed
at right time. At present there is no cure in any of the apathies for this disease. But with
modern medical advancement you can definitely live near normal healthy life. In normal
patients Fasting plasma glucose is < 100 mg/dL and Random plasma glucose is < 130 mg/dL
after diabetes it is ≥ 126 mg/dL and ≥ 200 mg/dL.[1,2,3,4]
Metformin HCL is an anti-hyperglycemic agent, which improves glucose tolerance in type II
diabetes. It has been reported that the absolute bioavailability of Metformin HCL when given
orally is 50–60%. Biological half-life of Metformin HCL is 1.5–1.6 h and the main site of its
absorption is proximal small intestines. When a spray dried Metformin HCL is mixed with
the permeation enhancer, then the drug would be available in the dissolved form at the main
site of its absorption i.e., proximal small intestines. This would lead to improvement in the
bioavailability of the drug. In this way it stands an advantage over sustained dosage form,
which needs to be administered with a high dose twice a day.[6]
Spray drying is a unit operation in which a liquid stream (solution, suspension or emulsion) is
continuously divided into very fine droplets (a process known as atomization) into a drying
chamber. Once the droplets meet the warm air in the drying chamber they rapidly evaporate
to form dry particles, which are separated from the drying gas using a cyclone or a bag-filter.
Hence the spray drying process can be described as consisting of four events.[7,8]
i. Atomization of the liquid into droplets
ii. Contact of the droplets with the warm drying gas
iii. Rapid evaporation of the droplets to form dry particles
www.wjpr.net Vol 4, Issue 06, 2015.
1673 Fig.No.1: Schematic overview of a spray dryer.
Studied had been done to determine the barriers for the intestinal permeability of drugs. The
location of these barriers may be in the unstirred water layer, the mucous layer, the apical and
basal cell membrane and cell contents, the tight junctions and the wall of lymph and
capillaries. Metabolic barriers of the mucosal peptidases are the other barriers which
extensively condense the bioavailability of peptides and proteins.[9]
For this study intestinal absorption (permeability) studies are to be performed. These studies
based on isolated intestinal sacs are routinely performed. To the best of our knowledge in
vitro absorption studies using chicken intestine have less frequently used . So, in the present
work chicken’s small intestine was used for intestinal absorption studies of prepared tablets
based on the assumption that membrane permeability of drugs is not species dependent since
the composition of plasma membrane of intestinal epithelial cells is similar across the
species.[9,10]
MATERIALS & METHODS
Metformin hydrochloride was provided as gift samples from Wockhardt pvt.ltd, Aurangabad.
All other chemicals used were of analytical grade. The instruments used are eight station
punching machine (chamunda), eight stage tablet dissolution apparatus (Electrolab, Mumbai),
UV Spectrophotometer (Schimadzu, Japan), Fourier Transform Infrared spectrophotometer
www.wjpr.net Vol 4, Issue 06, 2015.
1674 METHODS
Preparation of absorption enhanced Metformin tablets
Table no. 10 enlists the composition of absorption enhanced Metformin oral tablets prepared
using different absorption (permeation) enhancer. Lactose was added as filler, Crospovidone
powder as disintegrant, talc as glidant and magnesium stearate as lubricant. Direct
compression method is selected for tablet punching. The powder is compressed in to tablets
(500mg) by using eight station punching machine.
Preparation of Spray dried Metformin HCL powder[30]
Spray-drying of Metformin HCL is done by mixing it with Sodium lauryl sulfate
(SLS).Samples of Metformin HCL was dissolved in Methanol with SLS to increase the flow
property of the drug. The ratio selected is 1:1 ratio of drug and SLS both dissolved in
methanol and then run for spray drying of the solution. Spray-drying was carried out using
Labultima – 222 spray dryer available in college. The product was collected form the
collector bottle after the assembly was stopped. This powder was then used for the tablet
formulation using permeation enhancer.
Spray-drying operating condition • Inlet temperature - 1800C • Outlet temp. - 170 0C • Cooling temp. - 110 0C • Inlet High - 200 0C • Outlet High - 1900C
• Aspirator flow rate – 40 Nm3/ hrs. • Feed flow rate – 1 ml/min.
• D Block ON -1 sec • D Block ON -90 sec • Cycle time – 400 min.
RESULT OF EXPERIMENTAL WORK
The immediate release tablets of Metformin HCL was prepared and evaluated for their use as
Absorption enhancement of drug delivery systems to increase its bioavailability &
permeation. In the present study, nine batches were optimized into three formulae and the
composition of all the batches are shown in Table No.10 respectively. The prepared tablet of
www.wjpr.net Vol 4, Issue 06, 2015.
1675 1.1. Preformulation study of Drug[18,19,20]
1.1 Colour
The sample of the drug Metformin HCL was found to be white crystalline powder. the color
and odor complies with the description that is found in the literature.
[image:5.595.68.437.187.294.2]1.2.Solubility
Table No. 1: Solubility Profile of Metformin HCL.
Sr. No. Solvent Solubility μg/ml
1. Water 386.55
2. 6.8 pH phosphate buffer 515.64
3. 0.1 N HCL 493.00
1.3: Melting point
The melting point of the drug matched with the value found in literature.
Table No. 2: Melting Point of Metformin HCL
1.4 : Assay
The percentage purity of given drug Metformin HCL was found to be 99.36% which
complies the B.P standards.
[image:5.595.131.467.564.738.2]1.5 : UV Spectroscopy[22,23,24] 1.5.1 Determination of λmax
Fig. No. 1: UV Spectrum of Metformin HCL at 234 nm.
Drug Melting Point range
www.wjpr.net Vol 4, Issue 06, 2015.
1676 1.5.2. Calibration Curve of Metformin HCL in Distilled Water
Calibration Curve y = 0.1626x + 0.2865 R2 = 0.9948
0 0.5 1 1.5 2 2.5 3
0 2 4 6 8 10 12 14 16 18
Concentration in ppm.
A
b
so
rb
an
[image:6.595.109.485.99.283.2]ce
Fig. No. 2: Calibration curve of Metformin HCL in distilled water.
Calibration curve of Metformin HCL was performed in Distilled water. The calibration
curves of Metformin HCL in this media was found to be linear in the concentration range of
2-16 µg/ml having coefficient of regression value R2=0.9948 and slope is m= 0.1626.
1.5.3 Calibration Curve of Metformin HCL in Phosphate Buffer pH-6.8
Calibration Curve y = 0.1474x - 0.1156
R2 = 0.9917
0 0.5 1 1.5 2 2.5
0 2 4 6 8 10 12 14 16 18
Concentration in ppm.
A
b
so
rb
an
ce
Fig. No. 3 : Calibration curve of Metformin HCL in phosphate buffer pH 6.8.
Calibration curve of Metformin HCL was performed in phosphate buffer pH 6.8. The
calibration curves of Metformin HCL in this media was found to be linear in the
[image:6.595.105.493.441.610.2]www.wjpr.net Vol 4, Issue 06, 2015.
1677 1.5.3. Calibration Curve of Metformin HCL in 0.1 N HCL
Calibration Curve y = 0.11x + 0.5705 R2 = 0.9932
0 0.5 1 1.5 2 2.5
0 2 4 6 8 10 12 14 16 18
Concentration in ppm.
A
b
s
o
rb
a
n
c
[image:7.595.74.518.406.675.2]e
Fig. No. 4: Calibration Curve of Metformin HCL in 0.1 N HCL.
Calibration curve of Metformin HCL was performed in 0.1 N HCL. The calibration curves of
Metformin HCL in this media was found to be linear in the concentration range of 2-16
µg/ml having coefficient of regression value R2=0.9932 and slope is m= 0.11.
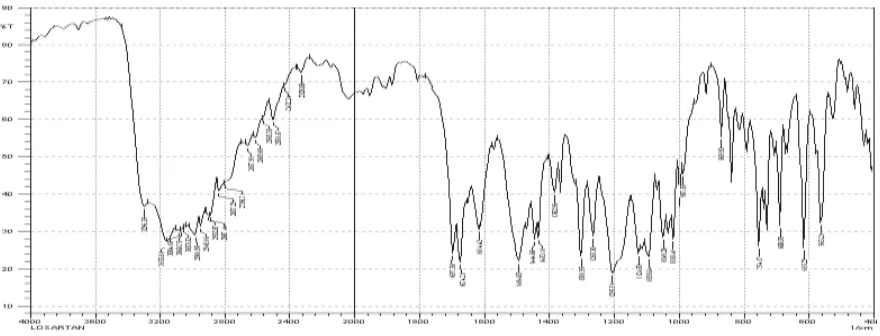
6. Fourier Transform Infrared Spectroscopy (FT-IR)[23,24]
Fig. No: 5 :- FT-IR spectrum of pure Metformin HCL.
The FT-IR spectra of pure Metformin HCL shows peaks at wave numbers (cm-1) which correspond to the functional groups present in the structure of the drug. The functional groups
www.wjpr.net Vol 4, Issue 06, 2015.
[image:8.595.185.413.90.195.2]1678 Table No. 3: FT-IR spectra of Metformin HCL
Sr. No. Functional groups Ranges cm -1 1. C-H Stretching 3170 2. C-H bending 1450 3. C-N stretching 1571 4. C=N stretching 1625 5. N-H stretching 10 3369 6. N-H stretching 20 3298
The absorption bands shown by Metformin HCL are characteristic of the groups present in its
molecular structure (Fig. No. 5). The presence of absorption bands corresponding to the
functional groups present in the structure of Metformin HCL and the absence of any
well-defined unaccountable peaks is a confirmation of the purity of the drug sample.
7. Differential Scanning Calorimetry (DSC)[25]
Fig. No. 6 : DSC thermogram of pure Metformin HCL.
The DSC thermogram of pure Metformin HCL shows a sharp endothermic peak at 224.63˚C
which is characteristic of melting point of drug. The sharp endothermic peak also indicates
crystalline nature of drug.The drug shows degradation peak above 300˚C. This data is useful
for formulation of tablet. During formulation the degradation temperature of Metformin HCL
was taken into consideration. This thermogram was also referred later to study interactions in
formulation.
8. Scanning Electron Microscopy ( SEM )[30]
SEM micrographs indicate needle-shaped and relatively large size crystals of metformin
[image:8.595.119.490.328.526.2]www.wjpr.net Vol 4, Issue 06, 2015.
1679 compressibility, while the micrographs of the spray-dried drug show a reduction in size and
change into an almost spherical shape. The spherical shape of the spray-dried particles is
[image:9.595.110.488.145.445.2]responsible for good compressibility and flowability of metformin hydrochloride.
Fig. No. 7: SEM of Metformin HCL and SLS Spray dried powder.
Scanning Electron Microscopy (SEM) was done to reduce the particle size and increase the
flow property of Metformin HCL. Particle size was reduced to increase the bioavailability of
the drug. After doing SEM it was concluded that the particle size was reduced from the
original size of drug. After spray drying the particle size of drug was reduced up to
5µm-10µm. The flow property was also increased.
8.2.: Preformulation Study of Polymers[18,19,20] 1. Appearance and colour
The polymers (Sodium Salicylate, Cyclodextrin, Chitosan ) powder was examined for its
organoleptic properties like colour and appearance.
Table No. 4 : Colour profile of different polymer.
Sr.No. Polymer Colour
www.wjpr.net Vol 4, Issue 06, 2015.
1680 2. Solubility: Solubility of polymers was determined in various solvents like Methanol and
[image:10.595.82.522.538.706.2]Water.
Table No. 5: Solubility profile of different polymer.
Sr.No. Polymer Ether Water
1. Sodium Salicylate practically insoluble Freely soluble 2. Cyclodextrin insoluble Freely soluble 3. Chitosan Slightly insoluble Sparingly soluble
3. Melting point determination
The melting point of the different polymer was determined by open capillary method using
melting point apparatus.
Table No. 6: Melting point determination of different polymer.
Sr.No. Polymer Melting point
1. Sodium Salicylate 207.8o C 2. Cyclodextrin 265.8 o C 3. Chitosan 203oC
4. Infrared Spectroscopy[23,24]
The infrared spectra of different polymers were recorded by Shimadzu S 8400 FTIR
spectrometer. Samples were prepared by KBr disc method (~2 mg sample in 100 mg KBr)
and examined in the transmission mode. Spectrum was measured over a frequency range of
4000–400 cm−1.
4.1 FT-IR spectrum of Sodium Salicylate
www.wjpr.net Vol 4, Issue 06, 2015.
1681 The FT-IR spectra of Sodium Salicylate shows peaks at wave numbers (cm-1) which
correspond to the functional groups present in the structure of the Sodium Salicylate. The
[image:11.595.183.417.167.242.2]functional groups determined were similar to the values given in literature.
Table No. 7: FT-IR spectra of Sodium Salicylate.
Sr. No. Functional groups Ranges cm -1 1. C=C Stretching 1675 2. C-H stretching 3250 3. O-H stretching 3571 4. C=O stretching 1725
[image:11.595.89.514.288.458.2]4.2. FT-IR spectrum of β-Cyclodextrin
Fig. No. 9: FT-IR spectrum of β-Cyclodextrin.
The FT-IR spectra of β-Cyclodextrin shows peaks at wave numbers (cm-1) which correspond
to the functional groups present in the structure of the β-Cyclodextrin. The functional groups
determined were similar to the values given in literature.
Table No. 8: FT-IR spectra of β-Cyclodextrin
[image:11.595.184.413.594.685.2]www.wjpr.net Vol 4, Issue 06, 2015.
[image:12.595.81.523.97.241.2]1682 4.3. FT-IR spectrum of Chitosan
Fig. No. 10: FT-IR spectrum of Chitosan.
The FT-IR spectra of Chitosan shows peaks at wave numbers (cm-1) which correspond to the
functional groups present in the structure of the Chitosan. The functional groups determined
[image:12.595.43.555.559.799.2]were similar to the values given in literature.
Table No. 9: FT-IR spectra of Chitosan.
Sr. No. Functional groups Ranges cm -1 1. C-H Stretching 2870 2. O-H Stretching 3250 3. N-H Stretching 3471
5. Formulation of Tablets
The spray dried powder is used for the formulation. Different permeation enhancer is used to
increase the permeation of the drug. Direct Compression method is used for the tablet
formulation and punching of the tablet. All the excipient used are shown in the table no. 10.
Table No. 10: Formulation table chart Sr.
No. Ingredients F - 1 F– 2 F - 3 F – 4 F – 5 F - 6 F – 7 F – 8 F - 9 1. Metformin HCL + SLS
(Spray Dried ) 250 250 250 250 250 250 250 250 250
2. Lactose 140 90 40 140 90 40 140 90 40
3. Sodium Salicylate 50 100 150 - - - - - -
4. Cyclodextrin - - - 50 100 150 - - -
5. Chitosan - - - - - - 50 100 150
6. Microcrystalline
Cellulose 35 35 35 35 35 35 35 35 35
7. Aerosil 5 5 5 5 5 5 5 5 5
8. Crosspovidone 10 10 10 10 10 10 10 10 10
9. Magnesium Stearate 5 5 5 5 5 5 5 5 5
www.wjpr.net Vol 4, Issue 06, 2015.
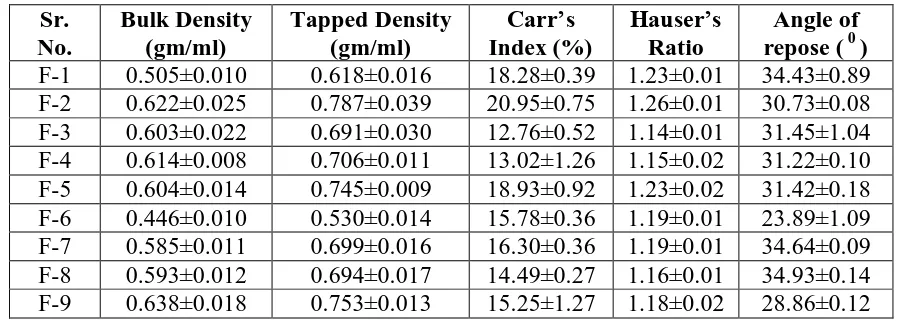
1683 6.1. Pre-Compression Parameters[31,32,33]
The Immediate release tablet of Metformin Hydrochloride was evaluated for their
pre-compression parameters. Results of all the pre-pre-compression parameters was shown in table
No.11.the result revealed that the prepared tablet was complies with the standards of all
parameters like, angle of repose, bulk and tapped density, compressibility index, hausner
ratio.
6.1.1. Bulk Density and Tapped Density
A comparison of the bulk density and tapped density can give a measure of the relative
importance of this interaction in a given powder of Immediate release tablet of Metformin
Hydrochloride; such a comparison is often used as an index of the ability of the powder to
flow. The bulk density and tapped density was shown in table No.11. It complies with the official standards.
6.1.2. Compressibility Index and Hausner ratio
A simple indication of ease with which a material can be induced to flow is given by
application of a compressibility index. The value for compressibility index and Hausner ratio
was found to be 13.8% and of 1.16, respectively as shown in table no.11.It complies with the
standards reported in official IP monograph.
6.1.3. Angle of Repose
The angle of repose for formulated blend of Immediate release tablet of Metformin
Hydrochloride was carried out and the result were shown in table no. 22. It found to be in the
[image:13.595.72.521.601.763.2]range of 21080 showed excellent flow property which confirmed free flowing nature of powder.
Table No. 11: Pre-Compression Parameters. Sr.
No.
Bulk Density (gm/ml)
Tapped Density (gm/ml)
Carr’s Index (%)
Hauser’s Ratio
www.wjpr.net Vol 4, Issue 06, 2015.
1684 6.2. Post Compression Parameter[31,32,33]
All the result of post compression parameters was showed in table no.12 .The result of all the
parameters revealed that the prepared Immediate release tablet of Metformin Hydrochloride
complies with the standards acceptance criteria.
6.2.1. Tablet Dimensions
The thickness and diameter of all the batches of Immediate release tablet of Metformin
Hydrochloride was found to be in the range of standards acceptance criteria. As shown in
table no.12 indicating that tablet showed good dimensions.
6.2.2. Hardness
The measured hardness of Immediate release tablet of Metformin Hydrochloride of each
optimized batch ranged between 8 to 10.5 kg/cm2. As shown in table no. 12. The result revealed all the batches showed good mechanical strength this ensures good handling
characteristics of all batches.
6.2.3. Friability Test
The friability of all the optimized batches F1 to F9 of Immediate release tablet of Metformin
Hydrochloride was in the range as shown in table no. 12 .The % friability was less than 1%
in all formulation ensuring that the tablet were mechanically stable. The
result revealed that the prepared Immediate release tablet of Metformin Hydrochloride passes
the friability test as per official standards.
6.2.4. Disintegration Test:
The Disintegration Test for all batches from F1 to F9 of Immediate release tablet of
Metformin Hydrochloride is shown in table No. 12. It complies with official specifications reported in Indian Pharmacopoeia.
6.2.5. Determination of Drug Contents
The percentage of drug content for all batches from F1 to F9 of Immediate release tablet of
Metformin Hydrochloride was found to 96 % of Metformin Hydrochloride as shown in table
www.wjpr.net Vol 4, Issue 06, 2015.
[image:15.595.70.528.96.257.2]1685 Table No. 12: Post -Compression Parameters.
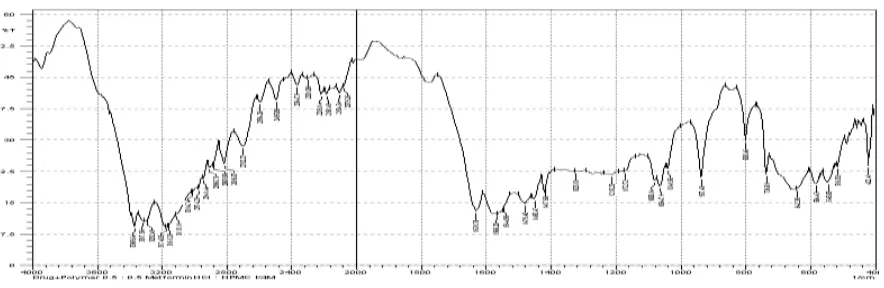
6.2.6. FTIR Studies[23,24]
FTIR studies were performed using IR spectrophotometer. FTIR techniques have been used
here to study the physical and chemical interaction between Metformin Hydrochloride and
the polymers used The IR spectrum and IR interpretation of optimized F-6 batch shows in
figure no.15. The observed spectrum represents drug to polymer super-imposed pattern with
their significant functional group at specific wavelength. Spectrum represent significant
functional group from drug to polymer, no new additional peak formation was observed
indicated that there was no any chemical interaction between drug and polymers only the
physical interaction was takes place in terms of hydrogen bonding. The peaks obtained in the
spectra’s of each polymer correlates with the peaks of drug spectrum. This indicates that the
[image:15.595.75.521.510.735.2]drug was compatible with the formulation components.
Fig. No. 13: FT-IR spectrum of optimized (F-6) formulation. Sr.no Thickness
( mm )
Diameter ( cm )
Hardness ( kg/cm2 )
Friability ( % )
Disint. Time in min.
www.wjpr.net Vol 4, Issue 06, 2015.
1686 6.2.7. Differential Scanning Calorimetry (DSC) Study for Optimized Batch[25]
The differential scanning calorimetry for optimized F-6 batch was showed in figure no. 14.
The sharp endothermic peak at 224 0C, 1520C, 2070C and 244.180C indicate that drug polymorph melts and present in more amorphous polymeric form respectively, which help to
[image:16.595.95.503.190.343.2]exhibit more solubility of drug polymorph.
Fig. No. 14: DSC thermogram of optimized (F-6) formulation.
Fig. No. 15: DSC overlay thermogram.
6.3. In vitro drug release studies[35]
Dissolution studies on all the optimized batches of Immediate release tablet of Metformin
Hydrochloride were carried out using USP type –ІІ (rotating paddle) dissolution apparatus
(Electrolab TDT 08L). The result obtained in in-vitro release studies were plotted in four models of data treatment as follows.
1. Zero order rate kinetic
2. First order rate kinetic
[image:16.595.97.488.388.564.2]www.wjpr.net Vol 4, Issue 06, 2015.
1687 4. Korsmeyer-Peppas
The in-vitro release data obtained for all batches was shown in figure no. 18. The cumulative
percent drug release after 80 min. is recorded and it is observed. The results obtained shows
that the height drug release 99.81% for F-6 batch. From the in-vitro release studies it was
found that there was an increase in drug release. From the obtained result it was concluded
that the drug release from formulation increased with increased in polymer concentration.
Table No. 13: In-Vitro % release of all the batches.
Time Batch Batch Batch Batch Batch Batch Batch Batch Batch
in min. F-1 F-2 F-3 F-4 F-5 F-6 F-7 F-8 F-9
0 0 0 0 0 0 0 0 0 0
5 11.28 9.92 12.34 9.73 14.29 8.67 7.29 8.73 9.37 10 18.995 10.326 17.711 11.653 17.23 11.423 10.829 10.853 12.585 15 33.705 19.717 33.332 21.065 26.413 17.122 19.538 18.811 19.703 20 47.103 30.102 41.785 29.675 37.881 28.593 25.3 27.098 36.887 30 55.016 35.019 51.549 37.699 46.013 39.083 34.249 35.722 44.371 40 67.889 48.038 63.76 48.792 57.028 52.613 49.451 47.267 54.933 45 81.668 57.686 81.502 61.03 74.535 61.501 55.943 55.683 64.054 50 87.861 65.156 86.984 67.378 81.125 83.482 64.568 62.461 72.052 60 93.975 73.539 92.003 75.042 88.45 99.819 68.437 69.664 85.297 70 96.129 87.926 99.493 85.781 91.32 86.601 86.601 99.217 80 99.138 98.518 98.565 98.71 98.197 98.081
In-vitro dissolution 0 10 20 30 40 50 60 70 80 90 100 110
0 10 20 30 40 50 60 70 80 90
Time in min.
[image:17.595.61.541.238.684.2]% R el ea se of D rug F-1 F-2 F-3 F-4 F-5 F-6 F-7 F-8 F-9
www.wjpr.net Vol 4, Issue 06, 2015.
1688 Release Profile
0 50 100 150 200 250 300
0 10 20 30 40 50 60 70
Time
%
D
ru
g
R
el
ea
se
d
Actual
Zero
1st
Matrix
Peppas
[image:18.595.75.534.75.284.2]Hix.Crow.
Fig. No. 17: Best fit model is Korsmeyer – Peppas
Drug Release Mechanism
The in vitro release data was analyzed using various kinetic models like Zero order, First
order, Higuchi matrix and Korsmeyer-Peppas in order to find out the mechanism of drug
release. These values were compared with each other for model and drug equation as shown
in figure no. 19 .The Korsmeyer-Peppas model fits the data to following general equation.
Mt/M∞ = ktn
Where, Mt/M∞ is the fraction of the drug release at time t and k is the rate constant and n is the release exponent. The n value is used to characterize different release mechanisms and is
calculated from the slop of the plot of fraction of drug released Vs log of time.
6.4. In vivo drug release studies[13, 14]
The in-vivo drug release was studied using everted sac method.
[image:18.595.114.483.574.741.2]
www.wjpr.net Vol 4, Issue 06, 2015.
1689
In-Vivo Dissolution Study
0 10 20 30 40 50 60 70 80 90 100 110
0 10 20 30 40 50 60 70 80 90 100 110 120 130 140
Time in min.
[image:19.595.101.495.75.299.2]% R e le a s e of D rug F-3 Batch F-6 Batch F-9 Batch
Fig. No. 19: In-Vivo drug release of optimized batches.
The dissolution study was compared with the in-vitro drug release profile. The three
optimized batch was taken for the in-vivo study. Among this the Cyclodextrin batch was the
best which shows the more permeation of the drug then other two permeation enhancers.
6.5.Stability Studies[36]
The stability studies were carried out for Immediate release tablet of Metformin
Hydrochloride at elevated temperature 40oC and 75% RH for 3 months on the optimized batches and result reported in table no. . Tablets were observed for any change in colour,
odour and drug content The stability result was indicated that the optimized batches was
stable for 3 months.
6.5.1. Physical appearance a) Colour : Unchanged b) Odour : Unchanged
6.5.2. Drug content
Table No. 14: Drug content for stability study. Sr.
No.
Drug content before stability study
Drug content after 1 month
Drug content after 2 month
www.wjpr.net Vol 4, Issue 06, 2015.
1690 CONCLUSION
In this work, an antidiabetic tablet containing natural permeation enhancer was
formulated which enhanced the absorption of poorly absorbable antidiabetic drug from
intestine.
The absorption of Metformin HCL in humans is very low according to Biopharmaceutical
Classification System.
The absorption studies were conducted for poorly absorbable antidiabetic drug metformin
hydrochloride with different permeation enhancer.
The absorbed drug was determined by using U.V Visible Spectrophotometer at 234nm.
After analyzing the results it was concluded that Cyclodextrin has best absorption
enhancing activity of metformin hydrochloride then the other two permeation enhancer.
Cyclodextrin help to reduce dose of metformin hydrochloride in tablet dosage form.
Purity of drug was evaluated by FTIR and DSC study.
Drug excipient compatibility study was evaluated by FTIR.
For optimizing the dose of metformin hydrochloride, different batches of tablets (F1 to
F9) was formulated by direct compression method with different concentration of
permeation enhancer.
Pre-compression and Post-compression study was done for the tablet formulation and
results was recorded.
In-Vitro everted sac method using chicken intestine was selected for the absorption
studies.
Hence, the result showed that the use of permeation enhancer like cyclodextrin, enhance
the permeation of drug.
REFERENCES
1. Buchanan TA, Xiang AH, Peters RK, et al. Preservation of pancreatic beta-cell function
and prevention of type 2 diabetes by pharmacological treatment of insulin resistance in
high-risk Hispanic women. Diabetes., 2002; 51: 2796–2803.
2. UK Prospective Diabetes Study (UKPDS) Group. Effect of intensive blood-glucose
control with metformin on complications in overweight patients with type 2 diabetes
(UKPDS 34). Lancet., 1998; 352: 854–865.
3. Gerstein HC, Yusuf S, Bosch J, et al. Effect of rosiglitazone on the frequency of diabetes
in patients with impaired glucose tolerance or impaired fasting glucose: a randomised
www.wjpr.net Vol 4, Issue 06, 2015.
1691 4. Polonsky KS, Sturis J, Bell GI. Seminars in medicine of the Beth Israel Hospital, Boston:
non-insulin-dependent diabetes mellitus: a genetically programmed failure of the beta cell
to compensate for insulin resistance. N Engl J Med, 1996; 334: 777–783.
5. Diabetes Prevention Program Research Group. The prevalence of retinopathy in impaired
glucose tolerance and recent-onset diabetes in the Diabetes Prevention Program. Diabet
Med., 2007; 24: 137–144.
6. Chiasson JL, Josse RG, Gomis R, Hanefeld M, Karasik A, Laakso M; STOP-NIDDM
Trial Research Group. Acarbose for prevention of type 2 diabetes mellitus: the
STOP-NIDDM randomised trial. Lancet., 2002; 359: 2072–2077.
7. Yves Gonnissen, Coprocessing via Spray Drying as A Formulation Platform To Improve
The Compatability of Various Drugs, 2008; 4-10.
8. Dr. Richard Johnson, Pharmaceutical Spray Drying- Technology Overview and
Applications in Pharmaceutical and Biotechnology Industry., 1-2.
9. Shaikh MS I, Nikita D. Derle and Rajendra Bhamber, Permeability Enhancement
Techniques for Poorly Permeable Drugs: A Review , Journal of Applied Pharmaceutical
Science., 2012; 02(06); 34-39.
10.Dimple P., Fatemeh A., Hossein Z. Intestinal permeability enhancement of levothyroxine
sodium by straight chain fatty acids studied in MDCK epithelial cell line. Eur J Pharm
Sci., 2010; 40: 466-472.
11.Ewoud J.V.H., Albertus G. D. B, Douwe D. B.Intestinal drug absorption enhancement:
An overview. Pharmac. Ther., 1989; 44: 407-443.
12.Thanou M., Verhoef J.C., Junginger H.E. Oral drug absorption enhancement by chitosan
and its derivatives. Advanced Drug Delivery Reviews., 2001; 52: 117–126.
13.M. Ravindra Babu, K. Sampath Kumar , Formulation And Absorption Enhancement Of
Metformin Oral Tablets , Indo American Journal of Pharmaceutical Research, 2013;
3(10).
14.Ashwini Kumar, Mayank Bansal, Formulation And Evaluation Of Antidiabetic Tablets:
Effect Of Absorption Enhancser, World Journal of Pharmaceutical Research, 3(10):
1426-1445.
15.www.drugs.com/ Metformin HCL.
16.www.wikipedia,com/ Metformin HCL.
17.R. C. Rowe, P. J. Sheskey and M. E. Quinn.HPMC. Handbook of Pharmaceutical
www.wjpr.net Vol 4, Issue 06, 2015.
1692 18.Banker GS and Anderson NR. The Theory and Practice of Industrial Pharmacy: Tablet,
Lachman, (3rded) Varghese Publishing House, Bombay, 1990; 293-303.
19.Brahmankar DM and Jaiswal SB. Biopharmaceutics and Pharmacokinetics:
Pharmacokinetics, (2nd ed) Vallabh Prakashan, Delhi, 2009; 399-401.
20.John C and Morten C. The Science of Dosage Form Design, Aulton: Modified release
peroral dosage forms, (2nded) Churchill Livingstone, 2002; 290-300.
21.Allen, Loyd, Nicholas Popovich, and Howard Ansel. 2005. Ansel's Pharmaceutical
Dosage Forms and Drug Delievery Systems. 8th ed. Lippincott Williams Wilkins.,
260-263.
22.G. R. Chatwal, S. K. Anand, Instrumental Methods of Chemical Analysis, Himalaya
Publishing House, Delhi, 2004; 1.6-1.7, 2.156-2.158.
23.Donald L Pavia, Gray M Lampman, George S Kriz 2001, Infrared Spectrocsopy:
Introduction to Specroscopy, 3rd edition, 13-101.
24.Skoog, D.A., F.J. Holler, and T.A. Nieman, Principles of Instrumental Analysis. 1980:
Saunders College New York., 253-170.
25.Höhne, G., W. Hemminger, and H.J. Flammersheim, Differential Scanning Calorimetry.
2003: Springer Verlag., 102-130.
26.Coleman, N.J. and D.Q.M. Craig, Modulated Temperature Differential Scanning
Calorimetry: A Novel Approach To Pharmaceutical Thermal Analysis. International
Journal of Pharmaceutics, 1996; 135(1-2): 13-29.
27.Dr.Yogesh Satpute and Ms.Afshan Sayed, Preformulation Screening of Pharmaceutical
For Drug Excipient Compatibility Using DSC, Materials Characterization, Application
specialist, Customer Knowledge Centre for Analytical Sciences, PerkinElmer (India) Pvt.
Ltd, 1-7.
28.U. B. Hadkar, et al. A Handbook of Practical Physical Pharmacy and Physical
Pharmaceutics, Nirali Prakashan., 74-83.
29.Dissolution Technology (Leeson, L.J. and Carstensen, J.T. Eds.) Academy of
Pharmaceutical Sciences, American Pharmaceutical Association Washington D.C., 1974;
106-146.
30.Bhavesh S. Barot1,Punit B. Parejiya,Tushar M. Patel, Development Of Directly
Compressible Metformin Hydrochloride By The Spray-Drying Technique , Acta Pharm.,
2010; 60: 165–175
31.Nyol Sandeep, Dr. M.M. Gupta, Immediate Drug Release Dosage Form: A Review,
www.wjpr.net Vol 4, Issue 06, 2015.
1693 32.Reddy KM et al. Formulation and evaluation of immediate release tablets of linezolid.
International Journal of Pharmaceutical & Biological Archives 2011; 2(4): 1230-1235.
33.Mohanachandran PS et al. Superdisintegrants: An Overview. International Journal of
Pharmaceutical Sciences Review and Research 2011; 6(1): 105-109.
34.Wagh MP et al. Formulation and evaluation of fast dispersible tablets of aceclofenac
using different superdisintegrant. International Journal of Pharmacy and Pharmaceutical
Sciences., 2010; 2(1): 154-157.
35.Dissolution Technology (Leeson, L.J. and Carstensen, J.T. Eds.) Academy of
Pharmaceutical Sciences, American Pharmaceutical Association Washington D.C., 1974;
106-146.
36.ICH, Q2B, Harmonised Tripartite Guideline, Test on Validation of Analytical Procedures,
IFPMA, in: Proceedings of the International Conference on Harmonization, Geneva.,