RP-UFLC METHOD DEVELOPMENT AND VALIDATION FOR
NEVIRAPINE IN BULK DRUG AND DOSAGE FORMS AS AN
ANTI-HIV AGENT
N. K. Sathish1* and E. K. Anvar2
1
Department of Pharmaceutical Chemistry, Govt. College of Pharmacy, Bengaluru-560027, Karnataka, India.
2
Dept of Pharmaceutical Analysis, SAC College of Pharmacy, BG Nagara -571 448, Karnataka, India.
ABSTRACT
A simple, precise, rapid, accurate and reproducible RP-UFLC method has been developed and validated for the determination of Nevirapine in bulk drug and pharmaceutical dosage forms. An Eclipse plus C-8 column with a particle size of 5µm having an internal diameter of 4.6 х 250 mm was used in gradient mode. The mobile phase consisting of Methanol and Acetonitrile in the ratio of 90:10 v/v was used. The flow rate was set to 1ml/min and the detection was carried out at a wavelength of 214nm. The retention time was found to be at 2.7min and the linearity was found in the range of 2-10µg/ml with a correlation co-efficient value of 0.9996. The mean recoveries were found to be in the range of 98.51-101.80% and the % RSD reported was not more than 2. The LOD and LOQ values were found to be 0.021µg/ml and 0.063µg/ml respectively. Hence, the proposed method can be successfully applied for the quantitative determination of Nevirapine in the bulk drug and Pharmaceutical dosage forms.
KEYWORDS: Nevirapine, RP-UFLC, Validation, ICH.
INTRODUCTION
Nevirapine (NVP) is 11-cyclopropyl-4-methyl-5, 11-dihydro-6H-dipyrido [3, 2-b: 2’, 3’-e][1,4] diazepin-6-one (Figure 1). Nevirapine belongs to the class of drugs known as Non-Nucleoside Reverse Transcriptase Inhibitors (NNRTIs) which shows the activity against human immunodeficiency virus type 1 (HIV-1) and is already marketed for the treatment of
Volume 7, Issue 16, 1116-1126. Research Article ISSN 2277– 7105
Article Received on 17 July 2018,
Revised on 07 August 2018, Accepted on 28 August 2018
DOI: 10.20959/wjpr201816-13185
*Corresponding Author
N. K. Sathish
Department of
Pharmaceutical Chemistry,
Govt. College of Pharmacy,
Bengaluru-560027,
HIV-1. Nevirapine binds directly to Reverse Transcriptase there by blocks the RNA dependent and DNA dependent DNA polymerase activities by causing the disruption of the enzyme’s catalytic site. Nevirapine is recommended for treating HIV infections in
combination with other reverse transcriptase inhibitors such as Stavudine and Lamivudine.[1,2]
Literature survey revealed that few analytical methods such as RP-HPLC[3-10], UV-spectrophotometric[11-15] and HPLC methods have been reported for the estimation of Nevirapine in bulk and dosage forms.[16-17] LC-MS/MS method has been reported for the estimation of Nevirapine in human plasma.[18]
No reports were found for determination of Nevirapine in bulk drug and pharmaceutical dosage forms using RP-UFLC method. Hence, an attempt was made to develop a new, simple, rapid, precise, economical and accurate RP-UFLC method for the determination of Nevirapine in bulk and pharmaceutical dosage forms. The method was developed and validated as per the procedures and acceptance criteria of ICH guidelines.
EXPERIMENTATION
Reagents
Acetonitrile (HPLC grade) and methanol (HPLC grade) were procured from Rankem (New Delhi, India). A reference standard of Nevirapine was procured from Shasun Pharmaceutical Ltd, (Pandicherry, India). A commercial NEVIMUNE (Cipla) tablets containing 200 mg of NVP were procured from a local market.
Instrumentation
The RP-UFLC system consisting of binary gradient pump, Rheodine injector, PDA detector and Hamilton syringe fitted with a 20 µL loop were used. The mobile phase consisting of a mixture of Methanol and Acetonitrile in the ratio of 90:10 v / v with a flow rate adjusted to 1 mL / min was used. The elute was monitored at a wavelength of 214 nm. The column used was Eclipse plus C-8 with a particle size of 5µm having an internal diameter of 4.6 х 250mm. The chromatogram showed the peak of standard and sample at a retention time of 2.7 min. The results obtained were as per shown in the Figures 3 and 4.
Preparation of standard solution
contents were then filtered through a membrane filter of 0.45µ. The volume was made up to the mark with mobile phase (Methanol and Acetonitrile in the ratio 90:10 v/v) to get the stock solution of the concentration 1000 µg / ml. This solution was further diluted with the above mobile phase to get the working standard solution of 6 µg / ml of drug.
Preparation of sample solution
Twenty tablets (with the label claim: 200 mg) were weighed accurately and crushed to form fine powder. Aliquots of powder equivalent to the weight of one tablet were accurately weighed and transferred to 50 mL volumetric flask containing 20 ml of mobile phase. It was sonicated for about 5-10 minutes to achieve complete dissolution and then filtered through a membrane filter of 0.45µ. The volume was made up to the mark with mobile phase to get the stock solution of the concentration 1000 µg / ml. This solution was further diluted with the mobile phase to get the working standard solution of 6 µg / ml of drug.
Optimization
The successful analysis of the analyte using UFLC method relies on the optimization of chromatographic conditions like mobile phase, flow rate, solvent ratio and column detection etc. Thus for better selectivity and sensitivity, different types of columns and mobile phases were tried to achieve optimum chromatographic condition. Broad peaks with less peak response and higher retention times were observed. Finally an Eclipse plus C-8 column with an internal diameter of 4.6 mm x 250 mm having a particle size of 5µm was selected for analysis based on good peak shape, suitable retention time and selectivity. Optimum
separation with good peaks and shapes were observed in Methanol and Acetonitrile in the ratio of 90:10 v / v as the mobile phase. The analysis was performed at ambient temperature by setting the flow rate to 1 ml / min with a run time of 5 min. The eluent was monitored using PDA detector at a wavelength of 214 nm. The mobile phase with the same composition was used during the extraction of the drug from the pharmaceutical dosage forms as well.
Calibration curve
calibration curve obtained were as per shown in the Table 1 and Figure 2. The standard and sample chromatograms of Nevirapine are as per shown in the Figures 3 and 4.
METHOD DEVELOPMENT AND VALIDATION
1. Linearity
Linearity was studied by preparing the standard solution at five different concentration levels. The proposed method was checked by analyzing each calibration standard solution (2, 4, 6, 8, 10 µg / ml) for NVP. The 20 µl of each solution was injected into the RP-UFLC system. The linearity range was found to be from 2-10 µg / ml. The peak area and retention time were recorded for all the chromatograms. The calibration curve was drawn by plotting the concentration of NVP on the X- axis against the peak areas of standard NVP on the Y- axis.
2. Specificity
The specificity of the method was performed by observing the interference of any encountered ingredients present in the dosage forms. The specificity of the RP- UFLC method was determined by comparing the peak area and retention time of the standard and sample Nevirapine solutions.
3. Precision
Precision studies were carried out to ascertain the reproducibility of the proposed method. Repeatability was determined by preparing six replicates of the same concentration of the sample and the peak area was measured. Intra-day precision study was carried out by preparing drug solution of same concentration and analyzing it at three different times in a day. The same procedure was followed for three different days to determine inter-day precision. The results were reported as the % RSD. The percentage relative standard deviation (% RSD) was calculated and was found to be within the acceptable criteria of not more than 2.
4. LOD and LOQ
5. Accuracy
The Accuracy of the proposed method was performed in triplicate samples at 3 different concentrations equivalent to 50%, 100% and 150% of the active ingredient, by spiking a known amount of NVP standard with placebo. The three determinations were performed at each level and results were obtained.
6. Robustness
The robustness of the method was performed by deliberately changing the column temperature to 25oC and 18oC and the respective peak areas were measured. The method showed that there were no marked changes in the chromatographic parameters, demonstrating the robustness of the method.
RESULTS AND DISCUSSION
Method Development
A RP-UFLC was proposed as a suitable method for the estimation of NVP in bulk drug and in pharmaceutical dosage forms. In order to achieve remarkable retention time and peak asymmetry, an Eclipse plus C-8 column was selected. The selection of mobile phase and flow rates were made on the basis of peak shape, baseline drift, time required for analysis and cost of the chemicals. The mobile phase consisting of Methanol and Acetonitrile in the ratio of 90:10 v / v with a flow rate set to 1 ml / min was selected. The retention time for NVP was found at 2.7 min and the maximum absorption of the drug was seen at a wavelength of 214nm. The mobile phase with the same composition as above was used during the extraction
of the drug from the pharmaceutical dosage forms.
Method Validation
The linearity range of Nevirapine was seen in the range from 2–10 µg / ml. The linear regression equation was y = 38744x + 3471.2 with a regression coefficient value of 0.9996 as
shown in the Table - 1. The specificity studies of both standard and sample Nevirapine is shown in the Table - 2 and 3. Precision study was performed and the result obtained is shown
studies. A known amount of standard drug material was added with pre-analyzed formulation in different levels. The amount of drug recovered was calculated and the percentage recovery was found to be in the range of 98.51-101.80% and the % RSD values were calculated and is as shown in the Table - 8. The % RSD values were found to be less than 2%. The result of robustness is shown in the Table - 9.
N
NH
N
N
CH3
O
Figure 1: Nevirapine (11-cyclopropyl-4-methyl-5, 11-dihydro-6H-dipyrido [3, 2-b: 2’,
[image:6.595.194.410.190.313.2]3’-e] [1, 4] diazepin-6-one).
[image:6.595.96.501.376.565.2][image:7.595.100.487.360.611.2]
Figure 3: Chromatogram of Nevirapine standard.
Table 1: Calibration curve data of Nevirapine by RP-UFLC method.
S. No. Concentration (µg / ml) Retention time (min) Peak area
1. 0 0 0
2. 2 2.735 86191
3. 4 2.745 158299
4. 6 2.738 235363
5. 8 2.738 311437
6. 10 2.749 391854
Table 2: Specificity result of Standard Nevirapine.
Concentration (µg/ml) Retention time (min) Peak area
6 2.737 237929
Table 3: Specificity result of Sample Nevirapine.
Concentration (µg/ml) Retention time (min) Peak area
6 2.730 240745
Table 4: Results of precision.
Concentration (µg/ml) Peak area Statistical Analysis
6 235313
Mean :- 235455.5
SD :- 247.014
% RSD :- 0.104909
6 235287
6 235734
6 235803
6 235233
6 235363
Table 5: Results of Intra-day.
Concentration
(µg/ml) Peak area 1 Peak area 2 Peak area 3 Average %RSD
6 233950 239882 239472
6 232248 238945 237922
6 233950 238474 237929
6 232248 237127 239563
6 233139 238400 236343
6 233950 239563 240745
% RSD 0.35 0.41 0.65 0.47
Table 6: Results of inter-day precision.
Concentration (µg/ml) Peak area Day 1 Peak area Day 2 Peak area Day 3 Statistical Analysis
6 237929 238474 227826
6 228383 237929 239882
6 239882 237935 237907
6 233950 237929 239472
6 237438 228331 239039
% RSD 1.76 1.66 1.92 1.78
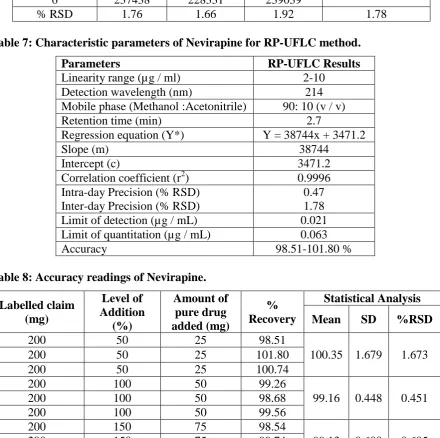
Table 7: Characteristic parameters of Nevirapine for RP-UFLC method.
Parameters RP-UFLC Results
Linearity range (µg / ml) 2-10
Detection wavelength (nm) 214
Mobile phase (Methanol :Acetonitrile) 90: 10 (v / v)
Retention time (min) 2.7
Regression equation (Y*) Y = 38744x + 3471.2
Slope (m) 38744
Intercept (c) 3471.2
Correlation coefficient (r2) 0.9996
Intra-day Precision (% RSD) Inter-day Precision (% RSD)
0.47 1.78
Limit of detection (µg / mL) 0.021
Limit of quantitation (µg / mL) 0.063
[image:9.595.82.523.94.532.2]Accuracy 98.51-101.80 %
Table 8: Accuracy readings of Nevirapine.
Labelled claim (mg) Level of Addition (%) Amount of pure drug added (mg) % Recovery Statistical Analysis
Mean SD %RSD
200 50 25 98.51
100.35 1.679 1.673
200 50 25 101.80
200 50 25 100.74
200 100 50 99.26
99.16 0.448 0.451
200 100 50 98.68
200 100 50 99.56
200 150 75 98.54
99.13 0.600 0.605
200 150 75 99.74
[image:9.595.66.537.375.789.2]200 150 75 99.11
Table 9: Results of Robustness.
Temperature 25oC
Concentration (µg/ml) Peak area Statistical Analysis
6 222846
Mean :- 225787
SD :- 3864.09
% RSD :- 1.711
6 223142
6 222551
6 225552
6 228383
6 232248
Temperature 18oC
6 235305
Mean :- 236481.3 SD :- 1758.89
6 234224
6 238400 % RSD :- 0.743
6 238216
6 237438
CONCLUSION
The proposed RP-UFLC method was found to be rapid, specific, precise and accurate for the determination of Nevirapine in bulk drug and in tablet dosage forms. The method can be successfully used for routine analysis of NVP in bulk drug and pharmaceutical dosage forms without interference.
ACKNOWOLEDGEMENTS
The authors would like to thank the Shasun Pharmaceutical Ltd, Pandicherry for providing the standard Nevirapine drug. We are grateful and thankful to Dr.B.Ramesh principal, SAC College of Pharmacy for providing the necessary facilities to carry out this research work.
REFERENCES
1. Ravisankar P, Devalaro G. Development of new RP-HPLC method for the estimation of
Nevirapine in tablet dosage form. Int J Pharm Sci, 2013; 5(3): 505-11.
2. Rohini P, Madhusudhanareddy, Gupta A, Lokeswara BV, Sudharani G. Method development and validation for estimation of Nevirapine from tablets by RP-HPLC. Int J Pharma, 2011; 1(1): 29-33.
3. Saravanan C, Kaveri K, Thamizhmozhi M, Hafeezunissa M, Rajasekar R, Santhosh KR. Validation of analytical method for estimation of Nevirapine Hcl in tablet dosage form by RP-HPLC. J. Sci. Res. Phar, 2012; 1(3): 51-2.
4. Minaketan S, Ravi KBVV, Niraj KT, Saroj KP. Stability indicating RP-HPLC method for determination of Nevirapine in pure and tablet form. Der Pharma Chemica, 2013; 5(2): 103-10.
5. Venkata RC, Rama DP, Mukkanti K, Srinivasu P. Stability indicating HPLC method for impurities estimation of Nevirapine in extended release tablet dose. Pharmacophore, 2013; 4(2): 50-8.
6. Padmanabha RY, Sreekanth P, Raghavendra HG. Qualitative estimation of Nevirapine in pharmaceutical dosage forms by RP-HPLC. Int J Chem. Sci, 2008; 6(1): 417-21.
drug and tablet formulation and application in vitro dissolution study. JGPT, 2009; 1(1): 54-61.
8. Purnima H Mitesh P, Priti P, Nitul S. Determination of Nevirapine in human plasma by high performance liquid chromatography with ultraviolet detection. Int J Pharm Tech Res, 2010; 2(2): 1316-24.
9. Halde S, Mungantiwar A, Chintamaneni M. Simple, precise and accurate HPLC method of analysis for Nevirapine suspension from human plasma. Indian J Pharm Sci, 2011; 73(4): 416–21.
10.Rao JVLNS, Anantha DK, Naveen BMV, Jayathirtha RV. Simultaneous determination of Lamivudine, zidovudine and Nevirapine in tablet dosage forms by RP-HPLC method. RJC, 2010; 3(1): 94-9.
11.Stieger N, Liebenberg W, Wessels JC. UV spectrophotometric method for the identification and solubility determination of Nevirapine. Pharmazie, 2009; 64: 690-91. 12.Ahmed MSM, Sudhakar RJ, Chakravarth IE, Prabhavathi K. A simple spectrophotometric
determination of Nevirapine in pharmaceutical dosage form. J Chem Pharm Res, 2011; 3(4): 172-76.
13.Amudhavalli V, Lakshmi KS. Derivative spectrophotometric estimation of Nevirapine in pharmaceutical dosage form. J Chem Pharm Res, 2010; 2(5): 502-5.
14.Minaketan S, Ravi KBBV, Tripathy NK, Patro SK. Estimation of Nevirapine by difference spectrophotometric method in bulk and pharmaceutical dosage form. IJDFR, 2013; 4(1): 54-63.
15.Dr. Rajendran NN. Validation of UV spectroscopy for simultaneous estimation of Stavudine, Lamivudine and Nevirapine in tablet formulations. IJPSR, 2014; 5: 655-64. 16.Himaja M, Kalpana J, Anbarasu C. RP-HPLC and UV quantification of antiretroviral
drugs in fixed dosage forms. URJC, 2014; 2(2): 17-20.
17.Hemanth K, Sudha V, Soumya S, Geetha R. Comparison of HPLC & spectrophotometric
methods for estimation of antiretroviral drug content in pharmaceutical products. Indian J Med Res, 2010; 132: 390-94.
![Figure 1: Nevirapine (11-cyclopropyl-4-methyl-5, 11-dihydro-6H-dipyrido [3, 2-b: 2’, 3’-e] [1, 4] diazepin-6-one)](https://thumb-us.123doks.com/thumbv2/123dok_us/865385.598086/6.595.96.501.376.565/figure-nevirapine-cyclopropyl-methyl-dihydro-dipyrido-diazepin-one.webp)