weeks and 4 years of resistance training
MASSEY, G.J, BALSHAW, T.G, MADEN-WILKINSON, Tom
<http://orcid.org/0000-0002-6191-045X> and FOLLAND, J.P
Available from Sheffield Hallam University Research Archive (SHURA) at:
http://shura.shu.ac.uk/17748/
This document is the author deposited version. You are advised to consult the
publisher's version if you wish to cite from it.
Published version
MASSEY, G.J, BALSHAW, T.G, MADEN-WILKINSON, Tom and FOLLAND, J.P
(2018). Tendinous tissue properties after short and long-term functional overload:
Differences between controls, 12 weeks and 4 years of resistance training. Acta
Physiologica, 222 (4), e13019.
Copyright and re-use policy
For Peer Review
Tendinous tissue properties after short and long-term functional overload: Differences between controls, 12
weeks and 4 years of resistance training
Journal: Acta Physiologica
Manuscript ID APH-2017-07-0323.R1
Manuscript Type: Regular Paper
Date Submitted by the Author: n/a
Complete List of Authors: Massey, Garry; Arthritis Research UK, Centre for Sport, Exercise and Osteoarthritis, Loughborough University; Loughborough University, School of Sport, Exercise and Health Sciences
Balshaw, Thomas; Arthritis Research UK, Centre for Sport, Exercise and Osteoarthritis, Loughborough University; Loughborough University, School of Sport, Exercise and Health Sciences
Maden-Wilkinson, Thomas; Loughborough University, School of Sport, Exercise and Health Sciences ; Sheffield Hallam University - Collegiate Crescent Campus, Faculty of Health and Wellbeing
Folland, JP; Arthritis Research UK, Centre for Sport, Exercise and
Osteoarthritis, Loughborough University; Loughborough University, School of Sport, Exercise & Health Sciences
Key Words: Aponeurosis, Hypertrophy, Muscle, Resistance Training, Stiffness, Tendon, Young's modulus
For Peer Review
Tendinous tissue properties after short and long-term functional overload:
1
Differences between controls, 12 weeks and 4 years of resistance training
2
3
Authors:
4
Massey, G.J.1,2, Balshaw, T.G.1,2, Maden-Wilkinson, T.M.2,3, Folland, J.P.1,2 5
6
Affiliations:
7
1
Arthritis Research UK Centre for Sport, Exercise and Osteoarthritis, Loughborough 8
University, Leicestershire, UK. 9
2
School of Sport, Exercise, and Health Sciences, Loughborough University, Leicestershire, 10
UK 11
3
Faculty of Health and Wellbeing, Collegiate Campus, Sheffield Hallam University, 12
Sheffield, UK. 13
14
Short Title:
15
Tendon adaptation to functional overload 16
17
Corresponding author:
18
Jonathan P.Folland 19
School of Sport, Exercise, and Health Sciences 20
Loughborough University, Leicestershire, UK, LE11 3TU 21
Email: J.P.Folland.lboro.ac.uk 22
Phone: +44(0) 1509 226334 23
Fax: N/A 24
25 2
For Peer Review
Abstract
26
Aim: The potential for tendinous tissues to adapt to functional overload, especially after 27
several years of exposure to heavy resistance training is largely unexplored. This study 28
compared the morphological and mechanical characteristics of the patellar tendon and knee-29
extensor tendon-aponeurosis complex between young men exposed to long-term (4 years; 30
n=16), short-term (12 weeks; n=15) and no (untrained controls; n=39) functional overload in 31
the form of heavy resistance training. Methods: Patellar tendon cross-sectional area, vastus-32
lateralis aponeurosis area and quadriceps femoris volume, plus patellar tendon stiffness and 33
Young’s modulus, and tendon-aponeurosis complex stiffness, were quantified with MRI, 34
dynamometry and ultrasonography. Results: As expected long-term trained had greater 35
muscle strength and volume (+58% and +56% vs untrained, both P<0.001), as well as a 36
greater aponeurosis area (+17% vs untrained, P<0.01), but tendon cross-sectional area (mean 37
and regional) was not different between groups. Only long-term trained had reduced patellar 38
tendon elongation/strain over the whole force/stress range , whilst both short-term and long-39
term overload groups had similarly greater stiffness/Young’s modulus at high force/stress 40
(short-term +25/22%, and long-term +17/23% vs untrained; all P<0.05). Tendon-aponeurosis 41
complex stiffness was not different between groups (ANOVA, P = 0.149). Conclusion:
42
Despite large differences in muscle strength and size, years of resistance training did not 43
induce tendon hypertrophy. Both short-term and long-term overload, demonstrated similar 44
increases in high force mechanical and material stiffness, but reduced elongation/strain over 45
the whole force/stress range occurred only after years of overload, indicating a force/strain 46
specific time-course to these adaptations. 47
48
Key Words: Aponeurosis, Hypertrophy, Muscle, Resistance Training, Stiffness, Tendon 49
50 2
For Peer Review
Introduction
51
Tendons are integral to in vivo neuromechanical function transmitting skeletal muscle 52
contractile force to the skeleton whilst also optimising the contractile conditions via their 53
viscoelastic properties.1,2 The response of tendinous tissue to mechanical loading is of great 54
interest, since it may influence function3,4,5,6 and be related to injury incidence.7-9. Impaired 55
tendinous tissues properties are evident in older adults and patient groups10-14 and are 56
associated with reduced muscle-tendon unit functional capacity.3,5,11,15 Functional overload, 57
in the form of resistance exercise is widely recommended for improving musculo-skeletal 58
function of all adults,16,17 including older individuals and patients (e.g. osteoarthritis;18). 59
However our understanding of how tendons alter their properties in response to short-term 60
(weeks-months) and especially long-term (years) loading is limited. Tendinous tissue may 61
exhibit morphological (cross-sectional area), mechanical (stiffness), and material (Young’s 62
modulus) adaptations to functional overload,19,20 however the magnitude and time-course of 63
these adaptations has not been clearly elucidated. 64
65
Whilst skeletal muscle tissue has been widely documented to undergo hypertrophy in 66
response to functional overload with resistance training,21 the evidence for tendon 67
hypertrophy is equivocal; short-term resistance training studies have reported region specific 68
increases in tendon cross-sectional area22-24 or no change.25-27 Explanations for this 69
controversy could be the relatively slow turnover of collagenous tissues,28,29 and thus changes 70
in tendon size within the first 14 weeks of resistance training that are on the threshold of what 71
can be accurately detected. A substantially longer exposure to functional overload may 72
provide sufficient time for the accumulation of new tissue and thus demonstrable tendon 73
hypertrophy. However, preliminary cross-sectional studies of long-term functional overload 74
vs untrained controls have used insufficient methods to dispel this conflict, reporting tendon 75
For Peer Review
hypertrophy (low resolution ultrasound30) or no hypertrophy for 4 out of 5 tendon sites 76
(limited locations along the tendon with MRI31). The potential for aponeurosis hypertrophy in 77
response to resistance training has also had limited research attention.32,33 78
79
Short-term functional overload with resistance training (up to 14 weeks) utilising high load 80
contractions consistently increases ‘free’ tendon22,24,34,35 and tendon-aponeurosis complex 81
23,25,26,36-38 stiffness. The increased tendon stiffness after short-term resistance training is
82
typically ascribed to the approximately parallel increases in tendon Young’s modulus 83
(material stiffness24,35) rather than substantive changes in tendon size, as mentioned above. 84
However, the potential for further changes in tissue mechanical and material stiffness after 85
long-term resistance training remains largely unexplored. Preliminary reports include no 86
difference in patellar tendon material stiffness between long-term resistance trained and 87
untrained men30 and no additional changes in Achilles tendon-aponeurosis stiffness from 14 88
weeks to 18 months of resistance training in elderly women.39 However, both these studies 89
assessed stiffness at different forces/stresses, which confounds comparable measurements of 90
the curvi-linear in vivo stress-strain relationship.40,41 91
92
Whilst existing data have been insufficient to confirm if functional overload results in 93
hypertrophy of tendinous tissues, and whether mechanical and material stiffness continues to 94
adapt with prolonged resistance training, we theorised that (i) the high tendinous tissue loads 95
consequent to the known adaptations of large increases in muscle strength and size after long-96
term loading21, and (ii) prolonged exposure to these high loads would trigger substantial 97
adaptive responses in the tendinous tissues, in order to constrain peak tissue strain within sub-98
failure physiological limits42,43. The purpose of this study therefore was to compare the 99
morphological and mechanical properties of the patellar tendon (stiffness, Young’s modulus, 100
For Peer Review
CSA [mean and regional]) and quadriceps femoris tendon-aponeurosis complex (stiffness, 101
muscle volume, vastus lateralis aponeurosis area), between participants exposed to long-term 102
(4 years [LTT]) and short-term (12 weeks [STT]) resistance training and no (untrained 103
controls [UC]) functional overload. Specific hypotheses were that tendon characteristics 104
would be progressive according to the duration of overload exposure (controls<short-105
term<long-term), and specifically that long-term overload (resistance training) would be 106
characterised by not only greater muscle size and strength, but also a larger tendon and 107
aponeurosis, higher tendon Young’s modulus, as well as greater free tendon and tendon-108
aponeurosis stiffness. 109
110
Results
111
Group Characteristics
112
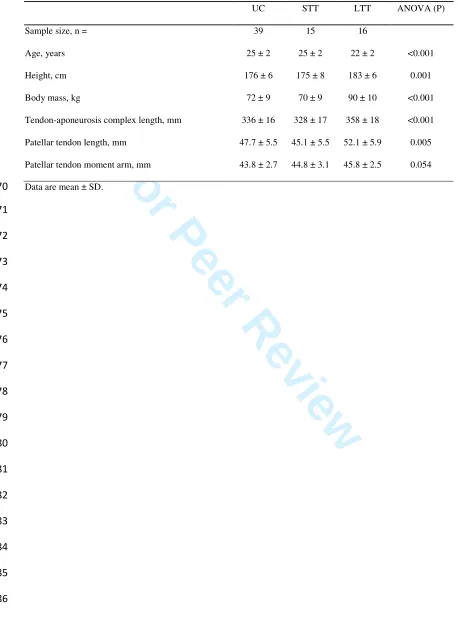
Age, height and body mass were similar between UC and STT groups (P = 0.262, P = 0.488 113
and P = 0.465 respectively; Table 1), while LTT were younger, taller and had a larger body 114
mass than UC and STT (all P ≤ 0.003). Tendon-aponeurosis complex and patellar tendon 115
length were similar between UC and STT (P = 0.114 and P = 0.195), although LTT had 116
longer tissue lengths than both UC and STT (tendon-aponeurosis complex LTT +6.5% vs UC 117
and +9.2% vs STT; both P<0.001; patellar tendon length LTT +9.8% vs UC P = 0.006, and 118
+15.5% vs STT P = 0.022). 119
120
Muscle-tendon unit size and strength
121
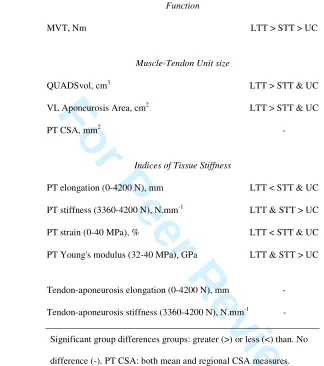
Maximal voluntary torque (Figure 4a) differed between all three groups, being considerably 122
greater in LTT than UC (+58.1%, P < 0.001, ES = 2.90 “very large”) and STT (+34.4%, P < 123
0.001, ES = 1.66 “large”). STT was also stronger than UC (+17.6%, P = 0.001, ES = 1.04 124
“moderate”). QUADSvol (Figure 4b) was considerably larger in LTT than UC (+55.7%, P < 125
For Peer Review
0.001, ES = 3.55 “very large”) and STT (+46.2%, P < 0.001, ES = 2.83 “very large”), 126
although SST was similar to UC (+7%, P = 0.179, ES = 0.42 “small”). Vastus lateralis 127
aponeurosis area (Figure 4c) was also larger in LTT than UC (+17.3%, P < 0.001, ES = 1.41 128
“large”) and STT (+13.5%, P = 0.006, ES = 1.09 “moderate”), but STT was not different to 129
UC (+3.3%, P = 0.331, ES = “small”). In contrast, patellar tendon mean CSA (Figure 4d) was 130
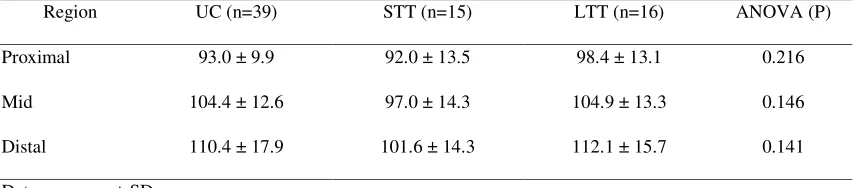
similar between groups (ANOVA P = 0.169), and this was also the case for regional patellar 131
tendon CSA (proximal, middle, distal; ANOVA P > 0.141; Table 2), demonstrating no 132
overall or region specific hypertrophy. 133
134
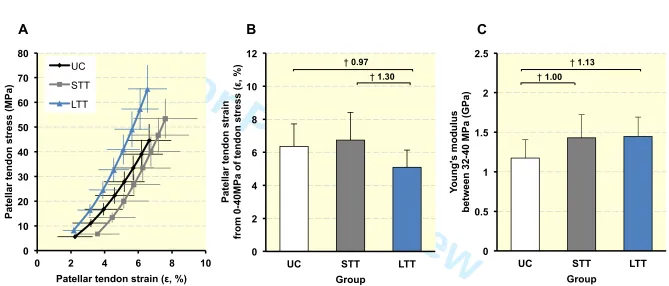
Patellar tendon mechanical properties (Table 3)
135
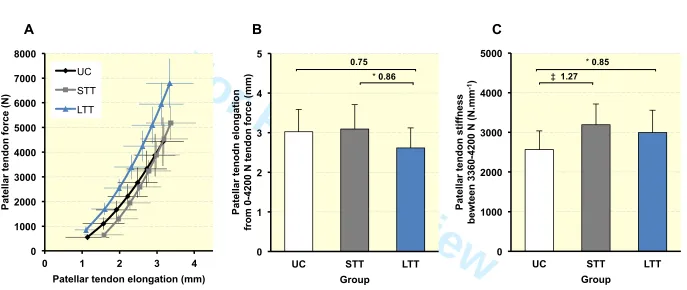
The patellar tendon force-elongation relationships (Figure 2a) indicated that patellar tendon 136
elongation at the highest common force level (4200 N, Figure 2b) of LTT was 13.5% less 137
than UC (2.6 ± 0.5 vs 3.0 ± 0.6 mm, P = 0.063, ES = 0.75 “moderate”) and 15.4% lower than 138
STT (3.1 ± 0.6 mm, P = 0.048, ES = 0.86 “moderate”), indicating greater stiffness over the 139
whole force range up to 4200 N for LTT only, whereas STT and UC were similar (P = 0.698, 140
ES = 0.10 “trivial”). However, patellar tendon stiffness measured over a high force range 141
(3360-4200N; Figure 2c) was greater for SST (+24.5%, P = 0.0004, ES = 1.27 “large”) and 142
LTT (+16.7%, P = 0.021, ES = 0.85 “moderate”) than UC, though similar for LTT and STT 143
(P = 0.287, ES = 0.35 “small”). 144
145
Patellar tendon stress-strain relationships (Figure 3a) revealed that at the common stress level 146
of 40 MPa (Figure 3b), patellar tendon strain of LTT (5.1 ± 1.0%) was 24.4% lower than UC 147
(6.4 ±1.4%, P = 0.008, ES = 1.30 “large”) and 19.9% less than STT (6.7 ± 1.7%, P = 0.006, 148
ES = 0.97 “moderate”), indicating greater material stiffness over the whole stress range up to 149
40 MPa for LTT only, whereas STT and UC were very similar (P = 0.369, ES = 0.17 150
For Peer Review
“trivial”). However, patellar tendon Young’s modulus (Figure 3c) derived over a common 151
stress range (32-40 MPa) was greater for both SST (+21.9%, P = 0.003, ES = 1.00 152
“moderate”) and LTT (+23.3%, P = 0.002, ES = 1.13 “moderate”) than UC, but was very 153
similar for LTT and STT (P = 0.855, ES = 0.06 “trivial”). 154
155
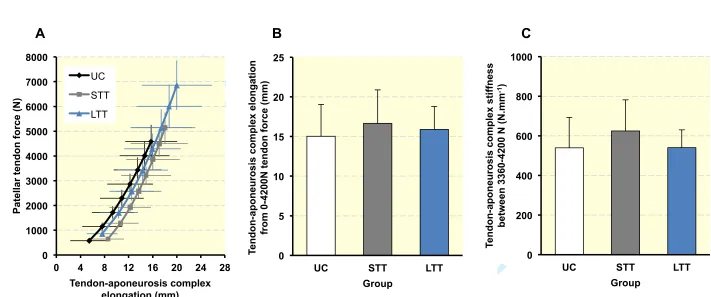
Tendon-aponeurosis complex mechanical properties (Table 3)
156
Force-elongation relationships for the tendon-aponeurosis complex (Figure 4a) showed that 157
at the common force level of 4200 N (Figure 4b), tendon-aponeurosis complex elongation 158
exhibited no main group effect (ANOVA, P = 0.375), indicating similar overall tendon-159
aponeurosis complex elongation in both resistance trained and the untrained group. Likewise, 160
tendon-aponeurosis complex stiffness (Figure 4c) was not statistically different between 161
groups (ANOVA, P = 0.149). 162
163
Discussion 164
The present study compared the morphological, mechanical and material properties of the 165
patellar tendon and knee extensor tendon-aponeurosis complex between young men exposed 166
to long-term (4 years), short-term (12 weeks) and no (untrained controls) functional overload. 167
The main findings were that despite large differences in muscle strength and size, there were 168
modest differences in aponeurosis size, greater in LTT only, and no differences in patellar 169
tendon CSA. Only LTT had reduced elongation/strain over the whole force/stress range up to 170
4200 N/40 MPa, whilst both overload groups had greater patellar tendon stiffness/Young’s 171
modulus at high force/stress than UC. Therefore short-term overload appears sufficient to 172
produce changes in high force mechanical and material stiffness, with no further adaptation 173
with prolonged exposure, but changes in elongation/strain over the whole force range 174
occurred only after years of overload (LTT). Contrary to these differences in tendon 175
For Peer Review
mechanics, tendon-aponeurosis complex stiffness and strain were similar between all three 176
groups. 177
178
Tendon and aponeurosis size
179
The duration of overload showed progressive differences in muscle strength between the 180
groups (STT +18% and LTT +58% vs UC) and muscle size was also substantially greater 181
after regular long-term loading (LTT +56% vs UC). Despite these substantial differences, and 182
contrary to our hypothesis there were no group differences in patellar tendon mean or 183
regional CSA. The similar patellar tendon CSA of STT than UC might have been expected as 184
there is contrasting evidence for tendon hypertrophy after short-term resistance training (8-14 185
weeks), that has been attributed to limited region-specific hypertrophy and/or slow tendon 186
collagen turnover.28,29 Nonetheless we hypothesised that LTT would exhibit greater tendon 187
hypertrophy, due to a combination of (i) their higher loading and stress/strain as a 188
consequence of their substantially greater strength, and (ii) prolonged regular exposure to 4 189
years of these high loads, that might provide sufficient stimulus for the disruption of tissue 190
homeostasis and time for an accumulation of tendon collagen.44 However there were no 191
differences in tendon CSA between LTT and UC despite the substantial differences in muscle 192
strength and size, indicating that tendon size does not adapt in proportion to either muscle 193
size or strength/loading. Our study utilised MRI (regarded as the most accurate method45,46) 194
to assess CSA along the full tendon length (typically 20 slices; capturing region specific 195
CSA), and images were acquired with sensitive spatial resolution (2 mm thick images, 0 mm 196
gap, pixel size 0.313 x 0.313 mm), as well as careful tendon segmentation performed on each 197
image by the same-blinded investigator. Moreover, with this procedure tendon CSA measures 198
demonstrated very good reliability (CV ≤ 3.5%), which provides confidence in the validity of 199
this data. Hitherto, cross-sectional studies of tendon size in long-term vs untrained 200
For Peer Review
individuals present conflicting evidence from unconvincing methodologies (low resolution 201
ultrasound30; limited locations along the tendon with MRI31). A sole longitudinal study used 202
mixed low and high load training of older females, reporting short-term tendon hypertrophy 203
after 14 weeks, but no further long-term (1.5 years) changes, perhaps due to the surprising 204
lack of long-term strength improvements and thus limited overload.39 In contrast our results 205
provides convincing evidence that long-term (4 years) exposure to high loads (+58% greater 206
strength and +56% greater size) is not a stimulus for tendon hypertrophy. 207
208
In support of our findings, there is evidence that functional overload via resistance training 209
does not stimulate in vivo tendon collagen synthesis,47 nor increased concentration of 210
procollagen type 1 N-propetide, a biomarker of collagen synthesis, in the patellar tendon 211
peritendinous tissue, concomitant with no change in tendon CSA after short-term resistance 212
training.27 In contrast, lower intensity higher volume loading, equivalent to endurance 213
training, might induce in vivo tendon collagen synthesis; increased peritendinous tissue 214
procollagen peptide levels,48 and uptake of radio-labelled amino acids,49 although this is not a 215
consistent finding.50,51 Furthermore long term habitual exposure to endurance training or high 216
volumes of low-moderate loading have been found to induce greater tendon size: larger 217
tendon CSA in distance runners vs non-runners52,53 and in dominant vs non-dominant limbs 218
after asymmetrical loading54. Therefore it may be that high volumes of low/moderate loading 219
may be the important stimulus for tendon hypertrophy, as chronic exposure to high load does 220
not appear to be a key stimulus. 221
222
In contrast to tendon size, LTT, but not STT, had a much larger VL aponeurosis area than UC 223
(+17%), demonstrating that aponeurosis size is responsive to the long-term functional 224
overload of the muscle-tendon unit via resistance training. This is coherent with the limited 225
For Peer Review
previous reports of greater aponeurosis size post short-term resistance training and in well-226
trained weightlifters vs untrained.32,33 The greater aponeurosis area for LTT vs UC was 227
however substantially smaller than the difference in muscle size (+17 vs +56%), which may 228
be attributable to the greater rate of myofibrillar than connective tissue collagen synthesis in 229
response to resistance exercise.28,55 230
231
Patellar Tendon Stiffness
232
In the absence of group differences in patellar tendon CSA, our results for patellar tendon 233
stiffness were attributable to parallel changes in material stiffness, which is in accordance 234
with extensive literature indicating that enhanced material properties are the primary cause of 235
increased mechancial properties.19,20 As expected, STT and LTT possessed greater high force 236
patellar tendon stiffness/Young’s modulus than UC, which is in accordance with previous 237
short-term resistance training studies22,24,30,34,35: mean change after resistance training 238
~27/22% for tendon stiffness/modulus.20 Interestingly though LTT had no greater patellar 239
tendon stiffness/Young’s modulus than STT. 240
241
However LTT did demonstrate lesser overall patellar tendon elongation/strain at a common 242
force/stress than STT and UC, and thus greater absolute and material stiffness over the whole 243
force range. Consequently short-term overload was sufficient to produce changes in high 244
force stiffness/Young’s modulus, with no further adaptation after prolonged exposure, but 245
changes in elongation/strain over the whole force range occurred only after years of overload 246
(LTT). Given the identical elongation/strain at high forces/stress after STT and LTT, the 247
effect of lower elongation/strain over the whole force range after LTT could only be due to 248
greater stiffness/young’s modulus at lower forces/stresses. Qualitatively this difference 249
appears to be due to greater resistance to strain at low stress levels (<10MPa), as the gradients 250
For Peer Review
of the stress-strain relationships after the initial most compliant region of tendon deformation 251
were equivalent in STT and LTT. Overall, our data imply that the potential mechanisms 252
(changes to internal structure and/or composition56,57) underpinning an increased high stress 253
tendon modulus, after short-term loading, are likely saturated after 12 weeks leading to a 254
plateau in adaptation, where as low stress-specific material adaptations appeared to continue 255
as these were most pronounced after long-term functional overload. This stress specific time 256
course of tendon adaptation, with decreased strain at high stresses occurring first after short-257
term loading, followed later by decreased strain at low-stresses after continued long-term 258
loading is a novel finding. More detailed longitudinal investigations are required to verify 259
these results and the mechanisms for this apparent stress specific time-course of adaptation. 260
261
The validity our findings are reinforced by the thorough measurements of elongation, 262
stiffness and strain; e.g. multiple contractions at a standardised loading rate, duplicate 263
measurement sessions, measurements at identical absolute forces. Representative data were 264
derived across two sessions to yield good inter-test reliability for all stiffness, elongation and 265
stress measurements (CV <10%). In particular our methods avoided the likely bias of higher 266
stiffness measurements for stronger individuals due to: contracting at a higher loading rate 267
during fixed duration ramp contractions; or measuring stiffness/young’s modulus at different 268
absolute forces (i.e. relative forces) on the curvilinear force-elongation/stress-strain 269
relationship. 270
271
Tendon-Aponeurosis Stiffness
272
Surprisingly, there were no group differences in tendon-aponeurosis complex mechancial 273
properties despite the presence of much larger muscle and aponeurosis size for LTT. This 274
finding is in contrast to previous reports of greater knee-extensor tendon-aponeurosis 275
For Peer Review
complex stiffness assessed with repeated measures pre and post short-term resistance 276
training.26,36,37 It is possible that a cross-sectional design lacks the sensitivity to detect 277
relatively modest differences in tendon aponeurosis stiffness. Alternatively, previous studies 278
have commonly measured stiffness at different absolute forces pre and post training, which 279
may have accentuated the scale of this training adaptation. The measurement of tendon-280
aponeurosis complex stiffness is also not considered to be as robust as that of ‘free tendon’.58 281
This is because it may reflect not only tendon-aponeurosis deformation, but also the active 282
state of the muscle fibres parallel to the aponeurosis,59 as well as the fact that single site 283
measures of aponeurosis deformation with 2-D imaging may provide only a crude index of 284
the stiffness of a 3-D structure. Further investigations could incorporate three-dimensional 285
imaging techniques (ultrasound60,61 or MRI62,63) that can capture the complex bi-axial 286
deformation of the muscle and aponeurosis along the length of the tendon-aponeurosis 287
complex. 288
289
In summary, the greater quadriceps femoris strength and volume in LTT (+58 and +56% vs
290
UC) was associated with modest increases in vastus lateralis aponeurosis area (+17% vs UC), 291
but not matched by a larger patellar tendon cross-sectional area, indicating that long-term 292
functional overload via high force resistance training does not lead to extramuscular tendon 293
hypertrophy. Short- and long-term overload groups had similar, but greater patellar tendon 294
stiffness/Young’s modulus at high force/stress than UC, but only LTT had reduced 295
elongation/strain over the whole force/stress range up to 4200 N/ 40 MPa that was 296
attributable to changes at lower force/stress. Therefore we found evidence for a stress specific 297
time-course of adaptation in the patellar tendon with short-term overload sufficient to 298
produce changes in high force mechanical and material stiffness, with no further adaptation 299
to prolonged exposure, but increased low stress stiffness only occurring after years of 300
For Peer Review
overload (LTT).301
302
Materials and Methods
303
Participants
304
Seventy young men provided written informed consent before completing this study, which 305
was approved by the Loughborough University Ethical advisory committee, and was 306
conducted according to the principles expressed in the Declaration of Helsinki. All 307
participants were healthy and free from musculoskeletal injury with no previous history of 308
tendon pathology. The untrained control group (UC, n = 39) had no lower body resistance 309
training experience for >18 months. The short-term trained group (STT, n = 15) were 310
measured post 12-weeks of supervised resistance training. The long-term trained (LTT, n = 311
16) group had 4.0 ± 0.8 (mean ± SD) years of systematic heavy-resistance training 312
experience (~3 x wk of quadriceps sessions; typical exercises were squat, lunge, step-up, leg 313
press). LTT participants typically reported some nutritional supplement consumption 314
(predominantly whey protein and creatine), although none declared illegal performance-315
enhancing substance use. 316
317
Experimental Design
318
Participants visited the laboratory for a familiarisation session, (STT were familiarised pre-319
training) and two duplicate measurement sessions that were averaged to improve the 320
reliability of the measurements. Participants were seated in a custom-built isometric strength-321
testing chair and completed a series of maximal voluntary contractions (MVCs) and ramp 322
voluntary contractions of the knee extensors as well as knee flexor MVCs of the dominant leg 323
(preferred kicking leg). MVCs established maximal voluntary torque (MVT) and ramp 324
contractions were performed to permit tissue stiffness estimation. Knee joint torque was 325
For Peer Review
recorded throughout contractions. Knee flexor surface electromyography was recorded 326
during knee flexor MVCs and knee extensor ramp contractions. All contractions were 327
performed with equivalent resting joint angle configurations. Ultrasound images of the vastus 328
lateralis and patellar tendon were recorded throughout the ramp contractions to assess tissue 329
elongation. Measurement sessions were performed at a consistent time of the day (± 2 hours),
330
separated by at least 2 days and started between 12:00–19:00 p.m. Participants were 331
instructed not to participate in strenuous physical activity, consume alcohol/refrain from 332
caffeine consumption in the 36/6 hours before measurement sessions. All participants were 333
instructed to maintain their habitual physical activity and diet throughout the study. For the 334
SST group, post-measurement sessions one and two took place 3-5 and 6-8 days following 335
the last training session. Magnetic resonance imaging (MRI) was performed to assess 336
quadriceps femoris muscle, vastus lateralis aponeurosis, and patellar tendon size. Participants 337
were instructed to refrain from strenuous physical activity in the 24 hours prior to the MRI 338
scan. For the STT group, MRI was conducted 2-3 days after the final training session and 339
prior to post measurement sessions. 340
341
Short-term trained (STT) Group: Training Intervention
342
Training sessions were completed three times per week on the same apparatus and with 343
equivalent joint angles as used for measurement sessions. After a brief warm-up of sub-344
maximal contractions of both legs, participants completed four sets of ten unilateral isometric 345
knee-extensor contractions of each leg, with sets alternating between dominant and non-346
dominant legs until 4 sets per leg had been completed. Contractions were sustained at 347
75%MVT, with 2 s rest between each contraction. In order to control the torque rise and hold 348
times, participants were presented with a target torque trace 2 s before every contraction and 349
instructed to match this target, which increased torque linearly from rest to 75% MVT over 1 350
For Peer Review
s before holding a plateau at 75%MVT for a further 3 s. MVCs were performed at the start of 351
each training week to re-establish MVT and prescribe training torques. 352
353
Torque Measurement
354
Participants were positioned in an isometric strength-testing chair with resting knee and hip 355
joint angles of ~115° and ~126° (180° = full extension), respectively. The resting joint angle 356
configurations were determined from digitisation of sagittal plane video during pilot work. 357
Adjustable straps were tightly fastened across the pelvis and shoulders to prevent extraneous 358
movement. An ankle strap (35 mm width reinforced canvas webbing) was placed ~15% of 359
tibial length (distance from lateral malleolus to knee joint space) above the medial malleolus, 360
and positioned perpendicular to the tibia and in series with a calibrated S-Beam strain gauge 361
(Force Logic, Berkshire, UK). The analogue force signal was amplified (x370; A50 362
amplifier, Force Logic UK) and sampled at 2,000 Hz using an A/D converter (Micro 1401; 363
CED, Cambridge, UK) and recorded with Spike 2 computer software (CED). In offline 364
analysis, force signals were low-pass filtered at 500 Hz using a fourth order zero-lag 365
Butterworth filter, gravity corrected by subtracting baseline force, and multiplied by lever 366
length, the distance from the knee joint space to the centre of the ankle strap, to calculate 367
torque values. 368
369
Knee Flexor Electromyography (EMG)
370
Surface EMG recordings over the biceps femoris (BF) and semitendinosus (ST) were made 371
with a wireless EMG system (Trigno; Delsys Inc, Boston, MA) were made during knee 372
flexor MVCs and knee extensor ramp contractions. Following preparation of the skin 373
(shaving, abrading and cleansing with alcohol) single differential Trigno standard EMG 374
sensors (1 cm inter electrode distance; Delsys Inc, Boston, MA) were attached over each 375
For Peer Review
muscle using adhesive interfaces. Sensors were positioned parallel to the presumed frontal 376
plane orientation of the underlying muscle fibres at 45% of thigh length (distance from the 377
greater trochanter to the lateral knee joint space) measured from the popliteal crease. EMG 378
signals were amplified at source (x300; 20-450 Hz bandwidth) before further amplification 379
(overall effective gain x 909) and sampled at 2000 Hz via the same A/D converter and 380
computer software as the force signal, to enable data synchronization. In offline analysis, 381
EMG signals were corrected for the 48 ms delay inherent to the Trigno EMG system. 382
383
Knee Extension and Flexion Maximal Voluntary Contractions
384
Following a brief warm-up (3 s contractions at 50% [x3], 75% [x3] and 90% [x1] of 385
perceived maximal), participants performed 3-4 MVCs and were instructed to either ‘push as 386
hard as possible’ (knee extension) or ‘pull as hard as possible’ (knee flexion) for 3-5 s and 387
rest ≥ 30 s. A horizontal cursor indicating the greatest torque obtained within the session was 388
displayed for biofeedback and verbal encouragement was provided during all MVCs. The 389
highest instantaneous torque recorded during any MVC was defined as MVT. During knee 390
flexor MVCs EMG amplitude was calculated as the root mean square (RMS) of the filtered 391
EMG signal of the BF and ST over a 500 ms epoch at knee flexion MVT (250 ms either side) 392
and averaged across the two muscles to give knee flexor EMGMAX.
393
394
MRI measurement of Muscle Tendon Unit Morphology and Moment Arm
395
T1-weighted MR (1.5 T Signa HDxt, GE) images of the dominant leg (thigh and knee) were 396
acquired in the supine position at a knee angle of 163° (due to constraints in knee coil size) 397
and analysed using OsiriX software (Version 6.0, Pixmeo, Geneva, Switzerland). Using a 398
receiver 8-channel whole body coil, axial images (time of repetition/time to echo 550/14, 399
image matrix 512 x 512, field of view 260 x 260 mm, pixel size 0.508 x 0.508 mm, slice 400
For Peer Review
thickness 5 mm, inter-slice gap 0 mm) were acquired from the anterior superior iliac spine to 401
the knee joint space in two overlapping blocks. Oil filled capsules placed on the lateral side 402
of the thigh allowed alignment of the blocks during analysis. The quadriceps femoris (QF) 403
muscles (vastus lateralis [VL] vastus intermedius [VI], vastus medialis, and rectus femoris) 404
were manually outlined in every third image (i.e. every 1.5 cm) starting from the most 405
proximal image in which the muscle appeared. The volume of each muscle was calculated 406
using cubic spline interpolation (GraphPad Prism 6, GraphPad Software, Inc.). Total QF 407
volume (QUADSvol) was the sum of the individual muscle volumes.
408
409
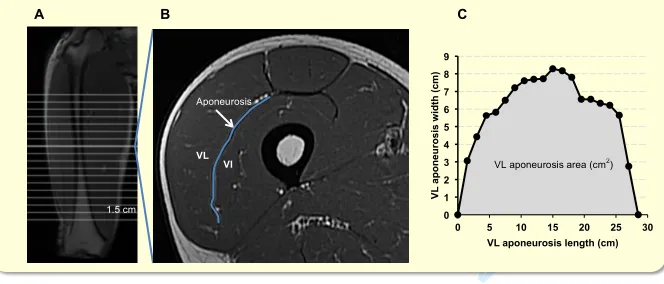
As previously described, the deep aponeurosis of the vastus lateralis muscle was defined as 410
the visible dark black segment between the VL and VI muscles in the thigh MRI images.32 411
VL aponeurosis width was defined as the transverse length (cm) of the deep aponeurosis 412
(distinct black segment) between the vastus lateralis and vastus intermedius, traced manually 413
on every third image (i.e. every 1.5 cm), starting in the most distal image where the 414
aponeurosis was visible. Aponeurosis width measures were plotted against the longitudinal 415
aponeurosis length (distance between most proximal and distal image where the aponeurosis 416
was visible [cm]). The surface area of VL aponeurosis was calculated as the area under a 417
spline curve fitted to the aponeurosis width and length plot, and termed VL aponeurosis area 418
(Figure 5). 419
420
Immediately after thigh imaging, a lower extremity knee coil was used to acquire axial (time 421
of repetition/time to echo 510/14, image matrix 512 x 512, field of view 160 x 160 mm, pixel 422
size 0.313 x 0.313, slice thickness 2 mm, inter-slice gap 0 mm) and sagittal images (time of 423
repetition/time to echo 480/14, image matrix 512 x 512, field of view 160 x 160 mm, pixel 424
size 0.313 x 0.313, slice thickness 2 mm, inter-slice gap 0 mm) of the knee joint. Contiguous 425
For Peer Review
axial images spanned patellar tendon length, which during analysis, were reconstructed to be 426
aligned perpendicular to the line of action of the patellar tendon: straight line from the 427
tendons posterior fibres insertion at the patellar apex to the posterior fibres tibial insertion. 428
Images spanned from 2 cm superior to the patellar apex to 2 cm inferior to the tendon tibial 429
insertion Patellar tendon CSA (mm2) was measured on each contiguous image along the 430
tendons length (first image where the patellar was no longer visible to the last image before 431
the tibial insertion). Images, viewed in greyscale, were sharpened and the perimeter manually 432
outlined. A spline curve was fitted to the tendon CSA values from each image and the 433
average of the spline equated to mean patellar tendon CSA (patellar tendon mean CSA). The 434
average of the spline CSA’s measured over proximal, middle and distal thirds was defined as 435
proximal, mid and distal patellar tendon region CSA. Sagittal plane images were used to 436
determined patellar tendon moment arm, the perpendicular distance from the patellar tendon 437
line of action to the tibio-femoral contact point, which was the midpoint of the distance 438
between the tibio-femoral contact points of the medial and lateral femoral condyles. 439
440
Ramp Contractions for Determination of Tissue Stiffness
441
Tissue stiffness was derived from synchronous recordings of torque and tissue elongation 442
(see below, corrected for passive tissue displacement via video recording of knee joint 443
changes) during isometric knee extension ramp contractions. Participants completed two sub-444
maximal (~75% MVT) practice ramp contractions prior to five maximal attempts with 90 s 445
rest between contractions. Prior to each ramp contraction participants were shown a target 446
torque-time trace on a computer monitor that increased at a constant gradient (50 Nm.s-1 447
loading rate) from zero up to MVT. They were instructed to match the target trace as closely 448
as possible for as long as possible (i.e. up to MVT), and real-time torque was displayed over 449
the target torque-time trace for feedback. The preceding knee extensor MVCs and sub-450
For Peer Review
maximal contractions were considered sufficient to elicit tissue preconditioning. The three 451
most suitable ramp contractions, according to highest peak torque, the closeness to the target 452
loading rate and ultrasound image clarity, were analysed and measurements averaged across 453
these three contractions. 454
455
Measurement of Tissue Elongation
456
Video images from two ultrasound machines and one video camera were captured to obtain 457
tissue and knee joint displacements during ramp contractions. An ultrasound probe (7.5 MHz 458
linear array transducer, B-mode, scanning width 60mm and depth 50 mm; Toshiba Power 459
Vision 6000, SSA-370A: Otawara-Shi, Japan) was fitted into a custom made high-density 460
foam cast that was strapped to the lateral aspect of the thigh with the mid-point of the probe 461
positioned at ~50 % thigh length. The probe was aligned so the fascicles inserting into the 462
vastus lateralis (VL) muscle deep aponeurosis could be visualized at rest and during 463
contraction. An echo-absorptive marker (multiple layers of transpore medical tape) was 464
placed beneath the ultrasound probe to provide a reference for any probe movement over the 465
skin. Another ultrasound probe (5-10 MHz linear array transducer, B-mode, scanning width 466
92 mm and depth 65 mm, EUP-L53L; Hitachi EUB-8500) was fitted into a custom made 467
high-density foam cast that was held firmly over the anterior aspect of the knee with the 468
probe aligned longitudinal to the patellar tendon such that the patellar apex and insertion of 469
the posterior tendon fibres at the tibia could be visualized at rest and throughout the 470
contraction. The ultrasound machines were interfaced with the computer collecting torque 471
data in Spike 2 and the video feeds were recorded synchronously with torque using Spike 2 472
video capture at 25 Hz. During off-line analysis tissue elongation was tracked frame-by-473
frame using public-domain (www.cabrillo.edu/~dbrown/tracker) semi-automatic video
474
analysis software: Tracker, version 4.86. The distance measured over the surface of the skin 475
For Peer Review
between the echo-absorptive marker on the VL and the tibial tuberosity defined resting 476
tendon-aponeurosis complex length. VL fascicle deep aponeurosis cross point displacement 477
relative to the skin marker provided a measure of tendon-aponeurosis elongation. Patellar 478
tendon elongation was determined by the longitudinal displacement of the patella apex and 479
the tendon tibial insertion. The distal insertion of the patellar tendon was not monitored for 480
the purpose of estimating overall tendon-aponeurosis displacement. To enable correction of 481
tissue displacement due to joint angle changes during ramp contractions individual ratios of 482
tissue displacement relative to joint angular displacement (mm/°) were obtained from passive 483
movements (i.e. plotting the tissue displacement-knee joint angle relationship). This ratio was 484
used to determine tissue displacement resulting from knee angle change during ramp 485
contractions, which was subsequently subtracted from total measured displacement. 486
Corrections were only applied to aponeurosis displacement. Tendon elongation under passive 487
conditions was deemed negligible. Passive movements were conducted prior to the ramp 488
contractions. Participants were instructed to completely relax as their knee was moved 489
through 90 to 130°. During passive movements and ramp contractions, knee joint angle 490
(angle between visible markers placed on the greater trochanter, lateral knee joint space and 491
lateral malleolus) was derived from sagittal plane video recorded using a camera mounted on 492
a tripod positioned (1.5 m) perpendicular to the strength-testing chair. The video camera was 493
interfaced with a computer and recorded using spike 2 video capture at 25 Hz 494
(simultaneously with force, EMG, and ultrasound images during the ramp contractions) and 495
analysed via Tracker software. 496
497
Calculation of Tendon Force
498
Patellar tendon force was calculated by dividing external absolute knee extensor torque by 499
the patellar tendon moment arm length. Direct measures of moment arm where acquired at 500
For Peer Review
rest from MRI images as indicated above (MRI measurement). Due to constraints in the size 501
of the knee coil, sagittal images were acquired in an extended knee position (~163°). 502
Moment arm length for any specific knee angle measured at rest or during ramp contraction 503
was estimated from previously published data fitted with a quadratic function64 scaled to each 504
participant’s measured moment arm length at 163°. Absolute internal knee extensor torque 505
was given by summing net knee extension torque and the estimated knee flexor co-506
contraction torque. Antagonist knee flexor torque was estimated by expressing the average 507
knee flexor EMG amplitude (RMS 50 ms moving window) during ramp contractions relative 508
to the knee flexor EMGMAX and multiplying by the knee flexor MVT (assuming a linear
509
relationship between EMG amplitude and torque). During analysis, torque and EMG 510
amplitude were down-sampled to 25 Hz to match the ultrasound video frequency. 511
512
Calculation of Tissue Stiffness and Tendon Young’s Modulus
513
For each of the three best ramp contractions analysed, tendon-aponeurosis (corrected for 514
passive tissue displacement) and patellar tendon elongation was plotted against total tendon 515
force (corrected for antagonist force). Force-elongation plots were fitted with a second-order 516
polynomial. Tendon-aponeurosis and patellar tendon stiffness was calculated as the gradient 517
(∆ tendon force [N]/∆ elongation [mm]; N.mm-1) of the respective force-strain curve over 80-518
100% (3360-4200N) of an absolute tendon force (4200N) that corresponded to the lowest 519
common force level attained by all participants during ramp contractions. Tendon stress was 520
obtained by dividing tendon force by mean tendon CSA. Tendon strain was the percentage 521
tendon displacement relative to the resting tendon length. Resting PT length was defined as 522
the distance between the patella apex and tibial insertion as measured prior to the ramp 523
contractions. A patellar tendon stress-strain curve was plotted and patellar tendon Young’s 524
modulus (GPa) calculated as the slope (∆ tendon stress [MPa]/∆ tendon strain [%]) of the 525
For Peer Review
stress-strain curve derived over 80-100% of an absolute common stress (40 MPa). The 526
stiffness and Young’s modulus measures derived from each of the three ramp contractions 527
analysed was averaged to give each individuals representative values. 528
529
Reproducibility and Statistical Analysis
530
The reproducibility of tendinous tissue measurements over the duplicate test sessions was 531
calculated for the whole cohort (test 1 vs test 2) as within participant co-efficient of variation 532
(CVw, %; [SD/mean]*100): elongation [0-4200 N] of the patellar tendon (7.9%) and tendon-533
aponeurosis complex (9.6%); stiffness [3360-4200 N] of the patellar tendon (9.9%) and 534
tendon-aponeurosis complex (8.6%); patellar tendon strain (8.0%) and Young’s modulus 535
(9.0%). Patellar tendon CSA measurements were highly reproducible, as indicated by the co-536
efficient of variation (CVW) of repeat measurements 12 weeks apart for a sub-sample of the
537
untrained control group (n=14): mean (2.7%), proximal (3.0%), mid (3.1%) and distal 538
(3.5%). 539
540
Muscle strength and tissue mechancial/material properties measured during the duplicate 541
laboratory sessions were averaged to produce criterion values for statistical analysis. An a 542
priori significance level of P<0.05 was set for all statistical tests which were performed using 543
SPSS Version 20.0 (IBM Corp., Armonk, NY). Descriptive data are presented as mean ± 544
standard deviation (SD) and percentage differences in the group means are given in the text. 545
The influence of group (UC, STT, LTT) on all muscle and tendinous tissue variables was 546
examined by univariate ANOVA. Main group effects were followed by least significant 547
difference (LSD) post-hoc paired comparisons to delineate between group differences; Holm-548
Bonferroni corrections were applied to LSD P-values, and between group Hedges g effect 549
For Peer Review
size (ES) was calculated.65 Effect size magnitude was classified as <0.2= “trivial”; 0.2-0.6 = 550
“small”; >0-6-1.2 = “moderate”; >1.2-2.0 = “large”; >2.0 = “very large”.66 551
552
Acknowledgements
553
None to declare 554
555
Competing Interests
556
None to declare 557
Part of this study was supported by a grant (reference 20194) awarded to Dr Folland from the 558
Arthritis Research UK Centre for Sport, Exercise and Osteoarthritis. 559
560
References
561
1. Wilson A, Litchwark G: The anatomical arrangement of muscle and tendon enhances 562
limb versatility and locomotor performance. Philos Trans R Soc Lond B. Biol Sci, 368: 563
1540-1553, 2011. 564
2. Roberts TJ: Contribution of elastic tissues to the mechanics and energetics of muscle 565
function during movement. J Exp Biol, 219: 266-275, 2017. 566
3. Onambélé GL, Narici MV, Maganaris CN: Calf muscle-tendon properties and postural 567
balance in old age. J Appl Physiol, 100: 2047-2056, 2006. 568
4. Stafilidis S, Arampatzis A: Muscle-tendon unit mechanical and morphological properties 569
and sprint performance. J Sports Sci, 25: 1035-1046, 2007. 570
5. Karamanidis K, Arampatzis A, Mademli L: Age-related deficit in dynamic stability 571
control after forward falls is affected by muscle strength and tendon stiffness. J 572
Electromyogr and Kinesiol, 18: 980-989, 2008. 573
For Peer Review
6. Mayfield DL, Cresswell AG, Litchwark GA. Effects of series elastic compliance on 574
muscle force summation and the rate of force rise. J. Exp. Biol, 219: 3261-3270, 2016. 575
7. Kvist M: Achilles tendon injuries in athletes. Sports Med, 18: 173-201, 1994. 576
8. Archambault JM, Wiley JP, Bray RC: Exercise loading of tendons and the development
577
of overuse injuries. A review of current literature. Sports Med 20: 77-89, 1995. 578
9. Roberts TJ, Konow N: How tendons buffer energy dissipation in muscle. Exerc Sport Sci
579
Rev, 41: 186-193, 2013. 580
10.Arya S, Kulig K: Tendinopathy alters mechanical and material properties of the Achilles 581
tendon. J Appl Physiol, 108: 670-675, 2010. 582
11.Matschke V, Jones JG, Lemmey AB, Maddison PJ, Thom JM: Patellar tendon properties
583
and lower limb function in rheumatoid arthritis and ankylosing spondylitis versus healthy 584
controls: a cross-sectional study. Scientific World Journal, 2013:514743, 2013. 585
12.Stenroth L, Peltonen J, Cronin NJ, Sipilä S, Finni T: Age-related differences in Achilles 586
tendon properties and triceps surae muscle architecture in vivo. J Appl Physiol, 113: 587
1537-1544, 2012. 588
13.Nielsen RH, Couppé C, Jensen JK, Olsen MR, Heinemeier KM, Malfait F, Symoens S, 589
De Paepe A, Schjerling P, Magnusson SP, Remvig L, Kjaer M: Low tendon stiffness and 590
abnormal ultrastructure distinguish classic Ehlers-Danlos syndrome from benign joint 591
hypermobility syndrome in patients. FASEB J, 28: 4668-4676, 2014. 592
14.Couppé C, Svensson RB, Kongsgaard M, Kovanen V, Grosset JF, Snorgaard O, Bencke
593
J, Larsen JO, Bandholm T, Christensen TM, Boesen A, Helmark IC, Aagaard P, Kjaer M, 594
Magnusson SP. Human Achilles tendon glycation and function in diabetes. J Appl 595
Physiol, 120: 130-137, 2016. 596
15.Stenroth L, Sillanpää E, McPhee JS, Narici MV, Gapeyeva H, Pääsuke M, Barnouin Y,
597
Jean-Hogrel JY, Butler-Browne G, Bijlsma A, Meskers CG, Maier AB, Finni T, Sipilä S. 598
For Peer Review
Plantar flexor muscle–tendon properties are associated with mobility in healthy older 599
adults. J Gerontol A Biol Sci Med Sci, 70: 996-1002, 2015. 600
16.Liu CJ, Latham NK: Progressive resistance strength training for improving physical 601
function in older adults. Cochrane Database Sys Rev,3: 1-272, 2009. 602
17.Ratamess NA, Alvar B., Evetoch T., Housh TJ, Kibler W, Kraemer WJ, Triplett: 603
Progression Models in Resistance Training for Healthy Adults. Med Sci Sports Exerc, 41: 604
687-708, 2009. 605
18.Yanan L, Youxin S, Shaoqing C, Yingjie Z, Ziyi Z, Changyan L, Meili L, Feiwen L, 606
Shuzhen L, Zhen H, Yiru W, Lu S, Wenting W, Zhengxuan Z, Xu W, Naixi Z: The 607
effects of resistance exercise patients with knee osteoarthritis: a systematic review and 608
meta-analysis. Clin Rehabil 30: 947-959, 2016. 609
19.Bohm S, Mersmann F, Arampatzis A: Human tendon adaptation in response to
610
mechanical loading: a systematic review and meta-analysis of exercise intervention 611
studies on healthy adults. Sports Med Open 1: 7, 2015. 612
20.Wiesinger HP, Kösters A, Müller E, Seynnes OR: Effects of increased loading on in vivo 613
tendon properties: a systematic review. Med Sci Sports Exerc, 47: 1885-1895, 2015. 614
21.Folland JP, Williams AG: The adaptations to strength training: morphological and 615
neurological contrbutions to increased strength. Sports Med, 37:145-168. 2007 616
22.Kongsgaard M, Reitelseder S, Pedersen TG, Holm L, Aagaard P, Kjaer M, Magnusson 617
SP: Region specific patellar tendon hypertrophy in humans following resistance training. 618
Acta Physiol, 191: 111-121, 2007. 619
23.Arampatzis A, Karamanidis K, Albracht K: Adaptational responses of the human Achilles 620
tendon by modulation of the applied cyclic strain magnitude. J Exp Biol, 210: 2743-2753, 621
2007. 622
For Peer Review
24.Seynnes OR, Erskine RM, Maganaris CN, Longo S, Simoneau EM, Grosset JF, Narici 623
MV: Training-induced changes in structural and mechanical properties of the patellar 624
tendon are related to muscle hypertrophy but not to strength gains. J Appl Physiol 107: 625
523-530, 2009. 626
25.Arampatzis A, Peper A, Bierbaum S, Albracht K: Plasticity of human Achilles tendon 627
mechanical and morphological properties in response to cyclic strain. J Biomech, 43: 628
3073-3079, 2010. 629
26.Kubo K, Ikebukuro T, Maki A, Yata H, Tsunoda N: Time course of changes in the human
630
Achilles tendon properties and metabolism during training and detraining in vivo. Eur J 631
Appl Physiol, 112: 2679-2691, 2012. 632
27.Bloomquist K, Langberg H, Karlsen S, Madsgaard S, Boesen M, Raastad T: Effect of 633
range of motion in heavy load squatting on muscle and tendon adaptations. Eur J Appl 634
Physiol, 113: 2133-2142, 2013. 635
28.Smith K, Rennie MJ: New approaches and recent results concerning human-tissue 636
collagen synthesis. Curr Opin Clin Nutr Metab Care, 10: 582-590, 2007. 637
29.Heinemeier KM, Schjerling P, Heinemeier J, Magnusson SP, Kjaer M: Lack of tissue 638
renewal in human adult Achilles tendon is revealed by nuclear bomb (14)C. FASEB J, 639
27: 2074-2079, 2013. 640
30.Seynnes OR, Kamandulis S, Kairaitis R, Helland C, Campbell, EL, Brazaitis M, 641
Skurvydas A, Narici MV: Effect of androgenic-anabolic steroids and heavy strength 642
training on patellar tendon morphological and mechanical properties. J Appl Physiol, 115: 643
84-89, 2013. 644
31.Fukutani A, Kurihara T: Tendon cross-sectional area is not associated with muscle 645
volume. J Appl Biomech, 31: 176-180, 2015. 646
For Peer Review
32.Abe T, Kumagai K, Bemben MG: Muscle aponeurosis area is hypertrophied and normal
647
muscle. J. Trainol, 1: 23-27, 2012. 648
33.Wakahara T, Ema R, Miyamoto N, Kawakami Y: Increase in vastus lateralis aponeurosis
649
width induced by resistance training: implications for a hypertrophic model of pennate 650
muscle. Eur J Appl Physiol, 115: 309-316, 2015. 651
34.Malliaras P, Kamal B, Nowell A, Farley T, Dhamu H, Simpson V, Morrissey D, 652
Langberg H, Maffuli N, Reeves ND: Patellar tendon adaptation in relation to load-653
intensity and contraction type. J Biomech, 46: 1893-1899, 2013. 654
35.McMahon GE, Morse CI, Burden A, Winwood K, Onambélé-Pearson GL: The
655
manipulation of strain, when stress is controlled, modulates in vivo tendon mechanical 656
properties but not systematic TGF-B1 levels. Physiol Rep, 1: e00091, 2013. 657
36.Kubo K, Kanehisa H, Fukunaga T: Effect of different duration isometric contractions on 658
tendon elasticity in human quadriceps muscles. J Physiol, 536: 639-655, 2001. 659
37.Kubo K, Ikebukuro T, Yaeshima K, Yata H, Tsunoda N, Kaneshisa H: Effects of static 660
and dynamic training in the stiffness and blood volume of tendon in vivo. J Appl Physiol 661
106: 412-417, 2009. 662
38.Bohm S, Mersmann F, Tettke M, Kraft M, Arampatzis A: Human Achilles tendon 663
plasticity in response to cyclic strain: effect of strain rate and duration. J Exp Biol, 217: 664
4010-4017, 2014. 665
39.Epro G, Mierau A, Doerner J, Luetkens JA, Scheef L, Kukuk GM, Boecker H, Maganaris
666
CN, Brüggemann GP, Karamanidis K: The Achilles tendon is mechanosensitive in older 667
adults: adaptations following 14 weeks versus 1.5 years of cyclic strain exercise. J Exp 668
Biol, 2220: 1008-1018, 2017. 669
40.Maganaris CN, Paul JP: Load-elongation characteristics of in vivo human tendon and 670
aponeurosis. J Exp Biol, 203: 751-756, 2000. 671
For Peer Review
41.Maganaris CN, Paul JP: Tensile properties of the in vivo human gastrocnemius tendon. J 672
Biomech 35: 1639-1646, 2002. 673
42.Matson A, Konow N, Miller S, Konow PP, Roberts TJ: Tendon material properties vary
674
and are interdependent among turkey hindlimb muscles. J Exp Biol, 215: 3552-3558, 675
2012. 676
43. LaCroix AS, Duenwald-Kuehl SE, Lakes RS, Vanderby R Jr: Relationship between 677
tendon stiffness and failure: a metanalysis. J Appl Physiol, 115: 43-51, 2013. 678
44.Svensson RB, Heinemeier KM, Couppé C, Kjaer M, Magnusson SP: Effect of aging and
679
exercise on the tendon. J Appl Physiol, 121: 1237-1246, 2016. 680
45.Couppé C, Svensson RB, Sødring-Elbørond V, Hansen P, Kjaer M, Magnusson SP. 681
Accuracy of MRI technique in measuring tendon cross-sectional area. Clin Physiol Funct 682
Imag, 34: 237-241, 2014. 683
46.Kruse A, Stafilidis S, Tilp M. Ultrasound and magnetic resonance imaging are not 684
interchangeable to assess the Achilles tendon cross sectional-area. Eur J Appl Physiol, 685
117: 77-82, 2017. 686
47.Sullivan BE, Carroll CC, Jemiolo B, Trappe SW, Magnusson SP, Døssing S, Kjaer M, 687
Trappe TA: Effect of acute resistance exercise and sex on human patellar tendon 688
structural and regulatory mRNA expression. J Appl Physiol, 106: 468-475, 2008. 689
48.Langberg H, Skovgaard D, Karamouzis M, Bulow J, Kjaer M: Metabolism and
690
inflammatory mediators in the peritendinous space measured by microdialysis during 691
intermittent isometric exercise in humans. J Physiol, 515: 919-927, 1999. 692
49.Miller BF, Olesen JL, Hansen M, Døssing S, Crameri RM, Welling RJ, Langberg H, 693
Fyvbjerg A, Kjaer M, Babraj JA, Smith K, Rennie MJ: Coordinated collagen and muscle 694
protein synthesis in human patella tendon and quadriceps muscle after exercise. J Physiol, 695
567: 1021-1033, 2005. 696
For Peer Review
50.Dideriksen K, Sindby AK, Krogsgaard M, Schjerling P, Holm L, Langberg H: Effect of
697
acute exercise on patella tendon protein synthesis and gene expression. Springerplus, 2: 698
109, 2013. 699
51.Heinemeier KM, Bjerrum SS, Schjerling P, Kjaer M: Expression of extracellular matrix 700
components and related growth factors in human tendon and muscle after acute exercise. 701
Scand J Med Sci Sports, 23: e150-e161, 2013. 702
52.Kongsgaard M, Aagaard P, Kjaer M, Magnusson SP: Structural Achilles tendon
703
properties in athletes subjected to different exercise modes and in Achilles tendon rupture 704
patients. J Appl Physiol, 99: 1965-1971, 2005. 705
53.Wiesinger HP, Rieder F, Kösters A, Müller E, & Seynnes OR: Are sport-specific profiles 706
of tendon stiffness and cross-sectional area determined by structural or functional 707
integrity? PLoS One, 11: e0158441, 2016. 708
54.Couppé C, Kongsgaard M, Aagaard P, Hansen P, Bojsen-Moller J, Kjaer M, Magnusson
709
SP: Habitual loading results in tendon hypertrophy and increased stiffness of the human 710
patellar tendon. J Appl Physiol, 105: 805-810, 2008. 711
55.Babraj JA, Cuthbertson DJ, Smith K, Langberg H, Miller B, Krogsgaard MR, Kjaer M, 712
Rennie MJ: Collagen synthesis in human musculoskeletal tissues and skin. Am J Physiol 713
Endocrinol Metab, 289: E864-869, 2005. 714
56.Kjaer M, Jørgensen NR, Heinemeier K, Magnusson SP: Exercise and regulation of bone
715
and collagen tissue biology. Prog Mol Biol Transl Sci, 135: 259-291, 2015. 716
57.Buchanan CI, Marsh R: Effects of exercise on the biomechanical, biochemical and 717
structural properties of tendons. Comp Biochem Physiol A Mol Integr Physiol, 133: 718
1101-1107, 2002. 719
For Peer Review
58.Seynnes OR, Bojsen-Møller J, Albracht K, Arndt A, Cronin NJ, Finni T, Magnusson SP:
720
Ultrasound-based testing of tendon mechanical properties: a critical evaluation. J Appl 721
Physiol, 118: 133-141, 2015. 722
59.Lieber R, Leonard M, Brown-Maupin C: Effects of muscle contraction on the load-strain 723
properties of frog aponeurosis and tendon. Cells Tissues Organs, 166: 48-54, 2000. 724
60.Farris DJ, Trewartha G, McGuigan MP, Litchwark GA: Differential strain patterns of 725
human Achilles tendon determined in vivo with freehand three-dimensional ultrasound 726
imaging. J Exp Biol, 216: 594-600, 2013. 727
61.Raiteri BJ, Cresswell AG, Lichtwark GA: Three-dimensional geometrical changes of the
728
human tibialis anterior muscle and its central aponeurosis measured with three-729
dimensional ultrasound during isometric contractions. PeerJ, 4: e2260, 2016. 730
62.Iwanuma S, Akagi R, Kurihara T, Ikegawa S, Kanehisa H, Fukunaga T, Kawakami Y: 731
Longitudinal and transverse deformation of human Achilles tendon induced by isometric 732
plantar flexion at different intensities. J Appl Physiol, 6: 1615-1621, 2011. 733
63.Reeves ND, Cooper G: Is human Achilles tendon deformation greater in regions where 734
cross-sectional area is smaller? J Exp Biol, 220: 1634-1642, 2017. 735
64.Kellis E, Baltzopoulos V: In vivo determination of the patella tendon and hamstrings 736
moment arms in adult males using videofluoroscopy during submaximal knee extension. 737
Clin Biomech (Bristol Avon), 14: 118-124, 1999. 738
65.Lakens D: Calculating and reporting effect sizes to facilitate cumulative science: a 739
practical primer for t-tests and ANOVAs. Front Psychol, 4; 86, 2013. 740
66.Hopkins WG, Marshall SW, Batterham AM, Hanin J: Progressive statistics for studies in 741
sports medicine and exercise science. Med Sci Sports Exerc, 41: 3-13, 2009. 742
743
744 2
For Peer Review
Physiological Relevance
745
The potential capacity for tendinous tissue to adapt to long-term functional overload via 746
heavy resistance training is unclear. Our cross-sectional data show that short-term (12 weeks) 747
and long-term (~ 4 years) resistance trained males had similar patellar tendon mechanical and 748
material (Young’s modulus) stiffness, with both resistance-trained groups having stiffer 749
tendons that untrained controls. In contrary, neither resistance-trained group had larger 750
tendon size. Furthermore, no differences in tendon-aponeurosis complex stiffness were 751
observed between groups, despite substantially greater muscle strength and size in the long-752
term resistance trained group, which was also accompanied by a larger muscle-aponeurosis 753
size. 754
755
756
757
758
759
760
761
762
763
764
765
766
767
768
769 2
For Peer Review
Table 1. Descriptive characteristics of the participants.
UC STT LTT ANOVA (P)
Sample size, n = 39 15 16
Age, years 25 ± 2 25 ± 2 22 ± 2 <0.001
Height, cm 176 ± 6 175 ± 8 183 ± 6 0.001
Body mass, kg 72 ± 9 70 ± 9 90 ± 10 <0.001
Tendon-aponeurosis complex length, mm 336 ± 16 328 ± 17 358 ± 18 <0.001
Patellar tendon length, mm 47.7 ± 5.5 45.1 ± 5.5 52.1 ± 5.9 0.005
Patellar tendon moment arm, mm 43.8 ± 2.7 44.8 ± 3.1 45.8 ± 2.5 0.054
Data are mean ± SD.
770
771
772
773
774
775
776
777
778
779
780
781
782
783
784
785
786 2
For Peer Review
787788
789
790
791
792
793
794
795
796
797
798
799
800
801
802
803
[image:35.612.95.524.88.182.2]804
Table 2. Regional patellar tendon cross-sectional area (mm2).
Region UC (n=39) STT (n=15) LTT (n=16) ANOVA (P)
Proximal 93.0 ± 9.9 92.0 ± 13.5 98.4 ± 13.1 0.216
Mid 104.4 ± 12.6 97.0 ± 14.3 104.9 ± 13.3 0.146
Distal 110.4 ± 17.9 101.6 ± 14.3 112.1 ± 15.7 0.141
Data are mean ± SD. 2
For Peer Review
Table 3. Summary of group differences in strength (maximal voluntary torque, MVT), muscle tendon 805
unit size and tissue (tendon-aponeurosis complex and patellar tendon [PT]) stiffness between long-806
term resistance trained (LTT), short-term resistance tra