Characterisation and behaviour of recycled concrete and
bricks as engineered fill.
CHIDIROGLOU, Iordanis.
Available from Sheffield Hallam University Research Archive (SHURA) at:
http://shura.shu.ac.uk/19456/
This document is the author deposited version. You are advised to consult the
publisher's version if you wish to cite from it.
Published version
CHIDIROGLOU, Iordanis. (2007). Characterisation and behaviour of recycled
concrete and bricks as engineered fill. Doctoral, Sheffield Hallam University (United
Kingdom)..
Copyright and re-use policy
See
http://shura.shu.ac.uk/information.html
Sheffield 31 1WB
1 0 1 8 9 5 4 9 4 5
f Sheffield Hallam t.iniversity Lean ;?^g and IT Sendees j Adsetti Cerwe City Campus
Sheffield 31 1WB
ProQuest Number: 10694337
All rights reserved
INFORMATION TO ALL USERS
The quality of this reproduction is dependent upon the quality of the copy submitted.
In the unlikely event that the author did not send a com plete manuscript and there are missing pages, these will be noted. Also, if material had to be removed,
a note will indicate the deletion.
uest
ProQuest 10694337
Published by ProQuest LLC(2017). Copyright of the Dissertation is held by the Author.
All rights reserved.
This work is protected against unauthorized copying under Title 17, United States C ode Microform Edition © ProQuest LLC.
ProQuest LLC.
789 East Eisenhower Parkway P.O. Box 1346
Characterisation and Behaviour of Recycled Concrete and Bricks as Engineered Fill
Iordanis Chidiroglou
A thesis submitted in partial fulfilment of the requirements of Sheffield Hallam University
for the degree of Doctor of Philosophy
— — — — * ** ■**
Abstract
Demolition waste materials mainly consist of concrete and bricks and arise from the demolition of existing structures and buildings. Environmental and economical reasons make their recycling necessary but up to date little research has been undertaken to what is perceived as low level reuse of these materials.
This project tries to understand the behavioural characteristics of three types of recycled materials to determine their potential for engineering fill applications. For this purpose their physical and mechanical characteristics have been extensively investigated. Two types of crushed concrete, one obtained straight after demolition and the other further processed to industry specifications, and one type of crushed bricks were tested.
Due to the variable nature of recycled materials large quantities were tested and their grading, particle shape and aggregate crushing and impact values established. In addition, large scale equipment was developed for the determination of their compaction and permeability characteristics.
An extensive large scale shear box test regime was used to determine the shear strength behaviour of the materials. Two different densities and maximum particle sizes were used, and their influence on the shear strength established. The degree of particle breakage was also quantified by sieving the shear box specimens before and after testing.
The comparison of the behaviour of the materials during shearing has shown that the two crushed concrete based materials behave similarly despite the different degrees of processing, but there is difference between them and the crushed brick material. The friction angles of the materials decrease with decreasing density and maximum particle size, with the reduction of the latter affecting the friction angles values more.
Acknowledgements
The author is indebted to Dr Andy Goodwin, Professor Pritpal Mangat and Dr Liz Laycock for their guidance throughout this research and would also like to thank Dr Finbarr O’Flaherty for his assistance.
Thanks must also be presented to Controlled Demolition Group Ltd for providing Materials A and to Sam Allon (Contracts) Ltd for providing Materials B and C for this research.
The author wishes to thank Stephen, Bob, Geoff, Steven, Paul, John and Les, technical staff of Sheffield Hallam University, for their valuable help in completing the testing for this investigation.
Friends that have been a rock for me since I have arrived in Sheffield and have helped immensely with this research one way or the other includes Belen, Fin, James, Helen, Howard, Mark, Esref, Margaret, Nikos G., George, Mimis and Nikos K. Your love and support will never be forgotten.
Special thanks go to Elena, Aleka, Ilia, Aristidi, Fotula, Antoni, Stella and Petro.
The author is extremely grateful to his grandfather Ilia and grandmother Athanasia for their love, support and encouragement in the past 29 years.
Candidate’s declaration
I hereby declare that no portion of the work referred to in this thesis has been submitted in
support of an application for another degree or qualification of this or any other university
or other institution of learning. All sources of information have been duly acknowledged.
Candidate
Iordanis Chidiroglou - August 2007
Director of studies
I. Chidiroglou
CONTENTS
List of Figures__________________________________________________________ I List of Tables__________________________________________________________ V
CHAPTER 1 - INTRODUCTION
1.1 Background to Research_______________________________________________1
1.2 Need and Scope of Research ______________________________________ 4
1.3 Thesis Structure______________________________________________________5
CHAPTER 2 - LITERATURE REVIEW
2.1 Introduction_________________________________________________________ 7 2.2 Crushing and Processing of Demolition Waste____________________________7 2.3 Particle Shape Classification___________________________________________ 10 2.4 Effects of Material Characteristics on Shear Strength______________________ 11 2.4.1 Particle shape________________________________________________11 2.4.2 Sample Gradation and Maximum Particle Size___________________ 13 2.4.3 Confining Pressure___________________________________________ 16 2.4.4 Density_____________________________________________________ 18 2.4.5 Particle Crushing_____________________________________________18 2.4.5.1 Factors affecting Particle Crushing______________________19 2.4.5.2 Particle crushing quantification_________________________20 2.4.6 Relation between permeability and particle crushing_______________21 2.4.7 Summary___________________________________________________ 22 2.5 Compaction_________________________________________________________ 22 2.6 Compressibility
2.7 Leachate
I. Chidiroglou
27 2.8 Recycled aggregates research__________________________________________ 28 2.9 Concluding Remarks_________________________________________________ 29
CHAPTER 3 - RATIONALE FOR EXPERIMENTAL PROGRAMME
3.1 Fundamental Aspects of Experimental Programme________________________ 32 3.1.1 Selection of Maximum Particle Size____________________________ 32 3.1.2. Testing Programme__________________________________________ 33 3.1.3 Number of Tests____________________________________________ 34 3.2 Physical Properties Testing Series______________________________________ 34 3.2.1 Shape______________________________________________________ 35 3.2.2 Grading_____________________________________________________35 3.2.3 Compaction_________________________________________________ 36 3.2.4 Aggregate Impact Value (AIV) and
Aggregate Crushing Value (ACV)___________________________________ 36
3.2.5 Freezing and Thawing ___________________________________ 36
3.3 Main Series Testing (MST)____________________________________________ 36 3.3.1 Specimens Moisture Content and Dry Density____________________ 37 3.3.2 Permeability_________________________________________________38 3.3.3 Shear Strength Testing________________________________________ 39 3.3.4 Particle Crushing_____________________________________________41
CHAPTER 4 - DESCRIPTION OF TEST EQUIPMENT
4.1 British Standard Tests_________________________________________________42 4.2 Compaction Tests____________________________________________________ 42 4.3 Climatic Chamber____________________________________________________ 43 4.4 Permeability_________________________________________________________ 44 4.5 Shear Box___________________________________________________________ 48
CHAPTER 5 - TEST PROCEDURES
5.1 Introduction_________________________________________________________ 50 5.2 Physical Properties Testing Series
I. Chidiroglou
5.2.3 Compaction_________________________________________________ 52 5.2.4 Resistance to Freezing and Thawing____________________________ 54 5.3 Main Series testing
5.3.1 Permeability________________________________________________ 55 5.3.2 Particle Crushing_____________________________________________58 5.3.3 Shear Box Testing____________________________________________58
CHAPTER 6 - TEST MATERIALS
6.1 Introduction_________________________________________________________ 62 6.2 Principles of Acquisition, Transportation, Handling and Storage____________ 62 6.3 Source and Description of Materials____________________________________ 64 6.4 Water absorption and particle density___________________________________ 69 6.5 Particle Shape
6.5.1 Angularity__________________________________________________ 69 6.5.2 Flakiness and Elongation Index________________________________ 71 6.5.3 Angularity Values____________________________________________72 6.5.4 Complete Shape Description___________________________________ 72 6.6 Compaction_________________________________________________________ 73 6.7 Aggregate Impact and Aggregate Crushing Values________________________ 80 6.8 Resistance to Freezing and Thawing____________________________________ 81
CHAPTER 7 - MAIN SERIES TEST RESULTS
7.1 Introduction_________________________________________________________ 83 7.2 Permeability_________________________________________________________83 7.3 Shear Box Testing____________________________________________________85 7.3.1 Stress-Strain Behaviour_______________________________________ 86 7.3.2 Shear Stress Values___________________________________________91 7.3.3 Volume Change Behaviour____________________________________ 92 7.3.4 Repeatability of Results_______________________________________ 96 7.4 Particle Crushing_____________________________________________________ 97
CHAPTER 8 - DISCUSSION OF RESULTS
I. Chidiroglou 8.3 Aggregate Impact and Aggregate Crushing Value Tests
8.3.1 Comparison between Material A, B and C_______________________ 101 8.3.2 Comparison with Industry Products_____________________________ 102 8.4 Freezing and thawing tests_____________________________________________104 8.5 Permeability_________________________________________________________105 8.6 Test Parameters Investigated in Shear Box and Particle Crushing Tests_______106 8.7 Particle Crushing_____________________________________________________107 8.8 Introduction to Shear Box Testing______________________________________ 109 8.9 Initial Observations on Behaviour during Shearing________________________ 110 8.10 Influence of Specimen Density on Behaviour during Shearing
8.10.1 Influence on stress-strain behaviour____________________________ 113 8.10.2 Influence on volume change behaviour_________________________ 114 8.10.3 Influence on shear strength___________________________________ 115 8.10.4 Summary of conclusions_____________________________________ 117 8.11 Influence of Maximum Particle Size on Behaviour under Shearing
8.11.1 Influence on stress-strain behaviour____________________________ 117 8.11.2 Influence on volume change behaviour_________________________ 119 8.11.3 Influence on shear strength___________________________________ 120 8.11.4 Summary of conclusions_____________________________________ 121 8.12 Influence of Normal Stress on Behaviour under Shearing
8.12.1 Influence on stress-strain behaviour____________________________ 122 8.12.2 Influence on volume change behaviour_________________________ 123 8.12.3 Influence on shear strength___________________________________ 127 8.12.4 Summary of conclusions_____________________________________ 129 8.13 Comparison of Friction Angles with AIV and ACV Tests_________________ 129 8.14 Comparison with Natural Granular Materials____________________________ 130 8.15 Engineering Fill Applications_________________________________________ 134 8.16 Comparison with other Recycled Aggregates____________________________ 135
CHAPTER 9 - CONCLUSIONS AND RECOMMENTATIQNS
References
I. Chidiroglou 143 Appendices_____________________________________________________________ 159
Appendix A______________________________________________________ 1 Appendix B______________________________________________________ 2 Appendix C______________________________________________________ 7 Appendix D______________________________________________________ 11 Appendix E______________________________________________________ 14 Appendix F______________________________________________________ 29
LIST OF FIGURES
Chapter 1
Figure 1.1: Construction and Demolition Waste Management in England
and Wales: 1999, 2001 and 2003 (Office of the Deputy Prime Minister, 2004)___ 1 Figure 1.2: Aggregates consumption in Great Britain (British Geological
Survey, 2005)__________________________________________________________ 2
Chapter 2
Figure 2.1: Diagram of Possible routes for Demolition Waste to
Re-use/ Recycling_______________________________________________________ 8 Figure 2.2: Photographs of (a) Jaw Crusher (courtesy of www.metsominerals.com) and (b) Impact Crusher (courtesy ofwww.sanger.net)________________________ 9 Figure 2.3: Three dimensional shape categories determined by the
elongation and flatness ratios (after Rosslein, 1941)__________________________ 10 Figure 2.4: Chart for determining visually the degree of angularity
(after Lees, 1964)_______________________________________________________ 11 Figure 2.5: The effect of particle shape on friction angles (after Cho et al, 2006) 12 Figure 2.6: Effect of grading on shear strength_______________________________13 Figure 2.7: Influence of material gradation of friction angles
(after Becker et al, 1972)_________________________________________________ 14 Figure 2.8: Influence of maximum particle size on friction angle of
alluvial rockfill (after Varadarajan et al, 2003)_______________________________15 Figure 2.9: Influence of maximum particle size on friction angle of
quarried rockfill (after Varadarajan et al, 2003)_____________________________ 15 Figure 2.10: Effect of normal stress on friction angles (after Leps, 1970)________ 17 Figure 2.11: Effect of normal stress on shear stress of granular material_________ 17 Figure 2.12: The effect of relative density on friction angles (after Zeller
and Wulliman, 1957)____________________________________________________ 18 Figure 2.13: Angle of internal friction against breakage factor
(after Marachi et al, 1969)________________________________________________19 Figure 2.14: Breakage Factors (Lade, Yamamuro & Bopp, 1996)______________ 21 Figure 2.15: Compression and decompression indices against particle shape
Figure 2.16: Displacement against time for sand (After Houlsby and
Psomas, 2001)__________________________________________________________ 26 Figure 2.17: Volume change behaviour of saturated and unsaturated materials
(after Sun et al, 2004)____________________________________________________ 27
Chapter 4
Figure 4.1: The large scale compaction mould_______________________________ 42 Figure 4.2: The climatic chamber and computer control system_________________43 Figure 4.3: Recorded profile of Temperature against Time for the Freezing cycle_44 Figure 4.4: Schematic of the large scale permeability cell______________________45 Figure 4.5: Schematic of the Permeability Cell (Plan View)____________________46 Figure 4.6: Permeability Cell______________________________________________46 Figure 4.7: The shear box, displacement transducers and computer logging
system_________________________________________________________________ 4 8
Chapter 5
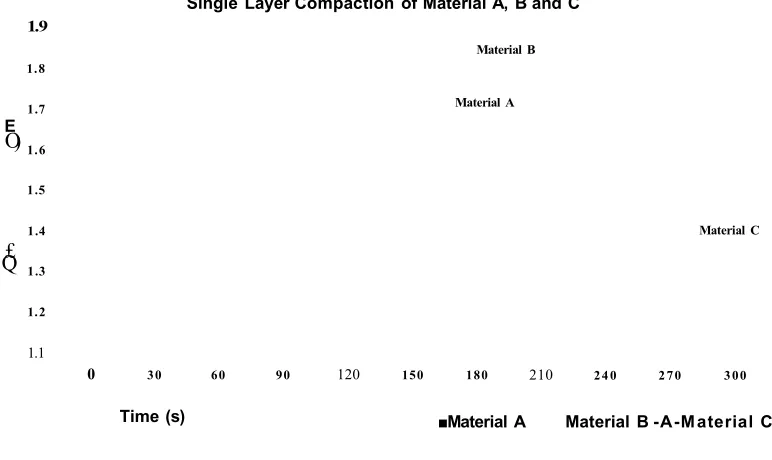
Figure 5.1: Behaviour of Materials A, B and C when compacted with 8 %
moisture content_________________________________________________________54 Figure 5.2: The containers (with material A) in the thawing tank after the
freezing cycle___________________________________________________________ 55 Figure 5.3: The permeability cell with the compaction plate___________________ 56 Figure 5.4: The shear box apparatus________________________________________ 59 Figure 5.5: The shear box on the floor with Material C compacted in it__________ 60
Chapter 6
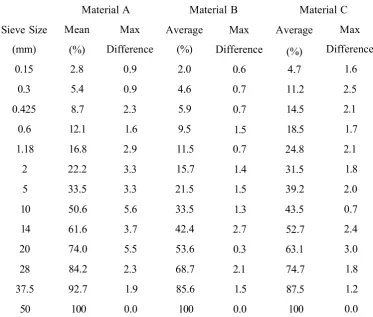
Figure 6.1: Material B and C in the laboratory storage bays____________________ 63 Figure 6.2: Grading curve for Material A____________________________________64 Figure 6.3: Grading curves for Material B and C_____________________________ 65 Figure 6.4: Average grading curves for Material A, B and C___________________ 66 Figure 6.5: Wet and dry grading curves_____________________________________ 67 Figure 6.6: Shape categories for all the size fractions for Materials A
Figure 6.8: Shape categories for all the size fractions for Materials C
(after Rosslein, 1941)____________________________________________________ 71
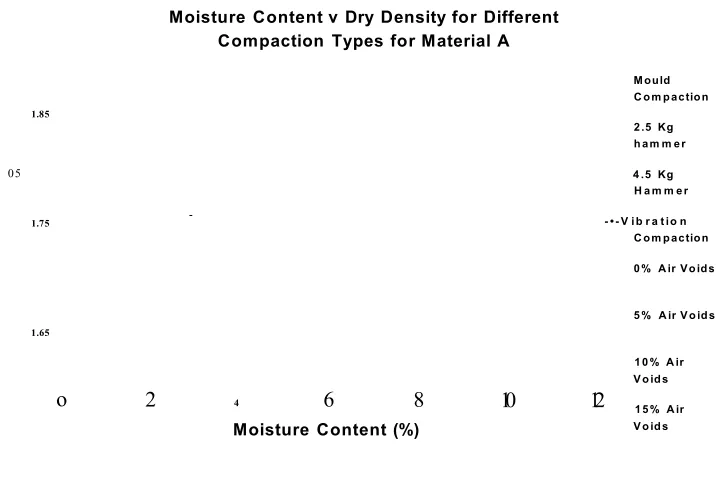
Figure 6.9: Compaction Curves for all the types of compaction for Material A 74
Figure 6.10: Variability of compaction results for Material A__________________ 75 Figure 6.11: Large scale compaction curves for Material A (1st layer)__________ 76 Figure 6.12: Large scale compaction curves for Material A (2nd layer)_________ 76
Figure 6.13: Large scale compaction curves for Material B (1st layer)__________ 77
Figure 6.14: Large scale compaction curves for Material B (2nd layer)_________ 77
Figure 6.15: Large scale compaction curves for Material C____________________ 78 Figure 6.16: Compaction curves for all Materials - 1st Layer__________________ 78 Figure 6.17: Compaction curves for all Materials - 2nd Layer__________________79
Chapter 7
Figure 7.22: Volume Change behaviour for Material C, SBT2_________________ 95 Figure 7.23: Volume Change behaviour for Material C, SBT3_________________ 95 Figure 7.24: Grading curves for all the Materials after SBT1___________________ 98 Figure 7.25: Grading curves for all the Materials after SBT2___________________ 99 Figure 7.26: Grading curves for all the Materials after SBT3___________________ 99
Chapter 8
Figure 8.1: Mean stress-strain behaviour curves at 95 kPa normal stress_________ 110 Figure 8.2: Volumetric behaviour for SBT1, 190 and 317 kPa
normal stress levels______________________________________________________ 112 Figure 8.3: Normal against shear strength for SBT1___________________________112 Figure 8.4: Axial strain values at failure for SBT1 and SBT2___________________113 Figure 8.5: Volumetric strain values at failure for SBT1 and SBT2______________114 Figure 8.6: Shear-normal stress curves for SBT1 and SBT2____________________ 115 Figure 8.7: Axial strain values at failure for SBT1 and SBT3___________________118 Figure 8.8: Volumetric strain values at failure for SBT1 and SBT3______________119 Figure 8.9: Shear-normal stress curves for SBT1 and SBT3____________________ 120 Figure 8.10: Influence of normal stress on axial strain at failure________________ 122 Figure 8.11: Influence of normal stress on volumetric strain at failure___________ 123 Figure 8.12: Possible continuations of the best fit graphs for
Materials A, B and C_____________________________________________________ 124 Figure 8.13: Changes in £v between SBT1 and SBT2 and SBT1 and SBT3_______ 125 Figure 8.14: Friction angle values in relation to normal stress levels_____________127 Figure 8.15: Shear-normal stress envelopes__________________________________ 130 Figure 8.16: Shear-normal stress envelopes comparison_______________________ 132 Figure 8.17: Influence of normal stress on friction angles______________________ 133 Figure 8.18: Friction angles of Materials and rockfill strength limits
LIST OF TABLES
Chapter 2
Table 2.1: Effect of maximum particle size on friction angles
(after Marsal, 1973)______________________________________________________16 Table 2.2: Summary of parameters affecting shear strength____________________ 22
Chapter 3
Table 3.1: Tests included in the Physical Properties Series____________________ 34 Table 3.2: Tests included in the Main Series________________________________ 37 Table 3.3: Types of shear box tests and variables investigated_________________ 40 Table 3.4: Number of tests for each of the materials for all different types of tests for all five different normal stresses________________________________________ 40
Chapter 4
Table 4.1: Calibration factors and 95% confidence limits______________________ 49
Chapter 5
Table 5.1: Mass and particle numbers tested for each of the size fractions for
Material A, B and C_____________________________________________________ 51
Chapter 6
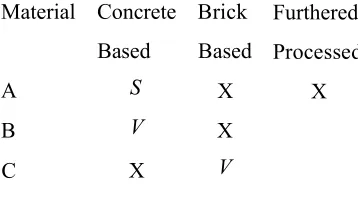
Table 6.1: Initial similarities and relations between the three types of materials 62
Table 6.2: Summary of Grain Size characteristics of test materials______________ 66 Table 6.3: Comparison between wet and dry sieving results____________________67 Table 6.4: Variability of grading results for all materials_______________________68 Table 6.5: Particle density and water absorption values________________________69 Table 6.6: Values of all the Flakiness and Elongation Indices for all
Table 6.12: Dry and soaked AIV and SD values for all the materials 81
Table 6.13: Dry and soaked ACV and SD values for all the materials 81
Table 6.14: Results of the particle percentage passing the 5 mm sieve
after the weathering process 81
Table 6.15: ACV and AIV for all the materials after the freezing - thawing
process 82
Chapter 7
Table 7.1: Values of the Coefficient of Permeability (k) for all the Materials 84
Table 7.2: Specimen parameters for shear box tests 85
Table 7.3: Particle shape for maximum particle size of 37.5 and 28 mm 85
Table 7.4: Mean peak Shear Stress values for all the materials 91
Table 7.5: Mean peak shear stress Standard Deviation values (kPa) for all the
types of shear box tests for all the materials 91
Table 7.6: Standard deviation as a percentage of mean peak shear stress values 96
Table 7.7: Upper and lower limits of the envelopes of the volumetric-axial
strain curves 97
Table 7.8: Breakage Index, BI? for SBT1, SBT2 and SBT3 98
Chapter 8
Table 8.1: Flakiness and Elongation Indexes 100
Table 8.2: AIV and ACV results 101
Table 8.3: AIV over ACV ratios 102
Table 8.4: Values for ACV, AIV, Fj and water absorption for Material
A, B and C and industry products 102
Table 8.5: Freezing thawing results 104
Table 8.6: ACV and AIV for all the materials before and after the freeze-thaw 104
Table 8.7: Flakiness and Elongation Indexes values for SBT1 and SBT3 107
Table 8.8: Breakage Indices 107
Table 8.9: Reduction in values of Bj between SBT1 and SBT2 108
Table 8.10: Comparison of AIV and ACV tests with particle crushing results 109
Table 8.11: Friction angle values for SBT1 and SBT2 116
Table 8.13: Point of zero Sv change between SBT1 and SBT2
^napier i - introduction
CHAPTER 1
INTRODUCTION
1.1 Background to Research
Construction and demolition waste arises from the construction, repair, maintenance and demolition of buildings and structures. It includes brick, concrete, topsoil and subsoil and generally contains small quantities of timber, metal and plastics. The annual amount of construction waste was almost 95 million tonnes in 2003 and accounted for about 30% of all the waste produced in England and Wales (Office of the Deputy Prime Minister, 2004). The same research showed that 47% of the construction and demolition waste was recycled either by re-use on site or, after processing, was sold off-site. Reportedly, almost 20% was used for landfill engineering and another 5% was landfilled in 2003 according to the same data (Figure 1.1).
Construction and Demolition Waste Management, 1999, 2001 and 2003
1999 2001 2003
Spread on Exempt Sites ■ Used or Disposed in Landfill ■ Recycled by Crushers/Screeners |
Source: Office of the Deputy Prime Minister: Survey of Arisings and Use of Construction, Demolition and Excavation Waste as Aggregate
^nap icr i - liiiruuucuuii
The UK goveminent faces stringent European targets to reduce the amount of waste landfilled and the European Union, with the co-operation of the national governments, has established a waste strategy (Department of the Environment, Transport & the Regions, 2000) to implement the necessary changes (Office of the Deputy Prime Minister, 2002).
In the year 2003 the UK consumed about 226 million tonnes of aggregates per year (Figure 1.2) to cover its construction needs and it was estimated that the amount of crushed rock aggregates needed in the UK will rise further (by an estimated 20 million tonnes per year) especially with the Olympic Games in London in 2012 and their subsequent construction needs (British Geological Survey, 2005). It was estimated that about 60 of these 226 million tonnes were recycled or secondary aggregates. There are some localised recycling schemes in the UK construction industry based on individual company initiatives but by no means have all the companies across the UK adopted a policy of reusing construction and demolition waste. The environmental problems that arise from the consequential extensive quarrying activities are not just restricted to the quarry areas, as the transportation of the materials causes noise and air pollution problems too.
Consumption of Natural Aggregates
400
350
300
250
I- 200
S 150
100
— Consumption of Natural Aggregates
Figure 1.2: Aggregates consumption in Great Britain (British Geological Survey, 2005)
sim p ler 1 - liiu u u u ciiu ii
A future increase in the re-use of demolition waste will benefit the environment as well as industry. It is considered that the introduction of the landfill tax (which increased to £15 from £1 /tonne/year between 1999 and 2004, HM Treasury, 2004) has led to an annual increase in the cost of disposing of construction and demolition waste to landfill of approximately £15 million per annum. This cost to the industry was compounded by the introduction of the aggregates levy in 2002, the increase in costs of both the haulage of primary aggregates to site and the removal of waste materials to the disposal sites. Given the cost of over-ordering construction materials, it would appear that the reuse of waste materials makes both environmental and economic sense. Construction companies would have to provide a more environmental approach to their projects especially when governments recommend that in construction projects at least 10% of the construction value of the materials used should be dedicated to recycled, re-used and reclaimed materials (Waste & Resources Action Programme, 2005).
Despite the apparent attractions offered by recycling of construction waste, the re-use of these materials has some restraints and disadvantages that have to be taken into consideration in order for their application to construction projects to be effective. The main restraints are the possible unsuitability of the materials for recycling, the distance between the construction site and the recycling plant, the available storage space on site for these materials, noise and dust pollution from crushing equipment, and the cost of cleaning and sorting of the possible contaminants (e.g. wood, plastic, steel reinforcement and electricity and plumbing installations).
vam pici i - luuuuuw uuii
1.2 Need and Scope of Research
Despite the will and initiatives for recycling and reusing these types of materials, their use can not be accurate and widespread before many technical issues have been addressed:
1. Understanding the behavioural characteristics of recycled concrete and bricks 2. Establishing testing procedures and appropriate engineering specifications 3. Use of combinations of materials (e.g. concrete and bricks)
4. Developing possible new ways of re-using the materials
This research project relates to the first issue. Typical uses of recycled concrete and bricks as fill include filter gravel, sub base for roads and car parks, hardcore and general site cover, and backfill to quarries. It has generally been assumed in practice that the behaviour of such fills would be similar to that of natural aggregates, and therefore accumulated data on the properties of such aggregates has been extrapolated and applied to recycled materials used in industry. There are two areas of concern with this approach though:
• Little research has been undertaken into what is perceived as the low level, non-structural re-use of the materials as bulk fills, though some recent work
(Sivakumar et al, 2004, Brampton et al, 2004, Forth et al, 2006, Ghataora et
al, 2006) indicates that there is increasing interest in this aspect.
• The 1st of June 2004 saw the introduction of the New European Standards for aggregates that are applicable to 'aggregates from natural, recycled and manufactured materials'. Even though these standards address the possible specified use of recycled materials, the main problem is that they do not tackle the non homogeneous nature of some of the materials. In some tests (e.g. Freeze Thaw - EN 1367-1, Particle shape - EN-933-3 and Impact Test Value - EN-1097-2) it is possible to test particles that are not representative of the overall composition of the materials (e.g. small particles in crushed concrete mainly consist of the original aggregates used for the manufacturing of concrete and not of composite concrete based particles).
The fundamental driver behind this research was a desire to confirm or refute these assumptions/problems. Thus the overall aim of the project was to investigate the physical and mechanical properties of crushed bricks and concrete. The limited research on the
^ iiapici i - iniiuuu^uuii
subject and the lack of information on the strength and physical properties of recycled materials makes this investigation necessary from the academic point of view, not only for increasing the knowledge on the materials but also for providing a platform for future research.
As it has been mentioned in the previous section of this chapter, the industry is under pressure to recycle more of its waste and use more recycled aggregates for its construction purposes. This investigation aims to provide the industry with the data it needs to safely, and under the guidelines of the existing standards, utilise materials such as crushed concrete and/or bricks in present and future projects.
With these in mind, the specific objectives of this investigation are as follows:
1. To provide a base for future research by investigating the physical and mechanical characteristics of crushed recycled aggregates
2. Provide data on the strength of recycled aggregates so they can be utilised by the industry.
3. Compare the properties of recycled materials with other research on recycled and primary aggregates.
4. Compare the characteristics and performance of different types of recycled materials.
1.3 Thesis Structure
The thesis structure following this introduction is as follows:
• Chapter 2 presents a literature review concentrating on the testing, properties and behaviour of coarse granular materials. The economics and management aspects of the recycling processes fall outside the scope of this research.
• Chapter 3 presents the rationale behind the tests performed in this investigation and describes the aspirations of the testing programme.
• Chapter 4 reports on the test equipment used and the calibration procedures adopted.
• Chapter 5 describes the test procedures followed in this investigation.
• Chapter 6 describes the three material types used in this project, some of their physical characteristics and their transportation to and storage in the laboratory.
^napier i - iiiiruuuciiun
• Chapters 7 and 8 respectively present and analyse the factual results of the main testing series.
• Finally, Chapter 9 presents the conclusions from this investigation and provides recommendations for further work.
CHAPTER 2
LITERATURE REVIEW
2.1 Introduction
Past research into the properties of demolition waste for geotechnical engineering purposes has been limited, compared with other areas of geotechnics. In order to devise a testing programme that would produce a valid description of their properties and behaviour, a comprehensive review of the research literature was undertaken. In summary the review presented in this thesis examines:
• The crushing and processing of demolition waste, in order to identify the types of materials that need to be investigated in this project.
• The methods for classifying particle shape
• The effect of different material parameters on shear strength of granular material • Quantification methods for particle crushing.
• The compaction and compressibility behaviour of coarse granular materials and how they are affected by variations in the material parameters.
• The potential for leachate generation from recycled materials.
2.2 Crushing and Processing of Demolition Waste
In order to be able to identify the types of recycled materials (both concrete and/or bricks) for laboratory testing that are representative of the materials used by industry, it is necessary to investigate:
1. The types of crushing procedures used
2. The amount of processing they might undergo after demolition.
Crushing of demolition waste can take place on site by temporary mobile units, or the materials can be removed from the demolition site, crushed and processed in a fixed site constructed for this purpose.
after crushing. Structures containing reinforced concrete allow simple separation as the steel is easily removed from the concrete since its bond with the concrete is weak after the individual components (columns, beams, and floors) are demolished. Usually a small vibration or sudden movement of the steel rods is enough to “free” the steel from the concrete.
Materials Route
Off Site Storage Processing Site
Haulage required Haulage not required
Used on Site Demolition Waste
Used on Different Site/s
Crushed on Site with Crusher Not Crushed on Site
Figure 2.1: Diagram of Possible routes for Demolition Waste to Re-use/ Recycling
The procedures used for the processing of demolition waste vary depending on the intended use and the processing equipment available. Most methods include transportation of the materials from the production area to the reuse site. Depending on the routes followed this can be costly in economic and environmental terms due to charges and air and noise pollution caused by haulage. Figure 2.1 summarises the possible routes for reusing and/or recycling of materials. The reduction of the number or distance of the routes marked with grey lines will benefit the industry and the environment as they will reduce the transportation needs for the utilisation of these materials.
Reducing the distances the materials have to be transported between the points of demolition and the crusher reduces the cost of the whole procedure of crushing and processing. This has resulted in the development of mobile crushers. The types of mobile crushers vary and the main types used are jaw crushers (Figure 2.2.a), impact crushers (Figure 2.2 b), hammer mills and cone crushers.
Figure 2.2: Photographs of (a) Jaw Crusher (courtesy of www.metsominerals.com) and (b) Impact Crusher (courtesy of www.sanger.net)
Depending on the intended use of the materials the screens used on the processing sites have different size and shape of aperture, and different types of screens such as vibrating, inclined or horizontal are used depending on different parameters existing on site (headroom, operational area required grading etc.). Screening and sorting devices can also be useful for purposes other than only establishing maximum particle sizes. They are most of the time used for removing undesirable impurities such as plastics, roof and wall hardboards and any other types of wood. In some sites when secondary crushers are employed, screening is used to provide materials with particle size that can be crushed by that specific crusher.
It is therefore clear that there are mainly two types of demolition waste reused by the industry:
1. Materials that have not been processed further than the original demolition and crushing
2.3 Particle Shape Classification
Particle shape can be classified by the Elongation and Flakiness ratios (after BS 812- 105) but numerous other methods also exist for characterising the particle shape of materials.
Bowman et cil (2001) have used Fourier description analysis and scanning electron
microscope photographs to analyse the shape of sands, and his technique would have been quite useful in determining the shape of the smaller particles of the materials. Since, though, the BS methods used do not examine particles below 6.3 mm, it was decided that its use was outside the purpose of this research, since only particles larger than 6.3 mm were tested.. The 3D characterization of coarse particles proposed by Lanaro and Tolppanen (2002) falls within the scope of this investigation and produces accurate shape descriptions but it would have been a time consuming process if a large number of particles were to be studied. In addition to the above, the methods used by O’Fannery and O’Mahony (1999) were reviewed but they were not used for the same reason.
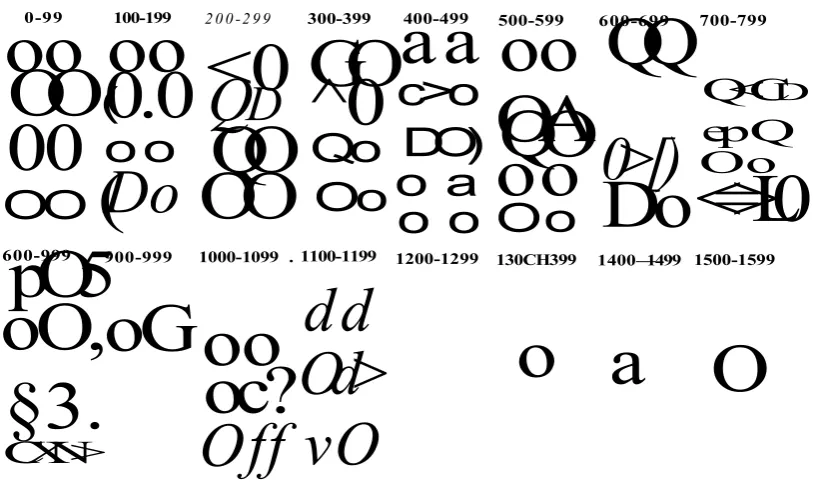
For a more complete description, than the one given by the British Standards, can be given if the methods by Rosslein (1941) and by Lees (1964) are employed. Using a combination of the three dimensional shape categories (Figure 2.3, after Rosslein, 1941) and the chart for visually determining the degree of angularity (Figure 2.4, after Lees, 1964) a complete description of the particles' shape can be presented.
The elongation ratio (q) is the
ratio of the intermediate length of the particle over the greater length
and the flatness ratio (p), the ratio
of the shortest length over the intermediate length.
0.5 1.0
0 Flatness Ratio
Figure 2.3: Three dimensional shape categories determined by the elongation and flatness ratios (after Rosslein, 1941)
0.66
Elongation Ratio
Discs
Equi-
dimensional
The categories given in Figure 2.3 can also be described as: • Discs are the particles that are flaky but not elongated
• Equidimensional the particles that are neither flaky nor elongate • Rods are the particles that are elongate but not flaky
• Elongate and flaky particles are described as blades (Lees, 1964).
0-99
oo
OO
(
00
OO
(
100-199
oo
0.0
o o
Do
2 0 0 -2 9 9
<0
Q
d
QO
OO
300-399GO
^0
Qo
Oo
400-499a a
c>o
DO)
o a
o o
500-599
oo
OA
QO
oo
Oo
600-6990>[)
Do
700-799Q<C
d
ep Q
Oo
<=>L0
600-999 900-999 1000-1099 . 1100-1199 1200-1299 130CH399 1400—1499 1500-1599
pO5
oO,
§3.
C
X
N
>
oGoo
oc?
Off
dd
Od>
vO
o a O
[image:30.619.75.482.153.399.2]Note: The numbers indicate the degree of sharp edges appearing on the particles, with the most rounded being zero and most angular being 1599
Figure 2.4: Chart for determining visually the degree of angularity (after Lees, 1964)
2.4 Effects of Material Characteristics on Shear Strength
Various researchers have conducted experiments to investigate the effects of different properties of materials, like shape size and gradation, on their shear strength. The most important characteristics affecting the shear strength are particle shape, gradation, particle size, confining pressure, density and particle crushing. The literature on each is reviewed separately below, as far as possible.
2.4.1. Particle shape
same gradation but varying the angularity of the particles. Their work indicated that the angular material had a higher shear strength than the sub-rounded and sub-angular materials. A series of shear box tests were conducted by Pike (1973) on 17 different aggregate samples ranging from fine sand to coarse gravel. Increased angularity generally resulted in increased strength. The conclusions of these tests were also verified by Thom and Brown (1989) who found that increasing angularity increased the shear strength of 18 different materials including crushed rock, sand and gravel, all tested in a dry condition.
Eerola and Ylosjoki (1970) found that the shear strength of materials increased in proportion to the ratio of particle length to thickness (i.e. flakiness). Dunn and Bora (1972) conducted triaxial tests on limestone with particles up to 38 mm, and also found that when flaky particles were present, especially in the range of 25-75% of the sample, the shear strength of the materials increased.
Cho et al (2006) found, by examining large amounts of research data, that the critical state friction angle of natural and/or crushed sand reduces as the roundness of particles
increases (Figure 2.5). However, Gur et al (1978) showed that flaky particles increase
the level of deformation of samples at failure.
45
40
30
6 25
20
0.2 0.3 0.4 0.5
0 0.1 0.6 0.7 0.8 0.9 1
Roundness, R
2.4.2. Sample Gradation and Maximum Particle Size
Rico et al (1977) tested materials with different gradations, but with the same maximum
particle size of 35 mm, and found that a more broadly-graded material gave a higher strength than a narrowly-graded specimen. Marsal (1967) changed the gradation of rockfill material, while keeping the maximum particle size the same, and found that shear strength in triaxial shear increased as the gradation became broader. During
testing of Latite Basalt but with two different gradations, Indraratna et al (1998), found
that the existence of smaller sized particles within the sample increased the shear strength of the material compared with the same material without the presence of these smaller particles. Kirkpatrick (1965) conducted triaxial tests on sand, in which the top and bottom sizes were kept the same and at the same time the mean size was varied. In most of the results the shear strength increased with decreasing mean size. Leslie (1963) increased the mean size of the material and broadened its gradation by keeping the minimum size stable but changing the maximum size of the particles. The results of the triaxial tests showed that the shear strength decreased as the mean size increased.
A graphic representation of approximate grading curves (not utilising their actual results) of these conclusions is given in Figure 2.6. The arrows point in the direction of strength increase. The positions of the curves are independent from maximum particle size values. The x-axis does indicate values of maximum particle sizes.
Marsal, 1967
Rico et al, 1977
Indraratna et al,
1998 /
Kirkpatrick, 1965
Leslie, 1963
4—»c <L>
o
<D
Oh
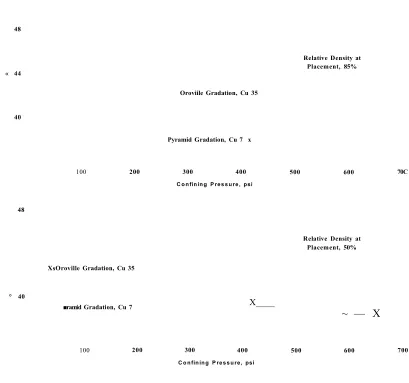
Becker et al (1972) also found that higher Coefficients of Uniformity produced higher friction angles for a range of normal stresses for similar materials when they were tested in a triaxial cell (Figure 2.7). Klugar (1978) also found that reduced deformation and degradation is related to a broader gradation.
48
Relative Density at Placement, 85% « 44
Oroviile Gradation, Cu 35
40
Pyramid Gradation, Cu 7 x
200 300 400
C onfining P ressure, psi
100 500 600 70C
48
Relative Density at Placement, 50%
XsOroville Gradation, Cu 35
° 40
X____
■ramid Gradation, Cu 7
~ — X
300
C o nfining P ressure, psi
[image:33.612.68.477.115.498.2]100 200 400 500 600 700
Figure 2.7: Influence of material gradation of friction angles (after Becker et al, 1972)
Dunn and Bora (1972) showed that shear strength increases with increased particle size. Tombs (1969) and Charles (1973) found that the shearing resistance angle was not significantly affected by the particle size as it was about 2° bigger for materials of Dmax 75 mm than for samples of Dmax of 10mm.
Varadarajan et al (2003) tested two different materials by using three different
50
S 46 l. cn o Q of u> c < 42
co
38
34
Alluvial Rockfill-Gravel, Cu 133
□
□
□
TT
O
A Dmax 3.2 in
□ Dmax 2 in
O Dmax 1 in
10
lo g (03 /pa)
100
Figure 2.8: Influence of maximum particle size on friction angle of alluvial rockfill (after Varadarajan et al, 2003)
A
□ Quarried Rockfill-Gravel,
Cu 18
O O
n
0 O Dmax 1inA □
A
□ Dmax 2 in
A Dmax 3.2 in 50 46 ra o O 42 38 34 10 lo g (0 3 /p a)
100
Figure 2.9: Influence of maximum particle size on friction angle of quarried rockfill (after Varadarajan et al, 2003)
[image:34.617.69.461.25.267.2] [image:34.617.71.462.354.585.2]tests performed by Marachi et al (1969), where he found that samples with maximum particles (Dmax) of 150 mm had an angle of shear resistance of about 4° smaller than samples with a maximum particle size of 12 mm. Marsal (1973) performed tests on basalt at which he varied the maximum particle size but kept the specimen diameter the same. Table 2.1 shows the effect of this change on friction angle. The influence of maximum particle size on the friction angle appears to be minimal at high confining pressures
Table 2.1: Effect of maximum particle size on friction angles (after Marsal, 1973)
on, MPa dmaxl/D dmax2/ D ( 9 1 -9 2 ) / 9 2 , %
0.8 0.07 0.18 3
1.6 0.07 0.18 4
3.9 0.07 0.18 0.3
dmaxi, dmax2 is the maximum particle sizes, D the diameter of the
specimen ( 1 1 3 0 mm) and cpi, cp2 the friction angles for dmaxi, dmax2
Roner (1985) concluded that there are no direct relationships between shear strength and particle size that can be generalised in all types of soils. Other researchers (Holtz &
Gibbs, 1956; Vallerga et al, 1957) also showed that little relation exists between the
particle size and the shear strength of a specific material.
It is therefore quite difficult to rate the influence of maximum particle size and gradation on the shear strength of the materials, since these two parameters are inter related and are affected by any changes, unless tests are performed when one is kept stable when the other is changed (simpler to perform by keeping the maximum particle size the same)
2.4.3 Confining Pressure
cn
^ 20-3
10.3
10 100 1,030
Normal stress on slip surface (psi)
Figure 2.10: Effect of normal stress on friction angles (after Leps, 1970)
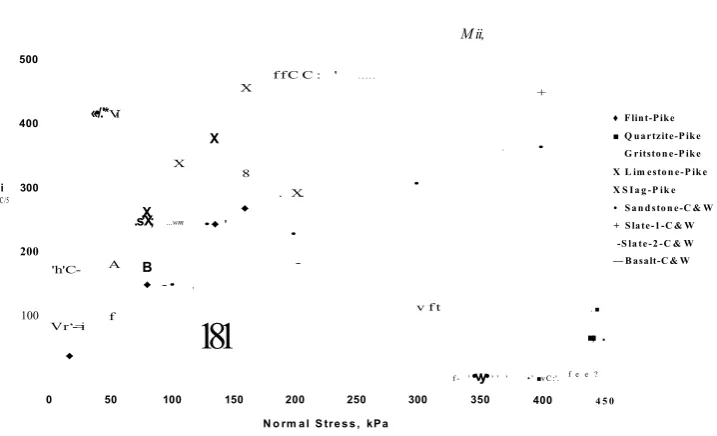
Pike (1973) conducted shear box tests on a number of materials with maximum particle size of 40 mm and found that shear stress at failure increases with normal stress (Figure 2.11). It has also been found that the principal effective stress ratio at failure was much greater for tests with low confining pressure than the tests carried out with higher values of confining pressure (Marsal, 1973). Others (Bishop, 1966, Marsal, 1967, Vesic and
Clough, 1968, Charles and Watts, 1980 and Indraratna et al, 1993), have shown that the
shear strength values increase with confining pressures but the friction angles reduce.
600
500
400
i 300
C/5
200
100
M ii,
X f f C C : ' . . . +
«•/.'* Vi
X . •
X 8
• . X.
X
.s'X; ...wm • ♦ ' ♦
•
'h'C- A B
-f
♦ - • ,
v f t . ■
Vr‘-=i
♦
181
■; .
f - ’ •vy • ' ’ ' •’ ■ vC :'. f e e ?
♦ Flint-Pike ■ Q uartzite-P ike
G ritston e-P ike X L im eston e-P ik e XS Ia g -P ik e • S an d ston e-C & W + S late-1-C & W
-S la te-2 -C & W — Basalt-C & W
0 50 100 150 200 250 300 350
N o rm al S tress, kPa
[image:36.617.87.446.468.686.2]2.4.4 Density
Zeller and Wulliman (1957) observed that the friction angles increase with relative
density for granular materials of Dmax of 10, 3 0 and 1 0 0 mm (Figure 2 . 1 2 ) .
55
50
45
Dmax 10mm Dmax 30 mm Dmax 100mm
CD
40
35
30
0 10 20 30 40 50 60 70 80 90 100
Relative Density - Percent
Figure 2.12: The effect of relative density on friction angles (after Zeller and Wulliman, 1957)
Marsal (1973) reported that the variations in friction angles between different densities was in the range of 3° to 4° for material tested at normal stress of 65 kPa. In their paper,
Indraratna et al (1993) note that the degree of compaction and hence the initial porosity
of rockfill has a major effect on shear strength.
2.4.5 Particle Crushing
The crushing of particles can influence the behaviour of granular materials in terms of strength, volume change characteristics, permeability, stress-strain behaviour and pore-
pressure distributions (Lee and Farhoomand, 1967 and Lade et al, 1996). Permeability
is of particular importance if the material is going to be used as engineering fill where it
can affect the pore-pressure distributions and seepage quantities (Lade et al, 1996).
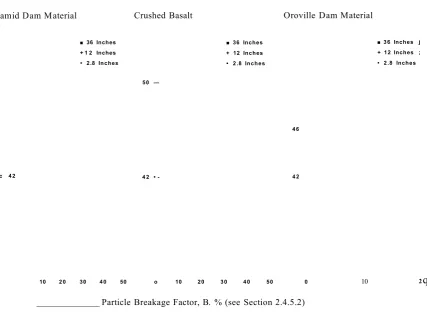
Marachi et al (1969) conducted tests on three different granular materials and found that
angles (Figure 2.13) for materials with three different maximum particle sizes (2.8, 12 and 36 inches).
Pyramid Dam Material Crushed Basalt Oroville Dam Material
50 —
46
c 42 4 2 • - 42
■ 36 Inches + 1 2 Inches • 2.8 Inches
■ 36 Inches + 12 Inches • 2.8 Inches
■ 36 Inches j + 12 Inches ; • 2.8 Inches
10 20 30 40 50 o 10 20 30 40 50 0
______________ Particle Breakage Factor, B. % (see Section 2.4.5.2)
[image:38.615.71.499.73.386.2]10 2q
Figure 2.13: Angle of internal friction against breakage factor (after Marachi et al, 1969)
2.4.5.1 Factors affecting Particle Crushing
The factors affecting particle breakage have been investigated extensively and the findings may be summarised as follows:
1. The amount of breakage is affected by many factors, such as the stress level and
the stress path applied to them (Lee and Farhoomand, 1967, Lade et al, 1996).
2. Yamamuro and Lade (1993) established that the crushing of particles depends on the types of materials tested and continues with time, even when the material is under constant stress.
4. Increased angularity increases particle breakage, as the stresses can concentrate
along their smaller dimension and fracture it more easily (Lade et al, 1996).The
concentration of stresses at angular points of contact causes fractures at those points (Yamamuro and Lade, 1993). The same researchers also found that well- graded soils do not break as easily as uniform soils, probably because when more particles surround each particle, the average contact stress tends to decrease.
5. It has been noticed that the addition of water in materials increases the particle
breakage (Hardin, 1985; Lade et al, 1996), probably due to the softening of
particles
6. Extensive coverage of particle crushing has been conducted by Nakata et al
(1999). They performed individual particle strength testing, and triaxial tests in which marked (painted) particles of the same composition, size and shape as the individual tests were placed within the triaxial test sample. This was done to identify the behaviour of the particles individually and as part of granular specimens. The results were inconclusive as to if the crushing behaviour of the particles changed when they were part of a triaxial specimen.
2.4.5.2 Particle crushing quantification
Almost all the investigations concerning testing of granular materials have noted
particle breakage (e.g. Barden et al, 1969; Murphy, 1971; Hagerty, 1993), even at
relatively low pressures. Many attempts have been made to quantify and measure this problem with the use of breakage factors, most of them based on the changes of grain size distribution of the materials before and after testing.
The most widely used breakage factors are the ones developed by Marsal (1967) and Lee and Farhoomand (1967):
• Marsal noticed significant amounts of breakage of particles while performing
large-scale triaxial tests on rockfill materials. His breakage factor, Bh uses the
sum of the percentage differences, for each sieve, between the initial and final gradation curves.
• The breakage factor of Lee and Farhoomand (1967) is based on the change before and after testing, of a single particle diameter namely the 15% finer on
the grain distribution curve. Their factor (D 15(lnitiaI) / D 15(Finai)) was ^ e ratio
relations of this breakage factors to the grading curves of the materials are given in Figure 2.14.
toe
Initial
Gradation Hardin s
Breakage i Potential L Bp
Gradation
[ Lee &
I Farhoomand 1 D(15i)/D(15f)
Hardin's total Breakage Bt Marsal's B
2
%
as
bJt
a,
tam
GRAIN SIZE * MILOMETERS o o c 0.01
Figure 2.14: Breakage Factors (Lade, Yamamuro & Bopp, 1996)
Particle breakage quantification is based on the grading curves before and after shearing. Despite this though, it is almost impossible to obtain a direct relationship between particle breakage (and the properties affecting it), and shear strength since the amount of breakage depends on other factors. For example different materials with identical gradations, undergoing the same shear testing, will exhibit different amounts of crushing if other properties like particle shape and individual particle strength are different.
2.4.6 Relation between permeability and particle crushing
Duncan et al (1972) and Lade et al (1996) have also investigated the relationships
between particle gradation and size with permeability. Hazen (1911) developed a formula relating the grain size with permeability:
k = 100 x (D10)2
Taking this formula into consideration, Lade et al (1996), developed an alternative breakage factor B10 based on D 10 particle size and on the effective grain size before the test (D10l) and after the test (D10f):
B io =1 ~ O W B ioi)
The minimum value of the factor is zero, where no breakage occurs and the upper value is one, where infinite breakage occurs.
2.4.7 Summary
Table 2.2 presents a summary of the parameters and their possible effect on shear strength/friction angle according to literature.
Table 2.2: Summary of parameters affecting shear strength
Parameter Comment
Particle Shape Shear strength increases with particle angularity
Sample Gradation and Maximum Particle Size
Broader gradation increases strength but parameters and their effect too interlinked to be able to safely conclude which has the biggest effect
Confining Pressure Shear strength increases with confining pressure but the
friction angle appears to reduce
Density Shear strength and friction angle increase with density.
Particle Crushing Friction angle tends to reduce with increasing particle
crushing
2.5 Compaction
For natural coarse granular materials, the density is generally is understood to be related to the moisture content and the compactive effort. At low moisture contents the soil has low workability and is therefore difficult to compress. By adding water the material is provided with the lubricant that it needs to move more freely (Watson, 1989). The introduction of excessive water leads to higher saturation levels which keep the particles apart during compaction, which reduces the density of the material. The control of moisture during compaction therefore becomes one of the most important factors to
consider in earthworks control (Wignall et al, 1999). Optimum moisture content is
The value of optimum moisture content is different for different types of granular material. For sands and gravel mixtures it is typically 5-7% and for sands 8-10% (Watson, 1989).
Testing of granular materials in the laboratory can not exactly mirror field conditions and it is very difficult to test undisturbed samples of granular materials obtained from sites. Therefore, for laboratory studies, materials need to be compacted at densities
representative of the field (Hoff et al, 2004). Many studies (e.g. Nowak et al, 1998,
Knight et al, 1995, Richard, 2005 and Lumay and Vandewalle, 2005) have stated the
fact that the dynamics of granular material compaction is a complex process and there have been many theoretical models for estimating/predicting their compaction
behaviour (Boutreux and de Gennes, 1997, Levin et al, 2001 and Arenzon et al, 2003).
Analysis of these methods though is outside the scope of this project.
Many methods for laboratory compaction exist, such as Proctor impact hammer, modified proctor hammer, vibratory table and vibratory hammer. There are differences in the behaviour of the materials compacted with these methods, even when the same dry density is achieved. Hoff (1998) found that samples of the same materials compacted with gyratory compactor exhibited higher CBR values than when compacted
by modified proctor hammer. Hoff et al (2004) also showed that Gneiss from Askjay,
Norway, when compacted to the same density by the vibratory table, produced higher failure angles than the same material compacted by impact methods (hammer).
Carga and Madureira (1985) found that the difference between the maximum dry densities for standard and intermediate energies is independent of the percentage of gravel fraction, and that the compacted density was essentially independent of the gradation of the gravel fraction. They also found for a number of samples tested that the particle size does not dramatically affect the maximum dry density, for 40-60% gravel content and for the equipment used in the research. No information was given about materials with gravel content outside the range of 40-60%.
2.6 Compressibility 2.6.1 Introduction
compression of the soil skeleton and particle rearrangement. Even though at low stresses there is some crushing on sands, it becomes the dominating factor of the compressibility of sands at higher stresses (Lee and Farhoomand, 1967, Hardin, 1985
and Hagerty et al, 1993). Similar behaviour has been observed for larger granular
materials, and their compressibility has been attributed to the rearrangement of particles
during loading and the breakage of highly stressed points (Marsal, 1967, Lade et al,
1996, Yamamuro and Lade 1993). The compressibility of granular materials, as a whole and not on the individual particle level, depends on many factors such as gradation, particle size and shape (Rowe, 1955, Roberts and De Souza, 1958, Schultze and Moussa,
1961), and the literature on the influence of each factor is reviewed separately below.
2.6.2 Effect of Particle Shape
Hagerty et al (1993) found that material that contained angular particles showed a
greater degree of compressibility than material with the same median grain size and composition that contained spherical particles. These results are in agreement with the findings of Pestana and Whittle (1995) and Pigeon (1996). They attributed the behaviour to the fact that angular particles crush more easily than rounded, and therefore it is easier to fill the air voids with crushed material and to have re
arrangement of the particles within the material. Cho et al, (2006) also found that the
compression and decompression indices reduce with increased regularity calculated as (Sphericity + Roundness)/2, and it is shown in Figure 2.15.
Figure 2.15: Compression and decompression indices against particle shape (after Cho et al, 2006)
(c) O Conpressbn index
• Deconpression index
e
C c = 0.0032 p '‘ 5 (r2 - 0.52) o ' ' . ° 0
C s“ 0.0028 p‘° 4 (r2 = 0.82) T3a
m a
o
o
° 0.001
0 0.2 0.4 0.6
Note: The compression index is calculated by drawing a curve along the compression line against different loading (1 kPa and 10 kPa or 2 kPa and 20 kPa) and at different void ratios. The index is calculated by subtracting the two void ratios. The opposite gives the decompression index.
2.6.3 Effect of Individual Particle Strength
Tests performed by Pestana and Whittle (1995) on two types of sands found that Ottawa sand was more difficult to compress than Quiou sand. This was a result of the fact that the main constituent of Ottawa sand is quartz and the main constituent of Quiou sand is calcitic shell fragments. Quartz is stronger and therefore more difficult to crush than
calcitic shell fragments. Similarly Yamamuro et al (1996) found that that material with
relatively weaker, in terms of strength, particles showed a “faster” compression response to stresses, which was attributed by the researchers to the fact that soft grains allowed the material to flow plastically and fill the voids easier and faster.
2.6.4 Effect of Material Void Ratio (dry density)
Roberts and de Souza (1958) observed that void ratio is one of the main factors that affects the compressibility of sand and ground quartz. Tests performed by Hite (1989) on loose and dense samples of sand showed that the compressibility of the materials decreased with increased density. However when the stresses reach a level when particle breakage occurs, then the degree of influence of the initial void ratio decreases
and becomes minimal (Hendron, 1963, Vesic and Clough, 1968 and Hagerty et al,
1993). This was also noticed by Yamamuro et al (1996), who observed that the effect of
the initial void ratio was eliminated at high pressures. Pestana and Whittle (1995) also reached the same conclusion, but noted that cementation might play a role in the behaviour but did not proceed to a more detailed investigation of the subject.
2.6.5 Effect of Material Grading
apparent contradiction of the effect of grading on the compressibility of the materials possibly indicates that other factors, especially listed in this paragraph, play a more important part than grading in the behaviour of the materials.
2.6.6 Effect of time
Special attention has also been given to the compression with time relation. De Souza (1958), Roberts and De Souza (1958) and Pestana and Whittle (1995), all found in their research, that included triaxial and one dimensional compression testing, that the compression of granular materials starts almost from the time, the load is applied to them and continues with time but at a decreasing rate, as long as the load is applied continuously. This is similar to the phenomenon of secondary compression or creep effects, observed with clay soils (Lee and Farhoomand, 1967). This continuous compression is attributed to the continuous deformation, re-arrangement and breakage of the particles under load (Roberts and De Souza, 1958 and Pestana and Whittle, 1995). The exact response of the materials depends on their particles’ properties, the magnitude of the load and the stress path(s). This was observed by Houlsby and Psomas (2001) when they tested sand in a one dimensional compression tests at load increments of 28.3 kPa (Figure 2.16)
time [si
1850 1500 1950 2000 2050 2100 2150
-5.75
undrained stage drained stage
c -6.25
-6.75
■7 CO
Figure 2.16: Displacement against time for sand (After Houlsby and Psomas, 2001)
2.6.7 Effect of Water
Holestol et al (1965) determined by field and laboratory tests that the compressibility of
water. The same phenomenon was observed by Sowers et al (1965) on their tests on broken rock. Miura and Yamanouchi (1975) showed that the introduction of water can affect the compressibility of cohesionless soils by increasing particle breakage (through weakening the individual particles), a phenomenon that is more intense in materials with larger particles (Leslie, 1975). Clements (1981) observed that flooding particle
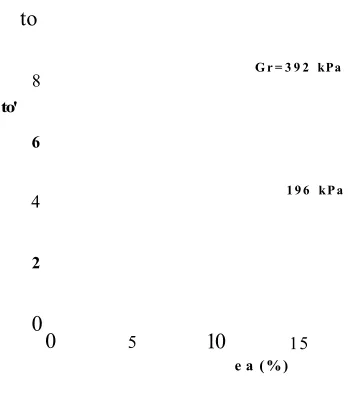
contacts caused additional displacements to the materials tested. Sun et al (2004) also
found that for identical materials, the saturated specimens exhibit more volumetric strain(dilation) in comparison to the unsaturated specimens for three different normal stresses (Figure 2.17).
to
G r = 3 9 2 kPa
8
to' 6
1 9 6 kPa
4
2
0
0 5 10 1 5
[image:46.619.173.347.227.424.2]e a ( %)
Figure 2.17: Volume change behaviour of saturated and unsaturated materials (after Sun et al, 2004)
2.7 Leachate
effect on the amount of produced leachate. Hill (2001) did indeed find that the larger the particles the less likely they are to leach.
Dawson (2001) found that the existen