University of Warwick institutional repository: http://go.warwick.ac.uk/wrap
This paper is made available online in accordance with
publisher policies. Please scroll down to view the document
itself. Please refer to the repository record for this item and our
policy information available from the repository home page for
further information.
To see the final version of this paper please visit the publisher’s website
.
Access to the published version may require a subscription.
Author(s): MA Juarez
Article Title: Normal Correlation: An Objective Bayesian Approach
Year of publication: 2005
Link to published article:
Normal Correlation:
An Objective Bayesian Approach
Miguel A. Juárez University of Warwick «[email protected]»
Abstract
In this paper we give a decision-theoretic oriented, objective Bayesian answer to the problems of point estimating and sharp hypothesis testing about the correlation coefficient of a bivariate Normal population. Under this view both problems are deemed closely related and thus a co-herent answer is developed. Comparisons with frequentist results are given and an alternative interpretation of the maximum likelihood estimator is found.
Keywords: Bayesian reference criterion, intrinsic divergence, intrinsic estimator, log-arithmic discrepancy, reference prior.
1 Introduction
Since the introduction in the late 19th century of the concept of correlation into the statistical ana-lysis, a great deal of work has been done in order to estimate the correlation between measure-ments and to decide whether the estimated correlation is (statistically) significant. Assuming that the observed vectorx= (x1,x2), given five parameters, follows a bivariate Normal distribution, we address the problems of estimating the correlation,ρ, between both measurements, and to decide whether the (null) hypothesisH0≡ {ρ=ρ0}is compatible with the data.
The paper is organised as follows, Section 2 gives a brief account of some classical and ob-jective Bayesian results on estimation and sharp hypothesis testing. The reference-intrinsic meth-odology, introduced by Bernardo and Rueda (2002) and Bernardo and Juárez (2003), to derive a decision rule for sharp hypothesis testing, and to provide a point estimate is presented in Sec-tion 3. ImplementaSec-tion of the method and comparisons with alternative approaches is carried out in Section 4, using both simulated and real data. Some final comments are given in Section 5.
2 Preliminaries
2.1 The frequentist view
The now ubiquitous law
f(x| µ,Σ)= |Σ|−
1 2
2π exp
"
−1
2(x−µ)
0Σ−1(x−µ)
#
with
E[x]=µ={µ1, µ2}, and Var[x]= Σ−1= 1 1−ρ2
λ1 −ρλ
1/2 1 λ1/22 −ρλ1/21 λ1/22 λ2
,
whereλi > 0,i = 1,2, andρ ∈(−1,1), was first derived empirically in 1885 by Sir Francis Galton (Pearson and Kendall, 1970, p. 197), bringing the concept of correlation into the realm of stat-istical inference. Some thirty years later, Fisher (1915) showed that, given a random sample,
z={(x1i,x2i)}n
i=1, the sampling correlation coefficient
r(z)= s12 s1s2
where
s12 = 1n
n X
i=1
(x1i−x¯1) (x2i−x¯2), s2j = 1n
n X
i=1
xji−x¯j 2
and x¯j= 1n n X
i=1
xji j=1,2;
is sufficient forρ(Jeffreys, 1961, p. 175), and that its sampling distribution is given by
p(r | µ1, µ2, λ1, λ2, ρ)= p(r | ρ)
∝
1−ρ2
n−1
2
1−r2
n−4 2
(1−ρr)n−32
F 1 2,
1 2,n−
1 2,
1+ρr 2
!
, (2)
where F(a,b,c,z)is the hypergeometric function.
Moreover,r=r(z)is the maximum likelihood estimator (mle) –and thus consistent. Therefore, reportras a point estimate and calculate numerically its standard error from (2).
If we are interested in testing independence between both measurements, i.e. test H0 ≡ {ρ=0}, it can be shown (see e.g. Lehmann, 1986) that the statistic
R=R(r)= p r
1−r2/(n−2) (3)
has, underH0, a standardt(n−2)sampling distribution withn−2degrees of freedom, leading to the decision rule:
RejectH0, with test sizeα, whenever |R| > K, where K is the α/2 percentile of the standardt(n−2)distribution.
2.2 The objective Bayesian view
In his seminal work, Jeffreys (1961) proposed
as an objective prior for this problem, leading to the posterior
πJ1(ρ | z)∝
1−ρ2n−21
(1−ρr)n−32
F 1 2,
1 2,n−
1 2,
1+ρr 2
!
, (5)
which, omitting the constants, is identical to (2), corroborating Fisher’s results on the sufficiency of r. Seeking an invariant prior, he also proposed what now we might call the Jeffreys’ prior,
πJ2(ρ, µ1, µ2, λ1, λ2)∝λ−11λ−21
1−ρ2−
3 2 ,
(6)
so that the posterior is of the same shape as (5) and may be written as
πJ2(ρ | z)∝
1−ρ2n2−2
(1−ρr)n−3 2
F 1 2,
1 2,n−
1 2,
1+ρr 2
!
. (7)
Later, Lindley (1972), while studying the behaviour of posteriors derived from priors of the form,
πL(ρ, λ1, λ2, µ1, µ2)∝λ−11λ−21
1−ρ2c,
concluded that for the prior to be non-informative we must have−2 < c ≤ −1and recommended c=−1, ruling out (6).
Finally, Bayarri (1981), following the ideas in Bernardo (1979), derived the reference prior for the bivariate Normal model when the coefficient of correlation is the parameter of interest as
π(ρ, λ1, λ2, µ1, µ2)∝λ−11λ−21
1−ρ2−1, (8)
confirming Lindley’s intuition and setting the standard objective prior which leads to the reference posterior, forn≥3
π(ρ | z)∝
1−ρ2n−23
(1−ρr)n−3 2
F 1 2,
1 2, n−
1 2,
1+ρr 2
!
. (9)
The posterior contains all the information we have about ρ, though if we are asked about a point estimate we must propose a loss function and then minimise the posterior expected loss. The most commonly usedautomatic losses are the quadratic, the absolute and the zero-one loss functions, yielding the posterior mean, median and mode, respectively (if they exist). These can be numerically calculated from (9).
any prior and are, therefore, open to criticism.
3 Reference-Intrinsic Analysis
In this section the problems of point estimation and hypothesis testing are addressed within a de-cision framework and from an objective Bayesian approach which overcome these shortcomings.
3.1 The methodology
Suppose we have determined that the probabilistic behaviour of an observable x is adequately described by the parametric model
M = {p(x | θ,ω), x∈X, θ∈Θ,ω∈Ω}
and that we are interested in making inferences aboutθ, withωa nuisance parameter. Recently, Bernardo and Rueda (2002) and Bernardo and Juárez (2003) argue that the problems of point estimation and precise hypothesis testing might be posed as those of deciding which valueθ∗ = θ∗(x)renders the best proxy, p(x | θ∗,ω), to the assumed model given the data, and whether a given proxy model,p(x | θ0,ω), is consistent with the data, respectively. To this end they propose as a loss function theintrinsic discrepancy, defined as
δx(θ,ω;θ0)=min{k(θ0 | θ,ω),k(θ,ω | θ0)}, (10)
where
k(θ0 | θ,ω)= min ω0∈Ω
ˆ
X
p(x | θ,ω) log p(x| θ,ω) p(x | θ0,ω0)
dx
and
k(θ,ω | θ0)= min ω0∈Ω
ˆ
X
p(x | θ0,ω0) logp(p(xx||θθ0,,ωω)0) dx,
are the corresponding Kullback-Leibler (KL) divergences.
Deriving the minimum of the KL divergencies in models where the dimension of the parametric space is relatively large may prove tedious and involved. However, in some cases it is possible to interchange the optimisation and minimisation steps. We will use the following lemma, before stating the main result. All proofs are deferred to the appendix.
Lemma 1.
Letp1and p2be two probability density functions with convex support. Then, the KL divergencies, k(pi | pj),i,j=1,2are convex.
Theorem 1 (Intrinsic discrepancy in regular models).
Let{p(x | θ,λ), x∈ X, θ∈Θ,λ∈Λ}be a probabilistic model that meets the regularity conditions stated in the appendix. Then,
δ∗(θ,θ0,λ)= inf λ0∈Λ
δ(θ,θ0,λ,λ0)
=min
(
inf λ0∈Λ
k(θ, λ | θ0,λ0), inf λ0∈Λ
k(θ0,λ0 | θ,λ)
)
.
In particular, the exponential family meets the conditions of Theorem 1, therefore
Corlary 1 (Intrinsic discrepancy in the exponential family).
Let{p(x| θ,λ), x∈ X, θ∈Θ,λ∈Λ}belong to the exponential family; i.e.p(x | ψ)=a(ψ) exp[ψtt(x)]. Then,
δ∗(θ,λ;θ0)= inf λ0∈Λ
δ(θ,λ;θ0,λ0)
=min
(
inf λ0∈Λ
k(θ, λ | θ0,λ0), inf λ0∈Λ
k(θ0,λ0 | θ,λ)
)
,
with
k(ψj | ψi)= ˆ
p x | ψi log p x | ψi
px | ψj dx
=M(ψi)−M(ψj)+ψtj−ψti∇M(ψi),
whereψk ={θk,λk},k=0,1, M(ψ)=loga(ψ)y∇M(ψ)=∂M(ψ)/∂ψ.
In our problem, the directed KL divergencies,
k(ρ0 | ρ, µ1, µ2, λ1, λ2)= n 2
log
(1−ρ0ρ)2
1−ρ2 0
2 +log1−ρ
2 0 1−ρ2
,
and
k(ρ, µ1, µ2, λ1, λ2 | ρ0)= n 2
log(1−ρ0ρ) 2
1−ρ22 +log 1−ρ2 1−ρ2 0
are symmetric, and hence the intrinsic discrepancy is
δ(ρ;ρ0)= n2 log (1−ρ0ρ) 2
1−ρ2 1−ρ2 0
. (11)
It is readily verified thatδ(ρ;ρ0)≥0with equality iffρ=ρ0, and that it is a convex function ofρ0. In a decision problem, the parameter of interest is that which enters the loss function. Making use of this argument, Bernardo and Rueda (2002) proceed to derive the reference prior (Berger and Bernardo, 1992; Bernardo, 1979), πδ(θ;ω), when the intrinsic discrepancy is the parameter of interest. In our case, in order to calculate the reference prior whenδ(ρ;ρ0) is the parameter of interest, note that this is a one-to-one piecewise function of ρ. Thus, given that the reference posterior is invariant under this kind of transformations (Bernardo and Smith, 1994, p. 326), we can use (8) to derive the reference posterior forρand then calculate the expected value of (11) under it. Obviously, (9) is the corresponding posterior.
3.2 The Bayesian Reference Criterion
The expected value of the intrinsic divergence under the reference posterior, hereafterthe intrinsic statistic, is
d(ρ0 | r)= ˆ 1
−1 n 2 log
1−(1ρ−2 ρ01ρ−)2ρ2 0
π(ρ| r) dρ . (12)
The intrinsic statistic is a measure, in natural information units (nits), of the weight of the evid-ence conveyed by the data against the simplification attained when acting as if ρ = ρ0. Given that (11) is convex inρ0,d(ρ0 | r) is also convex. Thus, it induces the decision rule, hereafter the Bayesian reference criterion (brc):
Reject ρ=ρ0 iff d(ρ0 | r)>d∗.
In order to calibrate the threshold value,d∗, Bernardo and Rueda (2002) argue that the intrinsic statistic can be interpreted as the expected value of the log likelihood ratio against the simplified model, given the data. Hence, values ofd∗around 2.5 would imply a ratio ofe2.5≈12, providing mild evidence against the null; while values around 5 (e5 ≈ 150) can be regarded as strong evidence againstH0; values ofd∗≥7.5(e7.5≈1800) can be safely used to reject the null.
For this problem, (12) can be numerically integrated. Juárez (2004) shows that when the refer-ence posterior is asymptotically Normal, as in this case, a good approximation even for moderate sample sizes is given by,
withθˆ, a consistent estimator ofθ, for instance themle. In this case we obtain
d(ρ0 | r)≈ n2 log
1−(1r−2 ρ01r)−2ρ2 0
+ 1
2. (13)
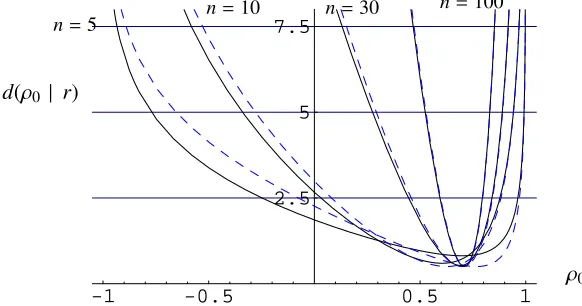
Both (12) and (13), are depicted in Figure 1, calculated from simulated data withρ = 3/4and for different sample sizes. We can see that for smalln, it is not possible to reject almost any value of the parameter and that the criterion becomes more discriminating as the sample size increases.
-1 -0.5 0.5 1
2.5 5 7.5
n=5 n=10 n=30
n=100
[image:8.595.142.433.202.355.2]ρ0 d(ρ0 | r)
Figure 1.The intrinsic statistic for the correlation coefficient and its approximation (dashed) for simulated values, fixingρ = 3/4. According to the brc, values ofd(ρ0,r) above 2.5
should be considered as mild evidence againstρ = ρ0, values over 5 can be think of as
providing strong evidence against the null and values over 7.5 may be safely rejected.
An important advantage of thebrc over the classical test is that with the former we are able to test any valueρ0∈(−1,1), in contrast with (3) which is derived only forρ0 =0. In case we want to use a classical test for a null value different from 0, we must derive its sampling distribution or use the normal approximation, √n(r−ρ) →d N0, 1−ρ2−2, which is known to fail for small to moderate sample sizes and extreme correlation values.
3.3 The Intrinsic Estimator
A natural consequence of our decision-theoretical approach is that the obvious choice for a point estimate is the one that minimizes the intrinsic statistic. Hence, we shall say thatθ∗isthe intrinsic
estimator of θif
θ∗(x)=arg min θ0∈Θ
d(θ0 | x).
An important feature of the intrinsic estimator is that it inherits the invariance properties of the intrinsic statistic, a characteristic not shared by the most commonly used objective Bayes estimat-ors.
is (Juárez, 2004)
ρ∗≈r
r
n n+1.
One way to compare the performance of the intrinsic estimator and themle under homogen-eous repeated sampling is to calculate their respective (intrinsic) risk functions,
Rρ˜(ρ)= ˆ 1
−1
δ(ρ; ˜ρ) p(r | ρ) dρ,
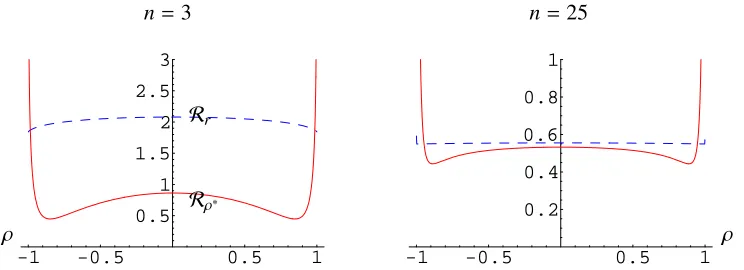
with p(r | ρ) as in (2). Both functions are depicted in Figure 2 for the minimum sample size and for a moderate one. We can see that none of them is dominated by the other, althoughRρ∗ < Rr
for almost all of the parametric space, and how both functions are close to each other, but at the boundaries of the sample space, as sample size grows. Indeed, Juárez (2004) shows that when the (marginal) reference posterior is asymptotically Normal, the intrinsic estimator is admissible and, if ˜
θis a consistent estimator ofθ, thenθ∗andθ˜ are asymptotically equivalent in risk, under intrinsic loss.
-1 -0.5 0.5 1
0.5 1 1.5 2 2.5 3
-1 -0.5 0.5 1
0.2 0.4 0.6 0.8 1
ρ ρ
n=3 n=25
Rρ∗
[image:9.595.118.490.319.454.2]Rr
Figure 2. Intrinsic risk function of the intrinsic estimator,Rρ∗ (solid line), and themle,Rr
(dashed line), for the minimum sample size and a moderate one.
In a number of applications, the instrument used to measure both quantities is usually the same, and so assumingλ1=λ2=λ, i.e. both measurements share the same precision, may be sensible. In this case, the logarithmic divergence (10) remains unchanged and it follows that the reference prior for this model whenρis the parameter of interest is
π(ρ, µ1, µ2, λ)∝λ−1
1−ρ2−1 . (14)
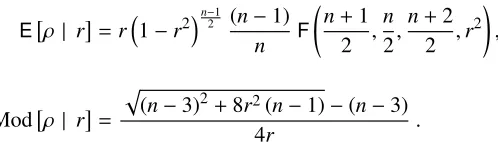
Combining the likelihood with (14) and integrating out the nuisance parameters{µ1, µ2, λ}, leads to the reference posterior
π(ρ | r)= Γ
n
2 1−r2
n−1 2
√
πΓn−21
1−ρ2n−23
with mean
Eρ | r=r1−r2
n−1
2 (n−1)
n F n+1
2 , n 2,
n+2 2 ,r
2
!
,
and mode
Modρ | r=
p
(n−3)2+8r2(n−1)−(n−3)
4r .
It is interesting that for this case the posterior median, the maximum likelihood estimator and the intrinsic estimator coincide,
ρ∗(r)=ρˆ(r)=Med[ρ | r]=r;
this can be checked numerically. Thus suggesting an appealing interpretation of the maximum likelihood estimator as an approximation to the intrinsic estimator when both precisions are close.
4 Examples
4.1 Simulated data
[image:10.595.189.438.87.158.2]In order to compare the performance under homogeneous repeated sampling of both the intrinsic estimator and thebrc with their frequentist counterparts, 5000 simulations were carried for the minimum sample size and for a moderate one. Table 1 summarises this comparison. The third and fourth columns (brc and R) report the relative number of times when the hypothesisρ = 0 was rejected under each criterion, using the comparable threshold values ofd∗ = 3for thebrc, andα=0.05for thet-test. The last column presents the relative number of times that the intrinsic estimator was closer than themle to the real value.
Table 1.Comparison of the behaviour under repeated sampling of thebrc and the intrinsic estimator vs. their frequentist counterparts
n ρ brc R % diff.
-109 0.257 0.169 0.655 0 0.200 0.050 1.000 3
3
4 0.366 0.099 0.720 -109 1.000 1.000 0.512 0 0.026 0.046 1.000 25
3
4 0.996 0.998 0.519
the sample size increases. Regarding hypothesis testing, we confirm that the frequentistp-value remains constant as sample size increases, while the one corresponding to thebrc decreases. The power of both tests increases with sample size.
4.2 Heights data
Figure 3 depicts the intrinsic statistic calculated from the 1375 mother-daughter heights data re-corded by Pearson and Lee (1903), with sample correlation of r = 0.4907. There we point out the intrinsic estimator,ρ∗ = 0.49057and, enclosed within the broken lines, the non-rejection
re-gions,Rd∗, corresponding to the threshold values: d∗ = 2.5,5and 7.5. Thus, we may cast some
doubts about the true correlation value between mother-daughter heights being outside the region R2.5 = {0.449,0.530}; we can seriously doubt that it is beyondR5 ={0.427,0.549}and we can be quite sure that it is not outsideR7.5 = {0.410,0.563}. Moreover, it can be safely assumed that the true value isρ=1/2.
One of the most appealing properties of the intrinsic solutions is their invariance under piece-wise one-to-one transformations. For instance, if we are interested in the coefficient of determ-ination, ρ2, all we have to do is to apply the corresponding transformation to the previous res-ults. Hence,(ρ2)∗ = (ρ∗)2 = 0.2407andR
2.5(ρ20) = {0.202,0.281},R5(ρ20) = {0.182,0.301} and R7.5(ρ20)={0.168,0.317}.
Apparent from Figure 3 is also the fact that, given the sample size, the asymptotic approxima-tion,d(ρ0 | r)=δ(r;ρ0)+1/2, is almost indistinguishable form the actual function. Finally, the pro-posed analytic approximation to the intrinsic estimator proves to be very accurate,ρ∗ = √n/(n+1)r= 0.49053.
0.4 0.45 0.5 0.55 0.6
1 2.5 5 7.5
d(ρ0 | r)
ρ∗
[image:11.595.157.443.445.601.2]ρ0
Figure 3. The intrinsic statistic (solid line) and the asymptotic approximation (dotted line) calculated from Person and Lee’s mother-daughter heights data. Also, the intrinsic estimator,
ρ∗ and the rejection regions corresponding to thed∗ =2.5,d∗ =5andd∗ =7.5threshold
4.3 Cancer data
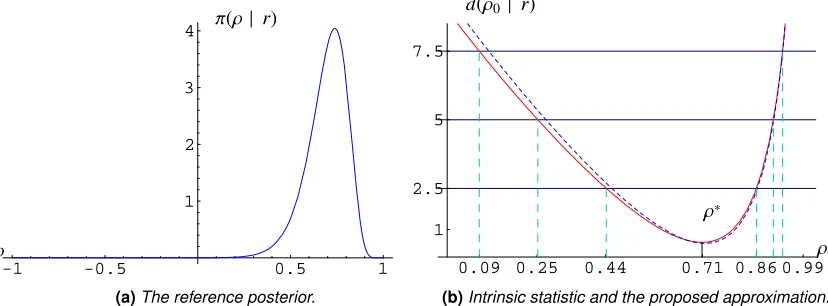
Certainly, the large sample size in the previous example is responsible for the almost exact agree-ment between intrinsic and classical results. In order to explore the extent of this coincidence, we analyse a data set comprising the smoking ratio and the lung cancer standardized mortality ratio (smr), recorded for males in England and Wales during 1970-1972, for each ofn=25“occupation orders” or broad groups of jobs, taken from Hand et al.(1994, pp. 66–67). For this data set the sample correlation isr =0.7162and, unlike the heights data example, the (reference) posterior for the correlation coefficient given this data set is far from Normal, as depicted in Figure 4 (a). Never-theless, the asymptotic approximation to the intrinsic statistic is still very accurate –Figure 4 (b)–, as well as the proposed approximation,ρ∗≈0.7023, to the intrinsic estimator,ρ∗=0.7087. The (non-symmetric) non-rejection regions can again be determined for this case asR2.5 ={0.442,0.0.860}, R5 = {0.252,0..907}, andR7.5 = {0.089,0.933}. Thus, if the basic assumption of joint normality holds for this sample, we could safely reject the hypothesis of no association between smoking ratio and lung cancersmr. Further, we could state that the correlation is positive.
-1 -0.5 0.5 1
1 2 3
4 π(ρ| r)
ρ
(a)The reference posterior.
0.44 0.25
0.09 0.71 0.86 0.99
1 2.5 5 7.5
d(ρ0 | r)
ρ0
ρ∗
[image:12.595.99.513.327.480.2](b)Intrinsic statistic and the proposed approximation.
Figure 4. The reference posterior,π(ρ| r), for the correlation between smoking ratio and lung cancersmr on the left. The right pane shows the intrinsic statistic (solid) and the asymptotic approximation (dotted), with the intrinsic estimator as well as the non-rejection regions pointed out.
5 Conclusions
The reference-intrinsic approach described here provides a powerful alternative to point estimation and sharp hypothesis testing, with a clear interpretation in terms of information units.
threshold, tends to agree with the frequentist test as sample size increases.
Unlike the most commonly utilised Bayes estimators, the intrinsic estimator is invariant under piecewise one-to-one transformations. Further, it clearly performs better than the traditionalmle, particularly in the relevant case when the correlation is near zero. We also showed that themle might be interpreted as an approximation to the intrinsic estimator when both precisions are close, coinciding exactly with the posterior median when they are equal.
The idea of an intrinsic interval estimate stems almost naturally from thebrc. Future research about this invariant, not necessarily symmetric regions which contain the intrinsic estimator will be reported elsewhere.
Appendix A Regularity conditions
Assume that p(x | θ) is a probability density function and that the parametric spaceΘ⊂ Rk. We
say that the model is regular if
(i) The parametric space,Θ, is open.
(ii) The supportC={x∈ X : p(x | θ)>0}is the same for allθ∈Θ.
(iii) For each x∈ X, ∂2 ∂θiθj
p(x| θ)exists and is continuous for alli,j=1, . . . ,k.
(iv) ´ p(x| θ) dxcan be differentiated twice w.r.t. the components ofθ, under the integral.
Appendix B Proofs
B.1 Lemma 1
The setSis convex if for allx,y∈ Syω∈(0,1)thenz=ωx+(1−ω)y∈ S. Further, a functional f, defined on a convex setS, is convex if for eachxeyenS,
ωf(x)+(1−ω)f(y)≤ f ωx+(1−ω)y, 0≤ω≤1.
Let{pi(x),qi(x)}, i=1,2be four probability density functions. Then,
ωpi(x)+(1−ω)qi(x)≥0 and ˆ
ωpi(x)+(1−ω)qi(x) dx=1.
We can write the KL divergence as
k(p2 | p1)= ˆ
p1(x) logpp1(x) 2(x) dx
= ˆ
whithg(x) = p1(x)/p2(x) > 0, the likelihood ratio. Moreover,φ(t) = tlogtis convex, for allt> 0; i.e. lett1,t2 >0, then, for allω∈(0,1),φ ωt1+(1−ω)t2
≤ω φ(t1)+(1−ω)φ(t2). It follows that ˆ
p2(x)φ
ωt1+(1−ω)t2
dx≤ ˆ
p2(x)
ω φ(t1)+(1−ω)φ(t2)
dx.
If we definet1=t1(x)= p1(x)/p2(x)yt2 =t2(x)=q1(x)/q2(x), the result follows.
B.2 Theorem 1
Let{p(x | θ,λ), x∈ X, θ∈Θ, λ∈Λ}be a probability model which meets the regularity conditions above and letk1 =k(θ0,λ0 | θ,λ)yk2=k(θ,λ| θ0,λ0)be the KL divergencies. By Lemma 1, Both functions are convex and also bounded from below by 0.
There exist two alternatives
(i) ki≤kj for all{θ,λ,θ0,λ0} ∈Θ2×Λ2or
(ii) ki≤kj inC⊂Θ2×Λ2yki ≥kjinC0.
The proof in the first case is trivial. In the second case, and without loss of generality, assume thatk1≤k1enC. Define
λ?C =arg min λ0∈C
k1 and λ∗C0 =arg min
λ0∈C0
k2.
On the other hand, defineλ? =λ?(θ,θ
0,λ)∈Λas the value for whichk1reaches its minimum and similarlyλ∗=λ∗(θ,θ
0,λ)∈Λ, fork2.
Given that the divergencies are bounded from below it must happen that ifλ?∈Cthenλ?=λ?C .
On the contrary, ifλ? ∈C0, the assumptions implies thatk(θ
0,λ? | θ,λ)≥k(θ,λ| θ0,λ?).
B.3 Corollary 1
Let{p(x| ψ), x∈ X, ψ∈Ψ}be a probability model belonging to the exponential family. It is easy to prove (Gutierrez-Peña, 1992; Robert, 1996) that
k(ψ2 | ψ1)= ˆ
p x | ψ1 logp x| ψ1
p x| ψ2 dx = M(ψ1)−M(ψ2)+(ψ2t −ψt1)∇M(ψ1),
whereM(ψ)=loga(ψ)y∇M(ψ)=∂M(ψ)/∂ψ;.
Given thata(θ)is a convex function and thatlogzis monotone, thenM(θ)is convex. Similarly, as the KL divergencies are linear combinations ofM(·), both functions are convex and also bounded from below by 0. Two alternatives may happen
(i) Eitherki ≤kjfor all{θ,λ,θ0,λ0} ∈Θ2×Λ2
(ii) orki ≤kjinC⊂Θ2×Λ2yki≥kj inC0.
The proof is thus analogous to that of Theorem 1.
References
Bartlett, M. (1957). A comment on D. V. Lindley’s statistical paradox,Biometrika,44, 533–534.
Bayarri, M. J. (1981). Inferencia bayesiana sobre el coeficiente de correlación en una población normal bivariante,Trabajos de Estadística e Investigación Operativa,32(3), 18–31.
Berger, J. O. and Bernardo, J. M. (1992). On the development of reference priors,Bayesian Stat-istics 4(J. M. Bernardo, J. O. Berger, A. P. Dawid and A. F. M. Smith, eds.), Oxford: University Press, pp. 35–60.
Berger, J. O. and Pericchi, L. R. (2001). Objective Bayesian methods for model selection: Intro-duction and comparison, Model Selection, Lecture Notes, vol. 38 (P. Lahiri, ed.), Institute of Mathematical Statistics, pp. 135–207. (with discussion).
Bernardo, J. M. (1979). Reference posterior distributions for Bayesian inference, J. Roy. Statist. Soc. B,41(2), 113–147.
Bernardo, J. M. and Juárez, M. A. (2003). Intrinsic estimation,Bayesian Statistics 7(J. M. Bernardo, M. J. Bayarri, J. O. Berger, A. P. Dawid, D. Heckerman, A. F. M. Smith and M. West, eds.), Oxford: University Press, pp. 465–475.
Bernardo, J. M. and Rueda, R. (2002). Bayesian hypothesis testing: A reference approach, Inter-national Statistical Review,70, 351–372.
Bernardo, J. M. and Smith, A. F. (1994).Bayesian Theory, Chichester: John Wiley.
Fisher, R. A. (1915). Frequency distribution of the values of the correlation coefficient in samples of an indefinitely large population,Biometrika,10, 507–521.
Gutierrez-Peña, E. (1992). Expected logarithmic divergence for exponential families,Bayesian Stat-istics 4 (J. M. Bernardo, J. O. Berger, A. P. Dawid and A. F. M. Smith, eds.), Oxford university press, pp. 669–674.
Jeffreys, H. (1961).Theory of Probability, Oxford: University Press, third ed.
Juárez, M. A. (2004).Objective Bayes methods for estimation and hypothesis testing, Unpublished PhD thesis, Universitat de Valencia.
Lehmann, E. L. (1986).Testing Statistical Hypotheses, New York: John Wiley, second ed.
Lindley, D. V. (1957). A statistical paradox,Biometrika,44, 187–192.
Lindley, D. V. (1972).Introduction to Probability and Statistics from a Bayesian Viewpoint, Part 2, Cambridge: Cambridge University Press.
O’Hagan, A. (1997). Properties of intrinsic and fractional Bayes factors,Test,6, 101–118.
Pearson, E. S. and Kendall, M. G. (1970).Studies in the History of Statistics and Probability, Lon-don: Griffin.
Pearson, K. and Lee, A. (1903). On the laws of inheritance in Man: I. Inheritance of Physical Characters,Biometrika,2, 357–462.
Robert, C. P. (1996). Intrinsic losses,Theory and Decisions,40, 191–214.
Robert, C. P. and Caron, N. (1996). Noninformative Bayesian testing and neutral Bayes factors,