1
University of Twente
Faculty of Behavioral, Management & Social Sciences
M.Sc. Business Administration
Technical University of Berlin
Faculty of Economics & Management
M.Sc. Innovation Management and Entrepreneurship
MASTER THESIS
INTEGRATING OPEN DATA REUSE INTO THE
BUSINESS MODELS OF GERMAN COMPANIES
by
TANYA STAMOVA
University of Twente, Matr. N. s1695258 Technical University of Berlin, Matr. N. 364139
SUPERVISORS
Dr. Michel Ehrenhard
First supervisor, University of TwenteIr. Björn Kijl
Second supervisor, University of Twente
Prof. Knut Blind
2
Acknowledgements
“No act of kindness, no matter how small, is ever wasted.” – Aesop
I would like to express my deepest gratitude to my supervisors from the University of Twente – Dr. Michel Ehrenhardt and Ir. Björn Kijl. It was only through their guidance, support and dedication that the completion of this thesis was made possible. I would also like to thank prof. Knut Blind from the Technical University of Berlin for his help.
Also, a special thank you to my family and close friends for all their continuous support and encouragement. In times of complications, challenges and struggles, their loving words truly made a difference.
3
Management Summary
With the existing large quantity of open data and new emerging datasets, businesses have new opportunities to create and capture value from open data reuse. But unlike other countries such as the UK or the US, companies in Germany are rarely engaging in such activities. With an identified economic potential of over €130 billion per year, the question arises of how companies can get involved into this promising field.
In line with this, the purpose of this paper is to identify ways in which open data can be integrated into the business models of German companies. It also aims to outline the challenges that German companies face in the business reuse of open data and to identify ways in which these can be overcome.
To study the business model of each company, the current study focuses on six distinctive business model elements: value proposition, value adding process, value network, value in return, value capture and value management, and investigates how open data can be integrated into these. For the analysis, the study uses a combination of desk research and a case study approach, analyzing secondary data from 29 open data companies in Germany and conducting semi-structured interviews with representatives from seven of those. The research findings show that there is great economic potential for companies willing to engage in open data reuse, and countless ways to do so. Numerous possibilities for open data integration into companies’ business models are derived for each of the six business model elements.
Managers can use these results to generate ideas on how to use open data in their business models, or even as means to create their own open data business models based on the presented elements.
4
TABLE OF CONTENTS
1.
INTRODUCTION ... 8
1.1. DEFINITION OF OPEN DATA ...9
1.2. OPEN DATASETS CURRENTLY AVAILABLE IN GERMANY ... 10
1.3. THE POTENTIAL OF OPEN DATA FOR GERMAN BUSINESSES ... 11
1.4. PROBLEM DEFINITION, GOAL OF THE RESEARCH & CENTRAL RESEARCH QUESTION 12 1.5. CONTRIBUTION OF THE STUDY ... 13
2.
RESEARCH FRAMEWORK ... 14
2.1. THE BUSINESS MODEL CONCEPT ... 14
2.2. THE RELEVANCE OF THE BUSINESS MODEL FOR THE CURRENT STUDY ... 15
2.3. OVERVIEW OF GENERIC BUSINESS MODEL FRAMEWORKS ... 16
2.4. OVERVIEW OF OPEN DATA RELATED BUSINESS MODEL FRAMEWORKS ... 18
2.5. SELECTION OF A BUSINESS MODEL FRAMEWORK ... 21
2.6. FURTHER SPECIFICATION OF THE SUB-QUESTIONS & SCOPE OF THE RESEARCH ... 22
3.
RESEARCH METHODOLOGY AND DESIGN ... 24
3.1. SELECTION OF A RESEARCH APPROACH, STRATEGY AND METHOD ... 24
3.2. DEFINITION OF THE POPULATION & SAMPLING ... 25
3.3. DATA COLLECTION ... 26
3.4. DATA ANALYSIS ... 30
3.4.1. DEFINITION OF CASE-STUDY-BASED RESEARCH ... 30
3.4.2. REASONING BEHIND THE SELECTION OF A CASE STUDY STRATEGY ... 30
3.4.3. SINGLE VERSUS MULTIPLE CASE STUDIES ... 30
3.4.4. CASE STUDIES FORMULATION PROCESS ... 31
3.4.5. OVERCOMING THE CHALLENGES OF THE CASE STUDY RESEARCH ... 34
3.5. ENSURING RESULTS VALIDITY AND RELIABILITY ... 35
4.
DATA ANALYSIS ... 37
4.1. INITIAL DESK RESEARCH ... 37
4.2. CASE STUDIES ... 39
4.2.1. THE CASE OF “IMPLISENSE GMBH” ... 39
4.2.2. THE CASE OF “GREEN CITY SOLUTIONS GMBH” ... 42
4.2.3. THE CASE OF “MOTION INTELLIGENCE GMBH” ... 45
4.2.4. THE CASE OF “CITY CULT GBR” ... 48
4.2.5. THE CASE OF “TERRANEA UG” ... 50
4.2.6. THE CASE OF “MR. FRIDGE SOFTWARE” ... 53
5
5.
RESEARCH RESULTS ... 59
5.1. VALUE PROPOSITION ... 61
5.1.1. PRODUCTS & SERVICES ... 61
5.1.2. DISTRIBUTION CHANNEL ... 63
5.2. VALUE ADDING PROCESS ... 64
5.2.1. ACTIVITIES ... 64
5.2.2. RESOURCES ... 66
5.2.3. MARKET SEGMENT ... 66
5.3. VALUE NETWORK ... 67
5.3.1. CUSTOMERS ... 67
5.3.2. SUPPLIERS... 68
5.3.3. PARTNERS ... 70
5.4. VALUE IN RETURN ... 71
5.5. VALUE CAPTURE ... 73
5.5.1. MONETARY ... 73
5.5.2. NON-MONETARY ... 75
5.6. VALUE MANAGEMENT ... 77
5.7. CHALLENGES FOR THE REUSE OF OPEN DATA BY BUSINESSES ... 78
5.7.1. CHALLENGES FACED BY COMPANIES REUSING OPEN DATA ... 78
5.7.2. OVERCOMING THE CHALLENGES RELATED TO OPEN DATA ... 80
5.7.3. THE FUTURE OF OPEN DATA IN GERMANY ... 82
5.8. COMPARISON OF THE RESULTS WITH EXISTING LITERATURE ... 83
6.
CONCLUSIONS ... 86
7.
RESEARCH IMPLICATIONS & LIMITATIONS ... 90
7.1. PRACTICAL IMPLICATIONS ... 90
7.2. THEORETICAL IMPLICATIONS AND FUTURE RESEARCH ... 91
6
TABLE OF FIGURES
Figure 1: The 6V business model framework (simplified) ... 18
Figure 2: The 6V business model framework (detailed) ... 20
Figure 3: Central research question & Sub-questions ... 22
Figure 4: Sub-chapters answering the research sub-questions ... 22
Figure 5: Case study process depiction ... 31
Figure 6: Template for data display and analysis ... 32
Figure 7: The business model of Implisense GmbH ... 39
Figure 8: The business model of GreenCitySolutions GmbH ... 42
Figure 9: The business model of Motion Intelligence GmbH ... 45
Figure 10: The business model of CityCult GbR ... 48
Figure 11: The business model of Terranea UG ... 50
Figure 12: The business model of Mr. Fringe Software ... 53
Figure 13: The business model of Mundraub gUG ... 56
Figure 14: Research results for Products & Services ... 61
Figure 15: Products & Services in detail: Value-adding software solutions ... 61
Figure 16: Products & Services in detail: Value-adding services ... 62
Figure 17: Research results for Distribution channel ... 63
Figure 18: Research results for Activities ... 64
Figure 19: Research results for Resources ... 66
Figure 20: Research results for Customers ... 67
Figure 21: Research results for Suppliers ... 68
Figure 22: Research results for Partners ... 70
Figure 23: Research results for Value in return ... 71
Figure 24: Research results for Monetary Returns ... 73
Figure 25: Research results for Non-monetary Returns ... 75
Figure 26: Research results for Organizational Structure ... 77
TABLE OF TABLES
Table 1: Business model frameworks ... 16Table 2: The sub-categories of the 6V business model framework ... 19
Table 3: Comparison of selected business model frameworks ... 21
Table 4: Selected sub-categories of the 6V business model framework ... 23
Table 5: Research results overview I ... 59
Table 6: Research results overview II ... 60
7
APPENDIX
APPENDIX A: LIST OF RESPONDENTS ... 94
APPENDIX B: DATA COLLECTED ... 95
Appendix B1: Open data companies & Company characteristics ... 95
Appendix B2.1.: Value proposition data I – Products & Services ... 96
Appendix B2.2.: Value proposition data II – Distribution channel ... 98
Appendix B3.1: Value adding process data I – Activities ... 99
Appendix B3.2: Value adding process data II – Recources ... 100
Appendix B4: Value network data ... 101
Appendix B5: Value in return data ... 102
Appendix B6: Value capture data ... 104
APPENDIX C: COMPARISON OF THE RESULTS WITH EXISTING LITERATURE ... 105
Appendix C1.1: Value proposition results comparison I - Products & Services ... 105
Appendix C1.2: Value proposition results comparison II - Distribution channel ... 105
Appendix C2: Value adding process results comparison ... 106
Appendix C3.1: Value network results comparison I - Customers ... 107
Appendix C3.2: Value network results comparison II - Suppliers ... 107
Appendix C3.3: Value network results comparison III - Partners ... 107
Appendix C4: Value in return results comparison ... 108
8
1. INTRODUCTION
With the digital transformation that has been taking place in the past 20 years, businesses in many industries have undergone significant changes in the ways they operate and create value. Many of companies’ activities are now being performed either exclusively in the digital world, or online in addition to offline. From distribution, to supplier and customer relationships, to marketing and employee acquisition – the online presence of a company today plays a crucial role in its existence. This vast amount of tasks and activities performed online, combined with individuals spending an increasing amount of time in the digital world, have resulted in the demand and supply of enormous amounts of data, gathered from various sources and for different purposes.
With this trend of data becoming increasingly important for both citizens and businesses, the governments of various countries have initiated the digitalization of much of the data that traditionally has been collected by them. And with various organizations and businesses following their example, individuals now have free access to large amount of so called “open data” – data available free online, with no technical restrictions to its download, use or commercialization. Analysts indicate that this data has an enormous potential for businesses, and successful companies in countries such as the Netherlands, the UK and the US are heavily investing in its reuse. At the same time, in the specific case of Germany, there are only a few examples of commercial open data reuse, despite the great business potential.
In line with this, the goal of the current research is to identify ways in which German businesses can integrate this open data into their value creation process. More specifically, as value creation is typically studied in the concept of the business model, the central research question of this study is the following, “How can the reuse of open data be integrated into the business models of German companies?” Instead of seeking to create a new typology of open data business models, this study aims to dive deep into the business models and investigate through which business model elements companies can integrate open data reuse into their operations.
9 1.1. DEFINITION OF OPEN DATA
In aiming to understand the concept of open data, one has to answer two underlying questions: 1) “What is data?”, and 2) “What is openness as related to data?”
In regards to the first question, Spek & Spijkervet (1997) give the following definition for data: “Data are understood to be symbols that have not yet been interpreted” (p. 13, quoted by Tuomi, 2000, p.104). In this sense, when referring to data, one could think of tables or lists, containing various figures, numbers or words that cannot be used as basis for action before their meaning is clarified. For example, data could show the amount of individuals employed in the automotive industry or the temperature levels during a particular time of the day. However, in order for this data to be meaningful and useful to individuals, it has to be processed through activities such as data analysis. For instance, to interpret the data from the previous example, one could benefit from a comparison of the amount of employees in the automotive industry and the ones employed in agriculture, or one could observe how the numbers have been changing in a selected time-frame. In this sense, data can be seen as the foundation for building information.
Second, Zimmermann & Pucihar (2015) point out that openness in regards to data is related to the free use, reuse and redistribution by anyone. Therefore, to comply with the criteria of openness, data has to be free of charge, obtainable by everyone, and with no technical or other restrictions as to what can or cannot be done with the data - it can be used for individual, as well as commercial purposes. In addition, Bonina (2013) describes that in order for data to be open, it needs to comply to four criteria: it must be accessible, usable, intelligible and assessable. Open data must be published in a manner easy to find, use and reuse, and it must make it possible for individuals to judge its reliability and to scrutinize it.
Finally, this leads to the definition of open data. For the purposes of this paper, the definition of Jetzek, Avital & Bjorn-Andersen (2013) will be used, describing open data as data which is:
10 1.2. OPEN DATASETS CURRENTLY AVAILABLE IN GERMANY
As in many other countries, the government has traditionally been the main publisher of open data in Germany, seeking to increase transparency and accountability, stimulate innovation and entrepreneurship, and reduce operating costs. Currently, over 27,000 open datasets are published on Govdata.de alone – the portal for open government data in Germany. The information ranges from transport, to health, to economic and education data. Through the portal, individuals and businesses have free access to information such as a list of existing schools or hospitals in a chosen city in the country, information about noise pollution or available sports clubs in a given area.
And although to this day the majority of open data remains public government data, businesses, institutions and organizations have also recently started to open up their databases. A good example in this regard is “Stromnetz Berlin”, a company providing electricity services in the country’s capital. The firm has developed its own open data portal – Netzdaten-Berlin.de - and currently has published nearly 200 datasets, categorized into 8 distinctive categories, all related to electricity. Another example is “VBB Verkehrsverbund Berlin-Brandenburg”, the company providing public transportation services in the capital. It currently publishes open transport data, for example information about routes, timing and lines of busses and metro trains. Many other institutions and businesses have also opened their data.
A good summary of much of the available open data in Germany is provided by the online portal OffeneDaten.de. The website was initiated by private individuals in 2010, and includes datasets from both public institutions and private businesses and organizations. Today, the website provides over 10,000 open datasets online from various sources and numerous categories, such as environment and climate, education, economics, culture, health, infrastructure etc. The data is available in different formats, such as CSV, XLS, HTML, JSON and can be used by anyone who has internet access. Through the portal, individuals and businesses have access to information such as a list of parking ticket machines in a given area, description of the yearly Christmas markets or the locations of all defibrillators in a given geographical region.
11 1.3. THE POTENTIAL OF OPEN DATA FOR GERMAN BUSINESSES
In line with the above, one important question arises and this is whether or not this data has any value for businesses and whether or not it can in practice be used by companies. In other words, is the data useful for businesses and what is its potential?
In fact, both researchers and analysts have recognized that there is an enormous economic potential coming from the reuse of open data. Open data has recently been described as “digital gold” or “the new oil” (Dapp et. al., 2016). According to estimations of the McKinsey Global Institute, open data is expected to enable an annual value of 3 trillion USD worldwide (Manyika et. al., 2013). For Germany, most recent study by the Konrad Adenauer Stiftung (Dapp et. al., 2016) identified that open data could generate up to 131.1 billion EUR per year in an “optimistic scenario” and 43.1 billion EUR in a so called “ambitious scenario”.
Another factor pointing to the potential of open data for businesses is the fact that there already exist numerous examples of companies worldwide that generate high profits through the reuse of open data. Such is for instance the case of Zoopla – a UK based company active on the real estate market. Zoopla is claimed to be the leading online property search platform in the UK (Zoopla, 2016). Apart from other sources of data, the company uses for their website open house sales data from the UK land registry (The World Bank, 2014), transforms it, and offers it to users in a more understandable way. According to the company’s website, Zoopla’s web platform now attracts over 40 million visits per month. In 2015 the company had revenues of £107.6 million and net profit in the amount of £25.4 million (Zoopla, 2015).
12 1.4. PROBLEM DEFINITION, GOAL OF THE RESEARCH & CENTRAL RESEARCH QUESTION All of the above shows that there is a large quantity of open data already available in Germany and great potential associated with it. But the examples of firms creating open-data-related products and services are currently very scarce. Rather, data is most often reused by (groups of) private individuals, without the establishment of a legal entity or goals of revenue generation. This is facilitated by initiatives that aim to promote open data, such as the “Code for Germany” program where designers, developers and enthusiasts meet on a regular basis and develop free open-data-based applications.
Such apps and tools contribute to the overall open data landscape in Germany, where the majority of products based on open data reuse are rather simple visualization tools that present the data online and are provided to customers free of charge. Such are the examples of “Trinkwasser” (visualizing data on the content of drinking tap water in the region of Heilbronn), and “ParkenDD” (visualizing parking places data in the city of Dresden). For users, such tools are beneficial in offering comprehensibility of data for individuals with no technical background, as opposed to the raw data that is typically usable mainly by IT specialists. However, these projects bring no monetary benefit to their creators, but are instead developed for the purposes of serving the community, enhancing personal programming skills, or fulfilling other private motives.
In line with this and the potential of open data outlined above, this raises the question of how companies in Germany can use open data not only to serve the community, but also to extract monetary and non-monetary benefits for their businesses. This sets the goal for the current study: to identify ways in which German businesses can integrate open data reuse into their value creation process. In doing so, companies can get involved in realizing (some of) the economic potential identified by researchers and analysts.
In order to fulfill this goal, the research will employ the most common practice used by academics and practitioners when describing how value is created by companies - the business model (further described in §2). Thus, the central research question of this study is the following: How can the reuse of open data be integrated into the business models of German companies?
13 1.5. CONTRIBUTION OF THE STUDY
Theoretical contribution: The study will build on the research of Zeleti, Ojo & Curry (2016) as per the authors’ future research suggestion to overcome the limitations that current business models are “the outcome of the researchers’ perception” (p.11), rather than the result of an empirical investigation. Although some researchers have focused on developing theoretical frameworks on open data value creation and business modeling
(e.g. Musings, 2012 ; Ferro & Osella, 2013 ; Howard, 2013), empirical research on open data business modeling is in practice still very limited, and academic literature in the field is “in its infancy” (Zuiderwijk et. al., 2014, p.1). Bonina (2013, p.12) points out that “the business models that may help extracting the potential value of open data are not well understood”, confirmed also by Zeleti, Ojo & Curry (2016). Therefore, the study aims to fill this gap by investigating how the theoretical framework developed by academics is being applied in practice and what potential measures can be taken, in order for open data businesses to thrive, in particular in Germany. This will help to shape the future of academic research on the topic of value creation in the open data industry.
14
2. RESEARCH FRAMEWORK
In order to find ways in which German businesses can integrate open data into their value creation processes, a fitting research framework needs to be selected and implemented. In studying similar questions related to value creation and capture, academics and practitioners typically use the business model, as it provides the researcher with an opportunity to dive deep into the various parts of a company’s operations, to understand the logic of the relationships between them, and thus to gain an understanding about the business as a whole. Kindström (2010), for example, explains the business model as “a useful analysis framework to understand a company and its inherent parts” (p.481). Following this example, the business model has been selected to be used in this study. 2.1. THE BUSINESS MODEL CONCEPT
Although the concept of the business model is still relatively “fuzzy and vague” (Al-Debei & Avison, 2009, p.359) and there is no unanimity among researchers into what constitutes a business model (Janssen & Zuiderwijk, 2014), academics mainly agree that business models are derived from an organization’s mission and strategy and show the rationale behind generating value (Keen & Qureshi, 2006). More specifically, the business model describes:
“the architecture of a firm and its network of partners for creating, marketing and delivering value and relationship capital to one or several segments of customers in order to generate profitable and sustainable revenue streams”
(Dubosson-Torbay, Osterwalder & Pigneur, 2001, p.3).
By dividing the value creation process into distinguishable elements, the business model provides a way to study the logic of a business and answer questions such as:
What is the unique product or service that the company provides? Through what network of partners does the company create value? What activities are involved in the value creation process?
How does the company generate revenues from the products and services created?
15 2.2. THE RELEVANCE OF THE BUSINESS MODEL FOR THE CURRENT STUDY
The business model has primarily been studied in the setting of technological companies
(Kindström, 2010) and in particular in e-businesses (e.g. Afuah & Tucci, 2001 ; Dubosson-Torbay et. al., 2001 ; Lumpkin & Dess, 2004). As technological innovations (such as the emerging of open data) often reveal new customer needs and cause the creation of new or change in existing business models (Teece, 2010) it is particularly interesting to implement the business model for the case of open data. Companies that currently integrate open data into their businesses have previously either (1) not had access to the data, or (2) had various difficulties obtaining it. By making large amounts of data freely accessible, the government, companies and institutions have laid the foundation for incremental and radical innovations, and along with it – new business models.
But developing a business model that would integrate open data into the company’s operations in a way that not only creates value for customers but also captures this value in the form of profits for the company is no easy task. And unless businesses do indeed find such a suitable model, they run the risk of not capturing the full economic potential of the new technology (Chesbrough, 2010). This is especially true for the information sector, where products and services are often produced and distributed for near zero marginal cost (Lee, 2001) and customers expect them to be delivered free of charge (Teece, 2010). In this case, the differences between competing firms’ business models can often explain why some products and services make it to the market, while others do not. Teece (2010)
notes that the reason why great technological achievements often fail commercially is because of not giving enough attention to designing a proper business model and
Chesbrough (2010) points out that taking the same technology to the market through different business models leads to different results. In line with this, it is particularly interesting to investigate business models in the open data field, where all companies freely have access to the same resource and have the ability to create nearly identical products. In this case, the specifics of the business model will play a crucial role for capturing maximum value from the company’s operations.
16 2.3. OVERVIEW OF GENERIC BUSINESS MODEL FRAMEWORKS
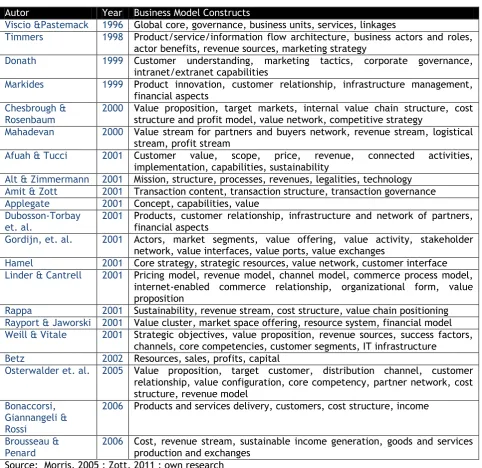
[image:16.595.66.549.212.680.2]Having considered the benefits of using the business model in the current research, one needs to adopt a specific business model framework, describing the building components of a firm and the relationships between them. With this purpose in mind, researchers have constructed various configurations, often offering similar, yet distinctive ideas into what constitutes a business model. Some of the proposed frameworks include the following: Table 1: Business model frameworks
Autor Year Business Model Constructs
Viscio &Pastemack 1996 Global core, governance, business units, services, linkages
Timmers 1998 Product/service/information flow architecture, business actors and roles, actor benefits, revenue sources, marketing strategy
Donath 1999 Customer understanding, marketing tactics, corporate governance, intranet/extranet capabilities
Markides 1999 Product innovation, customer relationship, infrastructure management, financial aspects
Chesbrough & Rosenbaum
2000 Value proposition, target markets, internal value chain structure, cost structure and profit model, value network, competitive strategy
Mahadevan 2000 Value stream for partners and buyers network, revenue stream, logistical stream, profit stream
Afuah & Tucci 2001 Customer value, scope, price, revenue, connected activities, implementation, capabilities, sustainability
Alt & Zimmermann 2001 Mission, structure, processes, revenues, legalities, technology Amit & Zott 2001 Transaction content, transaction structure, transaction governance Applegate 2001 Concept, capabilities, value
Dubosson-Torbay et. al.
2001 Products, customer relationship, infrastructure and network of partners, financial aspects
Gordijn, et. al. 2001 Actors, market segments, value offering, value activity, stakeholder network, value interfaces, value ports, value exchanges
Hamel 2001 Core strategy, strategic resources, value network, customer interface Linder & Cantrell 2001 Pricing model, revenue model, channel model, commerce process model,
internet-enabled commerce relationship, organizational form, value proposition
Rappa 2001 Sustainability, revenue stream, cost structure, value chain positioning Rayport & Jaworski 2001 Value cluster, market space offering, resource system, financial model Weill & Vitale 2001 Strategic objectives, value proposition, revenue sources, success factors,
channels, core competencies, customer segments, IT infrastructure Betz 2002 Resources, sales, profits, capital
Osterwalder et. al. 2005 Value proposition, target customer, distribution channel, customer relationship, value configuration, core competency, partner network, cost structure, revenue model
Bonaccorsi, Giannangeli & Rossi
2006 Products and services delivery, customers, cost structure, income
Brousseau &
Penard 2006 Cost, revenue stream, sustainable income generation, goods and services production and exchanges Source: Morris, 2005 ; Zott, 2011 ; own research
17 to be used by academics and practitioners (e.g. Morris, 2005), there is still no dominant and generally accepted framework.
Nevertheless, some frameworks have been more widely accepted than others. One example of such is the one developed by Shafer, Smith & Linder (2005). After thorough analysis of 12 established publications on business modeling, the researchers identified 42 distinct elements of a business model and clustered them into four major categories: Strategic Choices, Value Network, Create Value, and Capture Value. Some of the elements include Value Proposition, Strategy, Branding, Differentiation, Mission, Customer Information, Information Flows, Profit, and Processes/Activities. Despite the theoretical strength and high citation rate of the framework however, it has rather low practical implications and has rarely been used by managers or business analysts. As this paper emphasizes both the academic and the practical side of open data integration into companies’ business models, this framework was not further considered in this research. The one framework which seems to be most often used both in research and in practice is the so called business model canvas developed by Osterwalder & Pigneur (2009). The canvas was developed by over 470 practitioners from 45 countries and was presented as a tool for the description, analysis, and design of business models. It describes nine interrelated building blocks defining how value is created and captured in organizations:
Customer segments: the groups of individuals/organizations the firm serves; Value propositions: the products/services created for a customer segment; Channels: the way a company reaches its customer segments;
Customer relationships: the relationships established with customer segments; Revenue Streams: the cash generated from each customer segment;
Key Resources: the most important assets used in the value creation process; Key activities: the most important things done during the value creation process; Key Partnerships: the network of suppliers and partners involved in the business; Cost structure: the costs incurred to operate the business.
18 2.4. OVERVIEW OF OPEN DATA RELATED BUSINESS MODEL FRAMEWORKS
When it comes to open data business modeling, the most commonly used and cited in academic literature are the eight archetypes for public sector information reuse created by Ferro & Osella (2013). The term “public sector information” was used due to the fact that “open government data” was at that time still not developed as a term. The study by Ferro & Osella, however, remains a constant in almost every literature review conducted on the topic of open data related business models. In their research, Ferro & Osella use as a foundation the business model canvas developed by Osterwalder & Pigneur (2009) and add three more components to their framework: Types of Data Elaboration, Role of PSI in the Value Proposition, and Price Mechanism. After analyzing real case studies and how they fit into the developed framework, they even created a typology of open data (or in their case – public sector information) based business models and differentiated between eight distinctive archetypes (e.g. Freemium, Open Source Like, Free as Branded Advertizing etc). One of the drawbacks of this framework is the fact that it does not provide clear guidelines or criteria in order to make it possible for other researchers to also implement the framework.
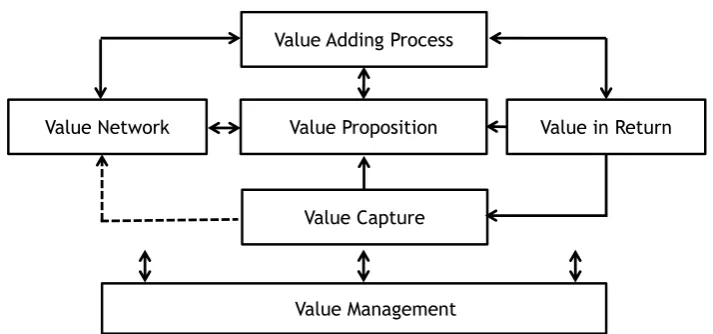
[image:18.595.119.476.549.716.2]Later, a handful of other researchers focused on the development of business models specifically for the open data industry (Howard, 2013 ; Ferro & Osella, 2013 ; Musings, 2012) and thus the need for creating a unified theoretical framework emerged and was addressed by Zeleti, Ojo & Curry (2016). Although their study focuses on the analysis of business models for open government data, the researchers also looked into other, rather generic businesses. As a result, they proposed six building elements of a business model. This resulted in the so called "6V framework":
Figure 1: The 6V business model framework (simplified)
Source: Adapted from Zeleti, Ojo & Curry, 2016
Value Adding Process
Value Proposition
Value Capture Value Network
Value Management
19 The 6V framework consists of the following core elements:
Value proposition: the specific value created and offered by the business; Value adding process: the activities required to deliver the value;
Value network: the various actors involved in the value creation process;
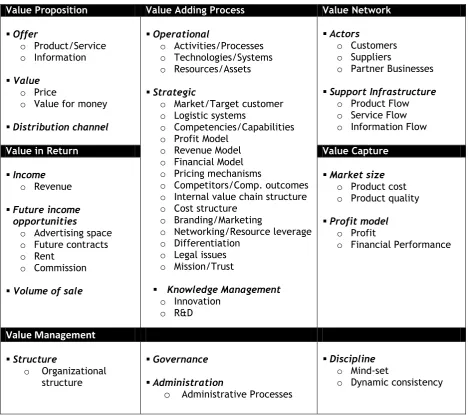
[image:19.595.65.534.281.696.2] Value in return: (non-)monetary value received through the value adding process; Value capture: the process of retaining some of the value of every transaction; Value management: the influence of top managers on the value creation process; Each of these core elements is further divided into second and third level sub-elements guiding the description of the business in more detail:
Table 2: The sub-categories of the 6V business model framework
Value Proposition Value Adding Process Value Network Offer
o Product/Service o Information
Value o Price
o Value for money
Distribution channel
Operational
o Activities/Processes o Technologies/Systems o Resources/Assets
Strategic
o Market/Target customer o Logistic systems
o Competencies/Capabilities o Profit Model
o Revenue Model o Financial Model o Pricing mechanisms
o Competitors/Comp. outcomes o Internal value chain structure o Cost structure
o Branding/Marketing
o Networking/Resource leverage o Differentiation
o Legal issues o Mission/Trust
Knowledge Management o Innovation
o R&D
Actors
o Customers o Suppliers
o Partner Businesses
Support Infrastructure o Product Flow o Service Flow o Information Flow
Value in Return Value Capture
Income o Revenue
Future income opportunities
o Advertising space o Future contracts o Rent
o Commission
Volume of sale
Market size o Product cost o Product quality
Profit model o Profit
o Financial Performance
Value Management Structure o Organizational structure Governance Administration
o Administrative Processes
Discipline o Mind-set
o Dynamic consistency
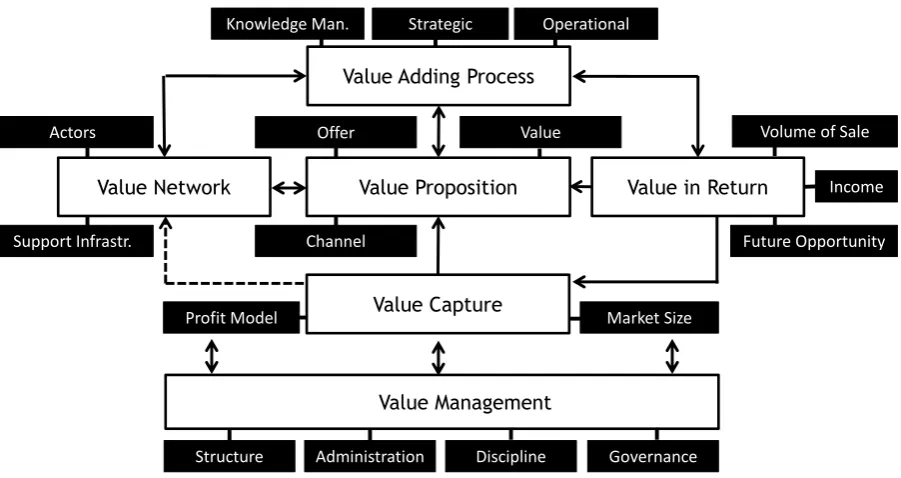
20 When adding the second level sub-categories to the model, the 6V framework can be depicted through the following graph:
Figure 2: The 6V business model framework (detailed)
Source: Adapted from Zeleti, Ojo & Curry, 2016
Diving into the specifics of the 6V framework, one important aspect is the specifics of the “Value in Return” component. When describing the 6V components, the authors apply to this category the elements income (revenues), future income opportunities (advertising space, future contracts, rent, and commission) and volume of sale. However, when giving specific examples of what value in return may look like in practice they mention instances such as “higher quality data with increased value” or “availability of data to public”. Therefore, the value in return can rather be understood as the value added by the company to the raw open data through implementing the specific business model, or in other words - as the value the customer is paying for when purchasing the products or services. Therefore, the value in return component describes the value added by the company that differentiates the final product or service from the raw data that the customer can otherwise obtain for free. Related to this, the component of “Revenue” belongs to the “Value capture” sub-element, rather than the “Value in return”, as it is the main example pointed out by Zeleti, Ojo & Curry when providing instances for “Value Capture” (e.g. “revenue from added value services”, “revenue from potential advertisers”, “revenue received”). Therefore, in addition to the revenues and value proposition elements which are also mentioned in other frameworks, the 6V framework has the benefit that it provides an opportunity for the researcher to describe the specific value added to the raw data by the company.
Value Adding Process Value Proposition
Value Capture Value Network
Value Management
Value in Return
Administration
Structure Discipline Governance
Profit Model Market Size
Knowledge Man. Strategic Operational
Volume of Sale
Future Opportunity Income
Support Infrastr.
Actors Offer Value
21 2.5. SELECTION OF A BUSINESS MODEL FRAMEWORK
[image:21.595.67.535.314.402.2]As it has been pointed out, each of the frameworks described has its strengths and weaknesses. The one developed by Shafer, Smith & Linder (2005) has been popular among researchers but its practical application has been scarce. The business model canvas is highly popular but it is not specifically suited for the open data companies. The framework by Ferro & Osella (2013) is indeed related to open data but focuses mainly on data coming from the public sector. Lastly, the framework developed by Zeleti, Ojo & Curry (2016) is highly relevant to the open data field and builds upon some academic work that has been derived from practical observation, but the framework itself has not been tested in practice due to the fact that it has been developed very recently. The following table shows some of the relative strengths and weaknesses of each of the frameworks:
Table 3: Comparison of selected business model frameworks
Author
Theore-tical strength
Practi-cal strength
Relation to generic businesses
Relation to open data
Recent-ness Level of detail / clarity
Shafer, Smith & Linder (2005) ++ - ++ -- -- +
Osterwalder & Pigneur (2009) ++ ++ ++ - - +
Ferro & Osella (2013) + ++ -- + + +
Zeleti, Ojo & Curry (2016) ++ + ++ ++ ++ ++
In order to proceed with the current research, a decision has to be made in order to choose the most fitting business model framework. In doing so, it needs to be kept in mind that each framework has its weaknesses and that such a decision always includes a component of compromise – accepting some of the weaknesses of a particular framework on account of its relative strength compared to the other frameworks. As a result, the framework developed by Zeleti, Ojo & Curry (2016) was selected to be further used in this research. The reasons for the choice include the following:
it is the most recent framework developed and builds on the analysis of the majority of important business model publications up to date, both theoretical and practical;
for the construction of the framework the authors build upon publications related to both general and open-data-specific business models, thus making it highly suitable for the open data industry but also including important insights from general business model literature;
22 2.6. FURTHER SPECIFICATION OF THE SUB-QUESTIONS & SCOPE OF THE RESEARCH
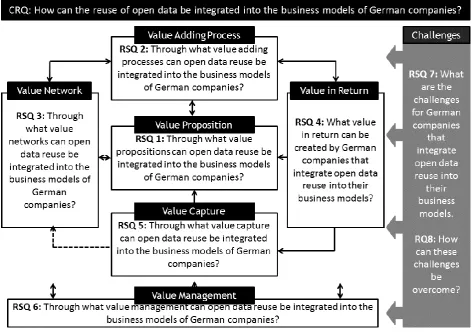
[image:22.595.70.543.181.513.2]Research Sub-questions: The selection of the Zeleti, Ojo & Curry’s (2016) framework allows for further specification of the central research question into respective sub-questions. These will guide the research and include the following:
Figure 3: Central research question & Sub-questions
[image:22.595.69.548.593.686.2]For clarity purposes, each of these research sub-questions will be answered in a respective sub-chapter in this paper, as follows:
Figure 4: Sub-chapters answering the research sub-questions
23
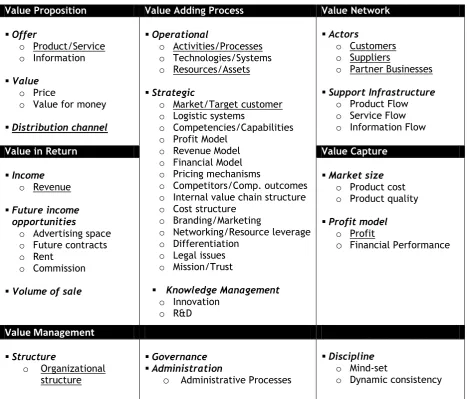
Research Scope: With the research sub-questions specified, the scope of the research can also be narrowed down. The research will focus only on selected elements of the business model described by Zeleti, Ojo & Curry (2016), as the goal is not to describe the business models of existing open-data related companies in perfect detail, but rather to understand how open data is integrated into such. In the selection of the elements, two main considerations were observed: the element’s weight of the importance for the business model and the possibilities of obtaining the data. In their paper, Zeleti, Ojo & Curry (2016)
[image:23.595.66.534.362.761.2]provide an overview of related previous research and indicate the frequency of occurrence of each of the elements in the respective papers. By investigating how often academics have considered a specific element to be important enough to be included in their research, the weight of importance of the elements was determined. Thus, the most often occurring elements in each category were selected. In addition, certain elements, such as profit model, were excluded, as the information was difficult to obtain. As a result, the following categories (underlined ones) were selected to be included in the research:
Table 4: Selected sub-categories of the 6V business model framework
Value Proposition Value Adding Process Value Network Offer
o Product/Service o Information
Value o Price
o Value for money
Distribution channel
Operational
o Activities/Processes o Technologies/Systems o Resources/Assets
Strategic
o Market/Target customer o Logistic systems
o Competencies/Capabilities o Profit Model
o Revenue Model o Financial Model o Pricing mechanisms
o Competitors/Comp. outcomes o Internal value chain structure o Cost structure
o Branding/Marketing
o Networking/Resource leverage o Differentiation
o Legal issues o Mission/Trust
Knowledge Management o Innovation
o R&D
Actors
o Customers o Suppliers
o Partner Businesses
Support Infrastructure o Product Flow o Service Flow o Information Flow
Value in Return Value Capture
Income o Revenue
Future income opportunities
o Advertising space o Future contracts o Rent
o Commission
Volume of sale
Market size o Product cost o Product quality
Profit model o Profit
o Financial Performance
Value Management Structure o Organizational structure Governance Administration
o Administrative Processes
Discipline o Mind-set
24
3. RESEARCH METHODOLOGY AND DESIGN
3.1. SELECTION OF A RESEARCH APPROACH, STRATEGY AND METHOD
For the current study, an inductive research approach was selected, seeking to build theory as a result of the data analysis, rather than through the testing of existing theory or hypothesis. One significant benefit of such an approach, pointed out by Saunders, Lewis & Thornhill (2009) is that the researcher is not bound to the limits of the existing theory that is being put to the test, but is rather enabled to discover new patterns and constantly adapt the theory according to new discoveries made during the process of data collection and analysis. The current one is also an exploratory study, aiming to find out “what is happening, to seek new insights, to ask questions and to assess phenomena in a new light”
(Robson, 2002, p.59). Such studies are typically aiming at researching questions in fields where literature is still scarce or even missing. The research is also concerned with a “how” question (“How the reuse of open data is integrated into the value creation processes of German companies”).
In line with this, a case study research strategy was selected, which is one of the most often recommended for answering questions of “how” (Yin, 1994), for conducting exploratory research (Saunders, Lewis & Thornhill, 2009) and for researching questions for which the existing theoretical knowledge is rather limited (Siggelkow, 2007). The strategy of case study research was also chosen due to the opportunity it provides to study the business models in depth, and to get insight into the organization and its processes as a whole (further explained in §3.4.2).
25 3.2. DEFINITION OF THE POPULATION & SAMPLING
In order to study how open data can be integrated into the business models of German firms, this study looks into the value creation processes of existing German firms, involved in open data reuse. Due to the small size of the population of such companies, data was collected for all the businesses which fulfilled certain pre-defined requirements. The formulation of such requirements, or “limiting factors”, is an important prerequisite for selecting the cases, as is also explained by Benbasat, Goldstein & Mead (1987). In the present paper it was decided upon the following limiting factors:
Only legal entities: In many cases open data was re-used and put into projects and initiatives, created by individual developers or groups of individuals. Such were excluded from the research, as they do not constitute a legal corporate entity, thus having no relevance to the research question.
Only private companies: Public companies, governmental bodies, research institutes and other non-private entities often have different motives and thus obtain different benefits from the reuse of open data, not relevant to this research. Only current projects: Due to the specifics of open data, some companies only
experiment with its use for a short period of time, after which they terminate the project(s). In other cases, companies have developed plans for open data reuse and are close to its execution but there still exists an uncertainty as to when (and if) the project will take place, and how it will generate value in practice as compared to the initial plan. Thus, such projects were excluded.
Only companies active in the reuse of open data: Often it was identified that certain companies are publishing open data but are themselves not using such in their operations for value creation. Such firms were not included in the population. For all the companies fulfilling the above requirements, initial data was collected from secondary sources such as corporate websites and news articles. As a result, a list of companies was generated, providing information for each of the companies’ business models. This resulted in an initial limited overview of the business models involving open data reuse in Germany, which was then presented in §4.1.
26 3.3. DATA COLLECTION
One important feature of the case study research is the analysis of various sources of evidence (Benbasat, Goldstein & Mead, 1987; Eisenhardt, 1989; Yin, 1994). Yin (1987) for example describes six sources of evidence: documents, archival records, interviews, direct observations, participant observation and physical artifacts. Benbasat, Goldstein & Mead (1987) further explain the importance of complementing evidence with the goal to obtain “a rich set of data surrounding the specific research issue, as well as capturing the contextual complexity” (p. 374). In addition, various sources of information are crucial for assuring construct validity of the results (further explained in §3.5). Therefore, the data collection process for this study was roughly divided into four stages.
Stage 1: Literature review: Three information sources were selected for the systematic review of academic literature that set the foundation for the research: “Web of Science”, “ScienceDirect” and “Google Scholar”. In all of the databases keywords were used to identify relevant literature, including “open data”, “business models”, “value creation” and combinations of such. The search was limited to scientific articles published after 2005, as the term “open data” did not exist before this year. For the overview of literature related to generic business models, the term “open data” was excluded and the research criteria expanded to include years before 1990. This initial stage provided an overview over existing academic work on the topic, identified gaps in the literature, served for the formation of a theoretical framework for the study and guided the further research.
Stage 2: Data collection through secondary sources: After the review of existing literature and the selection of a theoretical framework for business modeling, relevant information was gathered on existing open data initiatives, projects and companies. This was conducted through search in the “Google” database in both English and German languages, including the respective language equivalents of keywords such as “open data”, “open data companies”, “open data firms”, “open data initiatives”, “open data projects”, “open data platforms”, “open data portal” etc. Through this initial search, sources of information relevant for the existing open data companies were identified, including:
Corporate websites and other corporate publications; Management and financial reports;
Business analyses conducted by business analysts, consultancy companies, governmental and other institutions;
27 The data collected was crucial for the identification of open-data-related companies and prospective interview partners, for gathering initial insights into the business models of open-data firms, and for observing initial patterns to be further confirmed during the expert interviews. Thus, the information obtained in Stage 2 served as a foundation for Stage 3. However, further information from secondary sources was also collected, used and re-examined during Stage 3, as to integrate both sources, and thus generate coherent and systematic conclusions.
Stage 3: Data collection through primary sources: In the last stage, primary data was collected through semi-structured interviews, which is considered to be an appropriate data-collection method for qualitative studies and also recommended in the case of exploratory studies (Saunders, Lewis & Thornhill, 2009). Some of the advantages of conducting interviews in addition to the information obtained through secondary sources included:
to explore questions for which information was lacking in other sources (e.g. the sources of the open data used by a particular company);
to get a deeper understanding of the explored research questions (e.g. the reasons behind various decisions such as using open data or choosing a specific organizational structure),
and to confirm the data from secondary sources first-hand.
In addition, when discussing the significance of establishing personal contact, as compared to other data-collection techniques from primary sources, Saunders, Lewis & Thornhill (2009, p.324) point out the following: “We have found that managers are more likely to agree to be interviewed, rather than complete a questionnaire, especially where the interview topic is seen to be interesting and relevant to their current work.” As (1) open data is a novel and exciting topic for German companies, (2) very relevant for the selected examples, and (3) the prospective study results were considered to be beneficial for the respondents, interviews were considered as one appropriate source of information.
Face-to-face contact was always preferred. Therefore, for companies based in Berlin, interviews were conducted through personal meetings. For all other respondents, telephone interviews were selected as a necessary approach, due to the geographical difficulty of conducting the interviews face-to-face. Saunders, Lewis & Thornhill (2009)
28
Saunders, Lewis & Thornhill (2009) outline some disadvantages of audio recordings, such as the possibility of a technical problem, the possibility of negatively affecting the respondents’ answers (because of knowing they are being recorded), and the time required to transcribe the interview. In addition, in the particular case of this study, some of the interviews had to take place in an environment where additional employees were located and would occasionally conduct short dialogues, which would have appeared on the recording, should such one have been conducted. These would not only have been irrelevant to the research but also would have constituted a privacy issue. Mainly for these reasons, audio recordings were not conducted. Instead, notes were taken with the help of a computer device. Due to the typing speed of the note-taker, all answers were possible to be recorded in detail. It was also considered of utmost importance to not only take notes but also to pay close attention to the respondent, to actively engage in the interview, to aim at discovering patterns, and to further ask for clarifications where such were needed or a topic needed to be explored in more depth.
The respondents were selected from companies currently reusing open data. For various reasons, such as the novelty of open data and the small size of some companies, the respondents occupied different positions. Especially in new start-ups with less than 5 employees, there existed no employees solely dedicated to open data. Therefore, respondents were not selected by their position, but rather based on the following criteria: The respondent occupies a high position in the company (having various meanings
among the various company structure);
He/She is involved in the daily operations related to the re-use of open data;
He/She is familiar with the company’s strategy in general and as related to open data, e.g. strategic open data plans, benefits for the company from the open data reuse, strategic development of the company and future plans etc.
A full list of the interviewees can be found in Appendix A.
The interviews were roughly oriented around 30 pre-defined questions. However, according to the specifics of each interview, in every case some questions were omitted while others were added or emerged during the interview itself, as recommended by
29
Stage 4: Data collection through the Snowball technique: By using the snowball technique researchers can identify cases relevant to the study which are not possible to discover otherwise. The technique is especially suitable when participants are part of the same social network (Hennink, Hutter & Bailey, 2011). This is the case in the current study, where companies do not always mention on their websites or in other secondary sources that they are active in the reuse of open data. Also, this information is often neither known by the publishers of open data (who are in most cases unaware of who is using their data), nor by analysts (to whom this information remains hidden unless the companies reveal it). Open data related companies, however, tend to have strong bonds between each other and to participate in the same networks, due to the fact that this brings mutual benefits for both sides. For this reason, the snowball technique was considered to be particularly useful for this research.
The process of the snowball is described by Hennink, Hutter & Bailey (2011, p. 100) as: … asking a study participant or a key informant whether they know anyone else in the community who meets the study criteria, and asking them to refer this person to the researcher; then, after interviewing the referred person, asking them whether they also know others in the community with the specific criteria, and so on.
Thus, interviewees were asked if they were aware of other companies involved in the reuse of open data. In almost all cases, such companies were immediately named. In most cases, these were already included in the research. However, in other cases the technique proved useful for identifying new respondents. A result of particular importance was a list of 200 companies, provided by one of the respondents, “Implisense”. The list was generated through the company-developed data analysis software and was used in this research.
30 3.4. DATA ANALYSIS
3.4.1. DEFINITION OF CASE-STUDY-BASED RESEARCH
Case studies are defined as: “an empirical inquiry that investigates a contemporary phenomenon within its real-life context when the boundaries between phenomenon and context are not clearly evident and in which multiple sources of evidence is used” (Yin, 1989, p.23). In other words, the researcher looks into a small number of entities in their natural environment and context (Johnston, Leach & Liu, 1999; Gibbert, Ruigrok & Wicki, 2008; Mora et. al. 2012) and uses multiple sources of evidence to study the complex interaction of multiple variables (Easton, 2010; Eisenhardt, 1989). This results in the description of so-called “case studies” used to draw conclusions for the selected topic. 3.4.2. REASONING BEHIND THE SELECTION OF A CASE STUDY STRATEGY
Case studies are often recommended for studying questions of “how”, for explorative studies and for topics on which academic literature is scarce. They are highly appropriate in the early stages of management research Gibbert, Ruigrok & Wicki (2008), which applies to open data business models. In addition, they are claimed to be a source of “ground-breaking insights” (Gibbert, Ruigrok & Wicki, 2008, p.1465) for the strategic management field, and are considered to be “likely to produce theory that is accurate, interesting, and testable” (Eisenhardt & Graebner, 2007, p.25-26). Unlike any other approach, they enable the researcher to go beyond studying variables in an isolated environment, and allow for the exploration of the dynamic context in which organizations live and thrive. Thus, they often produce results that cannot be discovered by other means. Lastly, the narrative way of description allows the reader to fully immerse in the story, making it not only a valuable contribution to academic literature, but also an interesting read.
3.4.3. SINGLE VERSUS MULTIPLE CASE STUDIES
Yin (1989) describes that the study of a single case is more appropriate when the case is revelatory, critical, extreme or unique. However, this study aims to investigate various opportunities for the reuse of open data by businesses - both typical and non-typical. Also,
Verschuren (2003) notes that single cases present considerable challenges for the researcher, such as the difficulty of creating a detailed analytical case, while also drawing generalizable conclusions from it. In contrast, using multiple cases enables the researcher to investigate if the findings of one case study are confirmed by the results of others
31 3.4.4. CASE STUDIES FORMULATION PROCESS
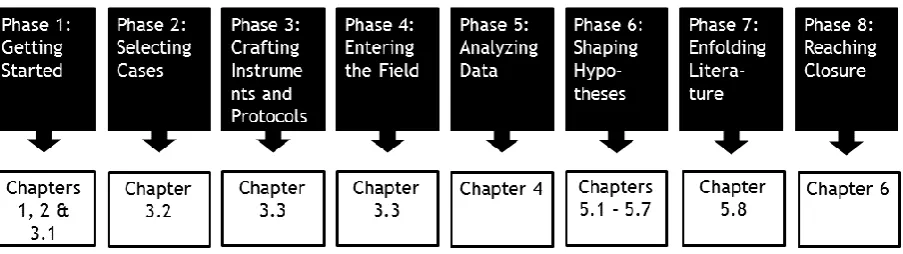
[image:31.595.76.528.330.457.2]The inductive case study approach provides the researcher with a high degree of freedom in regards to the process of cases’ formulation and analysis. It allows the researcher to adapt the study to the unique characteristics of the case at hand and to choose the most suitable structure for answering the predefined research question(s). In fact, it even allows for shifts in the research question during the research (Eisenhardt, 1989), for changes in the data collection methods (Benbasat, 1987), and does not require that the variables are specified in advance (Benbasat, 1987). Therefore, it can be regarded as a constant ongoing process of data collection, analysis and reformulation of emerging theory. In this study, the foundational theory of Eisenhardt (1989) in regards to building theory from case studies was used as a guideline for shaping the structure of the research. Short definitions of the process together with chapters relevant to each phase are presented below:
Figure 5: Case study process depiction
Phase 1: Getting Started: In this stage, the research question and sub-questions are formulated and the initial design of the research is shaped (Eisenhardt, 1989). During this initial stage, the broad topic of open data was selected and literature was reviewed in order to gain insights into the importance and potential of open data, the existing knowledge in the field and the current gap in theory. As a result, the central research question and sub-questions were formulated, and inductive, explorative, qualitative case study-based research was selected for investigating the questions. Academic literature dealing with similar studies was reviewed, as to lay the foundation for the research.
Phase 2: Selecting Cases: Here, the population is identified and the cases selected
(Eisenhardt, 1989). For the current research, the population consists of 31 private German companies, currently active in the commercial reuse of open data (described in §3.2).
32 selected, including the review of secondary sources, semi-structured interviews and obtaining information through the Snowball technique (described in detail in §3.3).
Phase 4: Entering the Field: This stage encompasses the often overlapping data collection and data analysis processes (Eisenhardt, 1989). Here, the collection of data was initiated and completed. During the process, data began to be distributed into categories, patterns began to emerge and initial theory began to shape. Each category and theory was reshaped according to new evidence. New categories were selected for emerging data that did not fit into the already developed structures. The data collection process is described in §3.3.
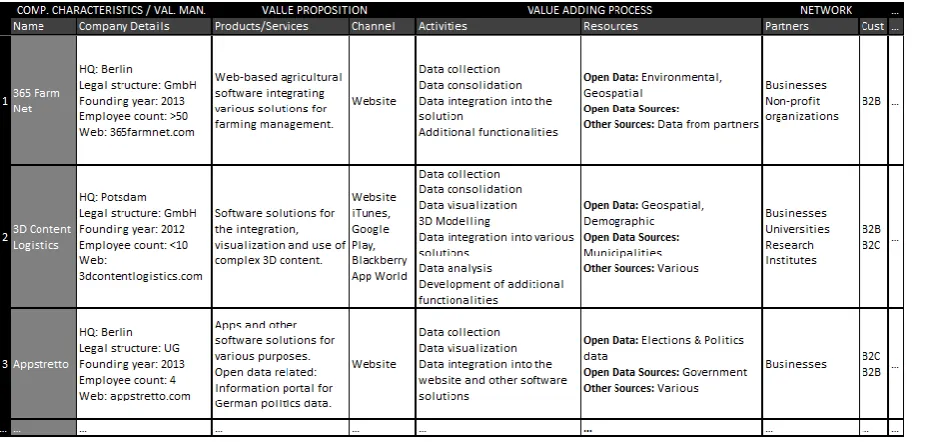
[image:32.595.70.526.537.759.2]Phase 5: Analyzing Data: During this phase the researcher looks first within every single case and then among the different cases, searching for patterns (Eisenhardt, 1989). Similar to the case of all other qualitative studies there is “no standardized procedure for analyzing such data” (Saunders, Lewis & Thornhill, 2009). In the current study, the Data Display & Analysis approach, developed by Miles & Huberman (1994) was used. The process consists of roughly three stages – 1) data reduction, 2) data display, and 3) drawing and verifying conclusions. In the beginning, the most relevant data for each case study was selected. The information gathered from the various data collection methods was unified, summarized and reduced, so as to clearly and briefly answer each of the research sub-questions for each case. For instance, for the research sub-question dealing with the value proposition of a firm, the data for each company was summarized into one to two clear sentences, conveying the main message. Then, the so reduced data was added into a table, where each row presented a specific company and each column referred to the specifics of one of the research sub-questions. The table had the following form:
[image:32.595.72.535.539.760.2]33 This represented the “data display” part of the process, described by Miles & Huberman (1994), during which the researcher visualizes the main results into a matrix, giving more clarity and providing comparability of the results. The information was initially entered into the table horizontally – each case was studied, in order to answer each of the research sub-questions. Simultaneously, the data began gain a clear structure, as categories were continuously developed and assigned, in order to describe various business model elements. For example, data related to public transport, routes, timetables and such was called “Transport data”. First, the specific cases were looked into, after which they were compared, in order to discover matching patterns across studies. The process was on-going, categories were constantly being added, deleted, changed or reshaped into sub-categories with the collection of new data and comparison of cross-case data. Miles & Huberman’s (1994) final stage, “drawing and verifying conclusions” relates to Eisenhardt’s (1989) stages 6 & 8, and will be described there.
In addition to the data reduction and display procedures of Miles & Huberman’s (1994)
analytical process, one more analytical method was used, recommended by Saunders, Lewis & Thornhill (2009) – the Narrative Analysis. In addition to the data collected being reduced and entered into a table, a more extended version, providing more in depth insight into the cases, was provided in the form of a Case study narrative. This aimed to complement the data display by adding information that cannot appear in the table, such as reasons behind using a certain business model element, relationships between such, the opinions of managers in regards to using one or another business model elements, etc. The use of more than one analytical approach was also done, in order to ensure the internal validity of the results.
Phase 6: Shaping Hypotheses: As a result of the data analysis, the researcher shapes the new theory. An important step was to ensure that no data collected was left out but that all results were included into the final results. The results were then described in §5.
Phase 7: Enfolding Literature: Eisenhardt (1989) strongly recommends that the reached conclusions are compared to both similar and contrasting results of other researchers. By doing this, both the internal and the external validity of the results are enhanced. Despite the scarce literature on the topic, such comparison was done and provided in §5.8.
34 3.4.5. OVERCOMING THE CHALLENGES OF THE CASE STUDY RESEARCH
As a result of its unique structure and process of theory formulation, the case study approach has been challenged in various ways by several researchers in the academic field. The first question concerns the reasoning behind choosing an inductive study approach
(Eisenhardt & Graebner, 2007). The researcher must be able to explain the reasons for the lack of existing theory and to overcome the underlying assumption that the research does not provide a valuable contribution (Eisenhardt & Graebner, 2007). In the current case, the scarce research is due to the novelty of open data and the short time period for researchers to generate theory. However, the large economic potential of open data points to the need for academic and practitioner involvement in the field and in the topic. Another challenge presented by Eisenhardt & Graebner (2007) concerns the inability of the multiple case study approach to describe the cases in their full richness and to include all the contextual data collected. Here, the researchers stress on the importance of developing extensive summary tables and other visual aids, in order to show the depth of the conducted research Eisenhardt & Graebner (2007). Therefore, important tables have been added in B and C, providing insight into the details of the data collected.
Another issue, pointed out by Flyvbjerg (2006), is also related to the richness of the data collected in case study research. Here the challenge concerns the difficulty of summarizing all the results into a comprehensive and relatively short case study narrative, and selecting which data to include and which to leave out. In addressing this challenge, careful consideration was taken into what should be included in each case study description. Only the most relevant information was included and a word limit of 1000 was considered for the narrative of each case.
Yet another argument related to the richness of data, mentioned by Eisenhardt (1989)