A Thesis Submitted for the Degree of PhD at the University of Warwick
http://go.warwick.ac.uk/wrap/49543
This thesis is made available online and is protected by original copyright.
Please scroll down to view the document itself.
by
Richard Anthony Tyson
Thesis
Submitted to the University of Warwick for the degree of
Doctor of Philosophy
Department of Systems Biology
List of Tables vi
List of Figures vii
Acknowledgments x
Declarations xi
Abstract xii
Abbreviations xiv
Chapter 1 Introduction 1
1.1 Eukaryotic Cell Motility . . . 1
1.1.1 Classical View of Actin Driven Protrusion . . . 2
1.1.2 Chemotaxis inDictyostelium . . . 4
1.1.3 Cellular Blebbing: The Role of Intracellular Pressure . . . 9
1.1.4 Blebbing inDictyostelium . . . 10
1.1.5 Cross-links Between Blebbing and Signalling to the Cytoskeleton 13 1.2 Motivation: Seeking Quantitative Data From Images . . . 14
1.3 Challenges and Tools for Extracting Numbers From Images . . . 16
1.4 Segmentation and Tracking . . . 17
1.4.1 The Deformable Model . . . 18
1.5 Tools for Mapping Cell Deformation . . . 19
1.6 Quantitative Imaging of Membrane Proteins (QuimP) . . . 22
1.7 Limitations of the QuimP2 Software . . . 24
1.8 Project Aim . . . 25
2.3.1 Sample Preparation . . . 31
2.3.2 Imaging . . . 31
2.3.3 Tracking Bleach Spots . . . 31
2.4 QuimP Software Implementation: Methods . . . 31
2.4.1 Motility and Morphological Measurements . . . 31
2.4.2 Definition of Fluorescence Statistics . . . 33
2.5 Blebbing Assays in Resistive Environments (Experiments by Evgeny Zatulovskiy) . . . 34
2.5.1 Strains . . . 34
2.5.2 Assays Under Agarose . . . 35
2.5.3 Imaging . . . 35
2.5.4 Image Pre-Processing . . . 35
2.6 Methods for Protrusion Analsysis . . . 36
2.6.1 Computing Peak Protrusion Speed . . . 36
2.6.2 Protrusion Rate . . . 37
2.6.3 Generating Line Segments for Protrusion Kymographs . . . 37
2.6.4 Correcting Overlapping Protrusion Tracks . . . 38
Chapter 3 Electrostatic Contour Migration Method : Tracking Cell Outlines 40 3.1 Calculating Electric Fields for Numerical Marker Migration . . . 40
3.2 Migrating Markers: A Simple Test Case . . . 41
3.2.1 Adaptation to Line Charges and Adjustable Field Density . . . . 42
3.3 Mapping Cell Outlines According to Intersections . . . 44
3.4 Comparison of ECMM to LSM: Elliptical Test Case . . . 46
3.5 Computational Scaling . . . 50
3.6 Correcting Sector Violations . . . 51
3.7 Tracking Markers throughout Sequences of Outlines . . . 53
3.8 Example ECMM Output . . . 55
Chapter 4 Validating ECMM: Photobleaching of Membrane Markers 57 4.1 Examining the Tracks of Bleached Membrane Markers . . . 58
4.2 Photobleaching of Membrane Patterns . . . 61
5.1.1 The BOA Active Contour . . . 67
5.1.2 Multi-Cell Segmentation . . . 67
5.1.3 Motility and Morphological Measurements . . . 69
5.2 Tracking Cell Deformation: ECMM Plug-in . . . 69
5.3 Sampling Fluorescence Intensities: ANA Plug-in . . . 69
5.3.1 Defining the Cortical Region . . . 70
5.3.2 Adaptation of ECMM for Intensity Sampling . . . 71
5.3.3 Fluorescence Statistics . . . 73
5.4 Compiling Data: QAnalysis Plug-in . . . 73
5.4.1 Building Spatio-Temporal Maps . . . 73
5.4.2 Tracking Positions through Spatio-Temporal Maps . . . 76
5.5 Software Implementation . . . 78
5.5.1 The BOA Segmentation Window . . . 79
5.5.2 ECMM Plug-in Output . . . 81
5.5.3 ANA and QAnalysis Parameter Settings . . . 81
5.5.4 Data Files and MATLAB Integration . . . 82
Chapter 6 Automated Analysis of Blebbing in Dictyostelium 83 6.1 Blebbing Assays in Resistive Environments (Experiments by Evgeny Zatulovskiy) . . . 83
6.1.1 Imaging and Strains . . . 84
6.2 Developing an Automated Protrusion Analysis . . . 84
6.2.1 Image Pre-Processing and Segmentation . . . 85
6.2.2 QuimP Output . . . 87
6.2.3 Defining Protrusion Paths and ECMM Tracks . . . 87
6.2.4 Manual Generation of Protrusion Tracks . . . 87
6.2.5 Profiles and Measures of Protrusion . . . 89
6.2.6 Kymograph Analysis and Quantifying Actin Scar Disassembly . 93 6.2.7 ECMM Automated Protrusion Tracking (ECMM-APT) . . . 94
6.3 Analysis of Protrusion Tracks . . . 98
6.3.1 Ax2 Manually Generated Protrusion Tracks . . . 98
6.3.2 Ax2 ECMM-APT Generated Protrusion Tracks . . . 99
6.3.3 ECMM-APT Performance . . . 100
6.3.4 Three Classes of Protrusion in Wild TypeDictyostelium . . . 102
6.3.8 Blebs Nucleate at the Flanks During Chemotaxis . . . 109
6.3.9 Protrusion and Blebbing Deficiencies in Mutant Strains . . . 109
Chapter 7 QuimP Applications 115 7.1 Study of Ras1 Signalling inSchizosaccharomyces pombe . . . 115
7.2 Cycles of Protrusion/Retraction in Four Dimensional Data . . . 117
7.3 Localisation of Dishevelled in the Gastrulating Mesoderm of Xenopus . 117 7.3.1 Data and Initial Analysis . . . 119
7.3.2 Measure of Proportional Membrane Fluorescence . . . 120
7.3.3 Peak Analysis of Fluorescence Profiles . . . 120
7.3.4 Conclusion . . . 124
Chapter 8 Discussion 126 8.1 ECMM: A Simple, High Speed Method for Quantifying Deformation . . 126
8.2 ECMM in Light of Bleach Markers . . . 127
8.3 Mechanisms of Blebbing in Dictyostelium . . . 128
8.3.1 ECMM-APT Provides a Global View of Protrusion . . . 128
8.3.2 Biological and Measurement Sources of Variability in Actin Scar Disassembly Half-Life . . . 130
8.3.3 Retrograde Shift of the Actin Scar Caused by Cortex Contraction 131 8.3.4 Effects of Membrane Curvature on Blebbing . . . 131
8.3.5 How Blebbing is Directed to the Flanks . . . 136
8.3.6 Reduced Blebbing in Pikl and PI3K Mutants Due to Disrupted Chemotaxis . . . 137
8.3.7 Furthering the Analysis of Blebbing . . . 138
8.4 QuimP Software Applications and Outlook . . . 139
Chapter 9 Conclusions 142 Appendix A Automated Protrusion Analysis 144 A.1 Protrusion Tracking . . . 144
A.1.1 Path Resolution Reduction . . . 144
A.1.2 Decision Tree Determining the Cutting of Protrusion Paths . . . 145
A.2 Results Tables: Ax2 Manually Generated Protrusion Tracks . . . 147
A.2.1 Protrusion Counts: Manual . . . 147
A.3.2 Protrusion Measures: ECMM-APT . . . 150
A.4 Results Tables: Mutant ECMM-APT Tracks . . . 151
A.4.1 Average Global Measures . . . 151
A.4.2 Mutant ECMM-APT Protrusion Measures . . . 151
A.5 Relative Error . . . 152
A.6 Coefficient of Determination . . . 152
6.1 Protrusion categorisation . . . 88
6.2 Ax2 manually generated protrusion tracks . . . 98
6.3 Ax2 ECMM-APT generated protrusion tracks . . . 99
7.1 Cell categorisation by protrusive behaviour . . . 119
A.1 Manually traced protrusions in Ax2 cells . . . 147
A.2 Measures from manually traced protrusions in Ax2 cells . . . 148
A.3 ECMM-APT protrusions in Ax2 cells . . . 149
A.4 Measures from ECMM-APT protrusions in Ax2 cells . . . 150
A.5 Average global measures for Ax2 and mutant cells. . . 151
A.6 Mutant ECMM-APT protrusion counts . . . 151
1.1 Caricature of Dictyostelium polarising in response to cyclic AMP . . . . 7
1.2 Two channel fluorescence and DIC sequence ofDictyosteliuminduced to bleb . . . 11
1.3 Bleb and pseudopodia kymographs: visualising cortex dynamics . . . 12
1.4 Mapping outline Γtto Γt+1, via normals . . . 21
2.1 Construction and evolution of the level set . . . 29
2.2 Evolving ΓT to converge at ΓT+1 . . . 30
2.3 Background correction within spinning disk microscopy images . . . 36
2.4 ECMM-APT: Diagrammatic examples of correcting overlapping tracks . 39 3.1 Defining quantities for a line charge . . . 40
3.2 Comparison of point charge and line charge implementation on a simple test case . . . 43
3.3 Electrostatic Contour Migration Method (ECMM). . . 45
3.4 Evaluation of ECMM and LSM using an elliptical test case . . . 47
3.5 Example cell boundary mapping with LSM and ECMM . . . 48
3.6 ECMM computational scaling . . . 50
3.7 Test cases for sector construction . . . 52
3.8 ECMM marker tracking using decimal positions . . . 54
3.9 Example ECMM sequence . . . 56
4.1 Example photobleaching of membrane markers in Dictyostelium. . . 59
4.2 Photo-toxicity during photobleaching . . . 60
4.3 A comparison of ECMM mappings and tracked bleach spots . . . 62
4.4 Applying a bleach pattern to quantify movement of the membrane . . . 63
5.1 Flow diagram outlining the software structure . . . 66
5.5 Tracking positions through spatio-temporal maps . . . 77
5.6 Tracking positions backward using position and origin maps . . . 78
5.7 Launching plug-ins: the QuimP bar . . . 79
5.8 The BOA segmentation window . . . 80
5.9 ECMM output display . . . 81
5.10 ANA & QAnalysis input dialogs . . . 82
6.1 Marker speeds at stationary membrane locations . . . 85
6.2 Example QuimP analysis of a blebbing Ax2 Cell . . . 86
6.3 Manual tracing of wild type Ax2 protrusions . . . 88
6.4 Compiling data from tracks: example protrusions from Figure 6.3 . . . . 90
6.5 Measuring peak protrusion speed from displacement profiles . . . 91
6.6 Bleb path and kymograph line profile . . . 93
6.7 Constructing displacement maps using ECMM tracking data . . . 95
6.8 ECMM automated protrusion tracking (ECMM-APT) . . . 97
6.9 Plot of manual versus ECMM-APT determined peak protrusion speeds in Ax2 cells (4.16 fps) . . . 101
6.10 Scatter plots of peak speed versus displacement in Ax2 cells . . . 103
6.11 Three classes of protrusion in Ax2 cells . . . 104
6.12 Scatter plots of curvature in Ax2 cells . . . 106
6.13 Scatter plots of peak speed versus drop in GFP-ABD fluorescence in Ax2 cells . . . 108
6.14 Example bleb kymographs and scar disassembly half-life . . . 110
6.15 Distribution of Ax2 protrusions relative to the leading edge . . . 111
6.16 Analysis of mutant strains using ECMM-APT . . . 112
6.17 ECMM-APT false positive resulting from movement through the z-axis 113 7.1 Ras1 mutants show reduced percentage membrane fluorescence . . . 116
7.2 QuimP analysis of motile cells using z-stack data . . . 118
7.3 Character of convergent extension in anXenopus embryo . . . 119
7.4 Analysis of Xdsh localisation: domain proportional fluorescence . . . 121
7.5 Analysis of Xdsh localisation: proportional domain membrane fluorescence122 7.6 Locating clusters of Xdsh within QuimP fluorescence maps . . . 123
7.7 Average number of Xdsh membrane clusters within domains . . . 125
I wish to thank the following people without whom this thesis could not have been completed.
First and foremost, I offer my sincerest gratitude to my supervisor Till Bretschnei-der, who’s time, knowledge, and guidance was pivotal in all work presented herein, and also to Kurt Anderson who made the wet side of this project possible.
Many thanks to Ireen K¨onig, Margaret O’Prey, Michael Carnell, for teaching me the intricacies of confocal microscopy, and all things Dictyostelium. Much gratitude to David Epstein for his probing mind and development of key ideas for the creation of ECMM. My foremost collaborators, Wayne Croft, Eleni Panousopoulou, Jeremy Green, Evgeny Zatulovskiy and Robert Kay all played vital parts. Evgeny Zatulovskiy in particular has proved himself a hard working and talented scientist, producing quality data for analysis.
Many thanks to my group colleagues Mike Downey, Chengjin Du, Sarah Cosgriff, and Ingrid Tigges for input, discussion, and software testing. My advisory commit-tee; Dr Graham Ladds, Silvester Czanner, Keith Vance, and Markus Kirkilionis. The Systems Biology DTC staff, past and present, and DTC directors Vicky Buchanan Wollaston and Alison Rodger. The 2007 DTC cohort, and now firm friends, Richard Hickman, Wayne Croft, Steven Kiddle, Heather Riley, Max Joseph, Matt Bano, Eliz-abeth Widman, Robert Gardner, Polly Downton, Darren Braddick, and Carl Blakey, who sadly is no longer with us.
Finally, I could not have gotten as far as I have without the support of my family, Clive, Janice, Justin, Mark, and my partner Bryony.
This list is far from exhaustive, so I wish to thank those people not mentioned who’s contributions have not been forgotten.
The implementation and distribution of QuimP is made possible by the excellent, and free image processing tool, ImageJ. This thesis was typeset with LATEX 2ε1.
1LATEX 2ε is an extension of LATEX. LATEX is a collection of macros for TEX. TEX is a trademark of
This thesis is presented in accordance with the regulations for the degree of Doctor
of Philosophy. It has been composed by myself and has not been submitted in any
previous application for any degree. The work in this thesis has been undertaken by
Cell motility plays an important role throughout biology, the polymerisation of actin being fundamental in producing protrusive force. However, it is increasingly apparent that intracellular pressure, arising from myosin-II contraction, is a co-driver of motility. In its extreme form, pressure manifests itself as hemispherical protrusions, referred to as blebs, where membrane is torn from the underlying cortex. Although many components and signalling pathways have been identified, we lack a complete model of motility, particularly of the regulation and mechanics of blebbing. Advances in microscopy are continually improving the quality of time series image data, but the absence of high-throughput tools for extracting quantitative numbers remains an analysis bottle-neck. We develop the next generation of the successful QuimP software designed for automated analysis of motile cells, producing quantitative spatio-temporal maps of pro-tein distributions and changes in cell morphology. Key to QuimP’s new functionality, we present the Electrostatic Contour Migration Method (ECMM) that provides high resolution tracking of local deformation with better uniformity and efficiency than rival methods. Photobleaching experiments are used to give insight into the accuracy and limitations of in silico membrane tracking algorithms. We employ ECMM to build an automated protrusion tracking method (ECMM-APT) sensitive not only to pseudopo-dia, but also the complex characteristics of high speed blebs.
QuimP is applied to characterising the protrusive behaviour of Dictyostelium, induced to bleb by imaging under agar. We show blebs are characterised by distinct speed-displacement distributions, can reach speeds of 4.9µm/sec, and preferentially form at the flanks during chemotaxis. Significantly, blebs emerge from flat to concave membrane regions suggesting curvature is a major determinant of bleb location, size, and speed. We hypothesise that actin driven pseudopodia at the leading edge induce changes in curvature and therefore membrane tension, positive curvature inhibiting blebbing at the very front, and negative curvature enhancing blebbing at the sides. This possibly provides the necessary space for rear advancement. Furthermore, bleb kymographs reveal a retrograde shift of the cortex at the point of bleb expansion, sug-gesting inward contractive forces acting on the cortex even at concave regions. Strains deficient in phospholipid signalling show impaired chemotaxis and blebbing.
Resolution Tracking of Cell Membrane Dynamics in Moving Cells: an Electrifying Approach. Mathematical Modelling of Natural Phenomena, Vol. 5, No. 1, pp. 34-55.
− E Zatulovskiy, R A Tyson, T Bretschneider, R R Kay. Working title: Blebbing is an important driver of Dictyostelium discoideum chemotaxis. In preparation.
− E Panousopoulou, R A Tyson, T Bretschneider, J B A Green. Working title: Dsh intracellular localisation in convergent extension is not a marker of polarity. In preparation.
Oral and Posters Presentations
− Invited oral presentation. Actin 2009, Bristol.
− Poster presented. 10th International Conference on Systems Biology, Edinburgh, 2010.
− Poster presented. Actin 2010, Bristol.
The QuimP11 Software
The QuimP software package is provided on the accompanying CD, but can also be downloaded at:
ABD Actin Binding Domain.
ABP Actin Binding Protein.
ADF Actin Depolymerising Factor.
ADP Adenosine Di Phosphate.
Akt/PKB Serine/threonine protein kinase, otherwise known as protein kinase B.
AMP Adenosine monophosphate.
ARP Actin Related Protein.
ATP Adenosine tri phosphate.
cAMP Cyclic adenosine monophosphate.
cGMP Cyclic guanosine monophosphate.
cARs Cyclic Adenosine monophosphate receptor.
CRAC Cytosolic regulator of adenylyl cyclase.
CT Computational time.
DP Decimal position. A decimal value in the range [0,1) representing the position of
a marker on a length normalised cell outline.
DIC Differential Interference Contrast Microscopy.
ECMM Electrostatic Contour Migration Method. Our computer algorithm for mapping
one cell outline to another.
ERM Ezrin-radixin-moesin.
F-actin Filamentous-actin.
FN Failed node.
FSM Fluorescent speckle microscopy.
Fi Frame interval. Time interval (seconds) between frames in an image sequence.
FRAP Fluorescence recovery after photobleaching.
Gbp cGMP-binding protein.
G-protein Guanine nucleotide-binding proteins.
GMP Guanosine monophosphate.
GTP Guanosine triphosphate.
GTPase Guanosine triphosphate kinase.
ID Identifier. An integer label for tracking markers.
IKK Inhibitor Kappa B Kinase: phosphorylation and ubiquitination of the IκB
pro-teins.
LEGI Local excitation & global inhibition.
M2 Melanoma cell line.
MHC Myosin heavy chain.
MO Marker origin. A decimal value in the range [0,1), representing the position a
marker originated from on the outline at the previous frame.
MRC Medical Research Council.
NF-κB Nuclear factor kappa-light-chain-enhancer of activated B cells
NPF Nucleation promoting factor
ODE Ordinary differential equation.
PCP Planar cell polarity.
PDE Partial differential equation.
PH domain Pleckstrin homology domain.
PKB Protein kinase B.
PR Protrusion rate.
PTEN Phosphatase and tensin homolog.
QuimP Quantitative Imaging of Membrane Proteins. Title given to the software
devel-oped by Dr. T.Bretschneider.
Rac1A Rac-related C3 botulinum toxin substrate 1.
Ras RAt sarcoma.
RasGEFs Ras guanine nucleotide exchange factors.
RITC-Dx Rhodamine-B-isothiocyanate-dextran.
SD Standard deviation.
Introduction
1.1
Eukaryotic Cell Motility
Motility in eukaryotes is vital for many biological processes, for example, orchestrating embryogenesis, targeting epithelial cells to wounds, the inflammatory response, and organisation of brain neurones [Ilic et al., 1995; Kim et al., 1998; Frangogiannis et al., 2002; Rakic et al., 1994]. Mis-regulation can result in inflammatory diseases, osteoporo-sis, multiple scleroosteoporo-sis, and mental retardation [Dellas and Loskutoff, 2005]. Motility is tightly linked with metastasis; mutations in components for directional sensing are frequent in human cancers [Iijima and Devreotes, 2002; Chalhoub and Baker, 2009].
Early models of eukaryotic motility were based on observations in plants and fungi. They each rely on close control of cell osmolarity, membrane tension, and hy-drostatic pressure to produce the driving force for processes such as growth, stomatal oscillations, and spore dissemination [Proseus et al., 2000; Fischer et al., 2004]. Similar processes were thought important in motility of plasmodial slime moulds.
The importance of regulating intracellular pressure took a back seat given the advances made in the study of actin and its role in driving motility [Tilney, 1975]. Actin is a globular monomer capable of polymerising into dense, branched networks of semi-flexible filaments. Filamentous-actin (F-actin) is a major component of the cell cytoskeleton, providing structural rigidity, but it is the rapid assembly and disassembly of filaments which is considered the dominant mechanism in providing force to deform the plasma membrane [Pollard and Borisy, 2003]. Actin allows cells to co-ordinate and locally regulate cellular protrusions for both random and directed movement in the form of cell crawling, a process of which plants and fungi are incapable.
soil or densely packed tissues, which impose greater resistance. Blebbing, an alternate form of protrusion, exploits intracellular hydrostatic pressure to drive forwards patches of membrane that have become detached from the underlying supporting cortex. This produces highly distinct hemispherical protrusions that extend at high speed and leave actin scars, not observed in actin driven protrusions [Langridge and Kay, 2006].
We will outline the classical view of actin driven motility and the complexities of regulation in directed movement (chemotaxis) in Dictyostelium discoideum. We introduce blebbing within this context as a relatively poorly understood process.
1.1.1 Classical View of Actin Driven Protrusion
Cell crawling is generally considered a four step process: 1) protrusion of the leading edge; 2) substrate adherence; 3) retraction of the cell rear; 4) de-adherence [Pollard and Borisy, 2003]. Actin and myosin are key players, providing force and structural integrity. Short, branched F-actin forms a narrow layer beneath the plasma membrane called the cortex, while longer filaments (in concert with microtubules) maintain overall cell shape [Inou´e and Salmon, 1995; Svitkina and Borisy, 1999]. Remodelling of F-actin networks by actin binding proteins, and motor proteins (such as myosin-II) underpins cell movement.
Actin was first isolated from smooth muscle. Actin and myosin filaments form networks for the transduction of contraction force [Aguilar and Mitchell, 2010]. The dominant myosin, myosin-II, is a hexamer containing two heavy chains (MHC) and two pairs of light chains (MLC). The C-terminals of MHC intertwine to form a filamentous tail. N-terminals form a globular head with an actin-binding domain, and is the site of ATP hydrolysis. The regulatory light chain (mlcR) binds the neck between tail and head, and its phosphorylation causes a change in angle, moving the head along the actin filament (the power stroke) and activating ATP hydrolysis to slide filaments and contract the network. The essential light chain (mlcE) likely functions to stabilise the structure and regulate contraction [Hernandez et al., 2007].
the general acceptance that actin filaments must contact the membrane and force it outwards by polymerisation, as proposed years earlier by Tilney [1975]. It is now ap-preciated that actin polymerisation is employed by bacteria for intracellular rocketing, virus motility, and mediation of endocytosis [Tilney et al., 1992; Frischknecht et al., 1999; Kaksonen et al., 2006].
Fish keratocytes form a large, flat structure at their fronts, dense with actin, termed lamellipodia [Atilgan et al., 2006]. Organisms such as amoeba, extend more temporary protrusions termed pseudopodia. At the rear, actin and myosin form a con-tractile network that pulls the cell’s rear along. In synchronisation with protrusion and retraction, cells form focal adhesions to the substratum, anchor points for mechanical force transmission and signalling. New adhesions are formed at the front by the clus-tering of membrane integrins, while rear adhesions are broken by myosin contractions and proteins involved in adhesion turn-over at the front (e.g. FAK and Src) [Ridley et al., 2003].
ATP-bound actin monomers (ATP-actin) arrange head to tail, imposing a polar-ity [Small et al., 1978]. Photobleaching and speckle microscopy reveal a treadmilling of monomers, in which they are rapidly added to the barbed end pointing towards the membrane, while dissociating from thepointedend [Fujiwara et al., 2002]. ATP hydrol-ysis is not required for polymerisation, but acts as a timer for filament disassembly [Pol-lard and Borisy, 2003]. The actin-related proteins 2 and 3 (Arp2/3) nucleate branched filaments at approximately 70 degrees (thought dependent on filament length) [Mullins et al., 1998; Goley and Welch, 2006], and the capping protein terminates growth by binding filament ends [Cooper and Schafer, 2000]. Two questions remain unanswered; how do filaments apply force to the membrane, and how do they grow rapidly given the slow rate of treadmilling of pure actin in vitro [Fujiwara et al., 2002].
Polymerisation is diffusion limited, but exceeds rates possible in steady state. In cells, the protein profilin binds monomers to accelerate association at the barbed end. Binding prevents both association to the pointed end, and spontaneous nucleation of new filaments. The pool of free monomers is maintained by ADF/cofilin severing and disassembling older ADP-actin filaments, profilin catalysing the exchange of ADP for ATP, and the capping protein limiting network density.
As a nucleator of branched filaments, Arp2/3 is a pivotal target for regulation of protrusion extension, as demonstrated by disruption having multiple detrimental effects on motility and development [Vartiainen and Machesky, 2004]. Arp2/3 requires activation by forming a complex with nucleation promoting factor (NPF) proteins, in-creasing the affinity for ATP, and transformation to an active confirmation (reviewed by Goley and Welch [2006]). NFPs are classified into two groups, containing multiple members, but the most well studied are the eukaryotic class I Wiskott-Aldrich syn-drome protein (WASP), and suppressor of cyclic AMP repressor (SCAR; also called WAVE). As will be discussed in the next section, the NFP proteins are activated by upstream signal-transduction pathways that co-ordinate actin polymerisation spatially and temporally. Interestingly, Arp2/3 appears autocatalytic, increasing the rate of nucleation in proportion to the number of filaments [Pantaloni et al., 2000], aiding an explosive rate of polymerisation.
Predictably, Arp2/3 is not the lone nucleator of filaments. Formin and spire proteins nucleate linear filaments, important for filopodium formation, and represent further targets for regulation [Kovar, 2006; Baum and Kunda, 2005]. Cofilin is also tightly regulated and is thought to act synergistically with Arp2/3 to amplify poly-merisation. Cofilin exposes barbed ends as it severs filaments, and therefore promotes growth of new filaments, to which Arp2/3 preferentially binds [DesMarais et al., 2005].
1.1.2 Chemotaxis in Dictyostelium
First observed in bacteria, chemotaxis is the process by which cells migrate along a ex-tracellular chemical gradient. This requires sensing of the environment, determination of direction, and establishment of a front and rear (polarisation) [Insall, 2010].
Dictyostelium responds to many chemoattractants (e.g. folic acid, platelet acti-vating factor, lysophosphatidic acid) [Chen et al., 1996], the most well studied being the response to cyclic adenosine monophosphate (cAMP). When starved of food, Dic-tyostelium secretes cAMP, inducing cAMP production by neighbouring cells, and ag-gregation into a multicellular pseudoplasmodium (or slug) in preparation for forming a fruiting body and sporulation [Bonner, 1947; Konijn, 1972; Gerisch, 1982]. Studies us-ing GFP labellus-ing reveal that, in response to cAMP, molecular cytoskeletal remodellers and transduction components, such as actin, coronin, and cofilin, became asymmet-rically distributed within the gradient [Gerisch et al., 1995; Kreitmeier et al., 1995; Gottwald et al., 1996; Aizawa et al., 1997; Parent et al., 1998], polarising the cell.
1.1.2.1 History of Directional Sensing
Sensing and transduction of chemoattractant signals utilise surface receptors coupled to components of G-protein linked pathways. Binding of attractants to receptors such as cAR (cAMP receptor), causes dissociation of G-proteins intoGαandGβγ subunits. Cells lacking theGαor uniqueGβsubunit are unable to respond to cAMP, as are cells lacking receptors [Kesbeke et al., 1988; Wu et al., 1995b; Chen et al., 1996]. Initially, cells were thought to process chemoattractant signals in much the same way as bacteria, responding to changes in receptor occupancy as they migrate, effectively continually sampling the local gradient [Koshland, 1977]. However, earlier work by Gerisch and Keller [1981] showed that Human granulocytes, could spontaneously extended lamel-lipodia towards a chemoattractant source, even when previously immobile. Further-more, papers by Xiao et al. [1997], Servant et al. [1999] and Parent and Devreotes [1999] removed the possibility of polarisation being the result of unevenly distributed receptors, or Gβγ, by observing even GFP signals at the membrane. Hence, cells are able to differentiate tiny differences in concentration between front and back, perhaps as little as 2%, when stationary.
1999].
Similarly, other PH domain containing proteins, such as the signal transducer Akt/PKB, transiently associate with the membrane on chemoattractant stimulation [Meili et al., 1999], and many Rho family members (specifically small GTPases Rac, and cdc42), are known to mediate actin remodelling and contain PH domains. The PH domain, consisting of a bentβ-sheet and a C-terminalα-helix, binds to phosphory-lated inositol lipids such as phosphatidylinositol 3,4,5-trisphosphate (PtdIns(3,4,5)P3)
[Saraste and Hyv¨onen, 1995]. This has led to the formulation of the local excitation-global inhibition in which PtdIns(3,4,5)P3 distribution acts as a cellular compass,
am-plifying signals from receptors.
1.1.2.2 PtdIns(3,4,5)P3 as a Cellular Compass
In this model, local peaks in PtdIns(3,4,5)P3 correlate with sites of new F-actin
for-mation [Insall and Weiner, 2001] and act as binding sites for cytoskeletal remodellers and effectors, hence determining the location of pseudopodia nucleation [Parent and Devreotes, 1999]. PtdIns(3,4,5)P3 metabolism is determined by two classes of
pro-teins; type-1 phosphoinositide-3-kinases (PI3Ks), of which 5 are known to exist in Dic-tyostelium, that phosphorylate phosphatidylinositol 4,5-trisphosphate (PtdIns(4,5)P2)
to generate PtdIns(3,4,5)P3 [Hoeller and Kay, 2007], and phosphatase and tensin
homolog (PTEN) that catalysis the reverse reaction, generating PtdIns(4,5)P2
[Fu-namoto et al., 2002]. PI3K and PTEN amplify the directional signal to form peaks in PtdIns(3,4,5)P3 at the membrane. PI3K transiently locates to the leading edge in
chemotaxing cells, while PTEN exhibits the reciprocal pattern, dissociating from the leading edge, but remaining membrane bound at the rear [Funamoto et al., 2002]. The directional signal originates at the level of receptors. Those higher in the gradient are transiently activated slightly more frequently than those further down the gradient [Janetopoulos et al., 2001]. In turn, this creates a small asymmetric distribution of dissociated G-protein subunits, subsequently amplified by PtdIns(3,4,5)P3 metabolism
(Figure 1.1).
The second part of the model hypothesises a global inhibitory response, deter-mined by the average occupancy of receptors, that exceeds the excitatory response at the rear [Devreotes and Janetopoulos, 2003]. A candidate for this roll is the fast diffusing, cytoplasmic signalling molecule, cyclic GMP (cGMP), which is produced in response to cAMP binding. Although transiently active, cGMP is known to mediate phosphorylation of myosin-II chains [Bosgraaf et al., 2002].
chemoattrac-Figure 1.1: Caricature of Dictyostelium polarising in response to cyclic AMP. Dictyostelium response to a gradient of extracellular cyclic AMP by polarising in the direction of the source, nucleating actin-polymerisation at the front to form protru-sions, and activating myosin-II to contract the rear. A cyclic AMP gradient, as small as 1% between front and back, is amplified to produce a asymmetric distribution of PtdIns(3,4,5)P3. Transient binging of cyclic AMP to the G-couple transmembrane
receptor cAR1 occurs at a greater rate at the front, producing a small asymmetric dis-tribution of dissociated G-protein βγ-subunits. Subsequently, PtdIns(3,4,5)P3 levels
are increased by activation of PI3Ks (via RasG/C), and dissociation of PTEN from the membrane. F-actin nucleation and remodelling proteins are localised to the leading edge by binding of PH domains to PtdIns(3,4,5)P3. G-protein activation at the rear is
[image:26.595.113.518.102.520.2]tants, and G-protein β subunit mutants, hence directing random movement [Sasaki et al., 2007]. Inhibiting F-actin formation can destroy these gradients, suggesting that peaks in PtdIns(3,4,5)P3 can be sustained by positive feedback loops. Patches of
PtdIns(3,4,5)P3 also form spontaneously in uniform cAMP [Sasaki et al., 2007].
Fur-thermore, Arai et al. [2010] recently observed self-organised waves of PtdIns(3,4,5)P3
around the cell circumference (with periodicity of ≈ 200s) accompanied by opposing waves of PTEN. Waves are not affected by treatment with latrunculin (inhibition of actin polymerisation), but functioning PTEN and PI3Ks are essential. Similarly, actin waves have also been observed, and assumed to be linked to the generation of random movement [Vicker, 2002; Bretschneider et al., 2004].
Sasaki et al. [2007] showed that the apparent feedback loop created by F-actin was dependent on Ras, a subfamily of the Ras small GTPase superfamily. Dictyosteliumhas 15 identified Ras proteins that function as signal transducers [Rivero and Somesh, 2002]. They can exist in either an active GTP-bound, or inactive GDP-bound state. Ras states are switched by guanine nucleotide exchange factors (RasGEFs) which are activated by G-protiens in the cAMP response, and can act on a wide range of Ras proteins [Kae et al., 2007]. Not only do both Type-I PI3Ks and PTEN contain Ras binding domains (RBD), but Ras is seen to localise to the leading edge [Sasaki et al., 2004]. Knocking out any one Ras protein has little effect on chemotaxis, but removal of the Ras proteins RasG and RacC (or RasG and the RasGEF aimless) completely abolishes chemotaxis towards cAMP [Tuxworth et al., 1997; Sasaki et al., 2004; Bolourani et al., 2006]. Hence, Ras proteins provide the link to G-protein activation during the cAMP response, but their wide range of targets also suggests involvement of Ras proteins in the absence of chemoattractants and PtdIns(3,4,5)P3 gradients.
The role of PtdIns(3,4,5)P3 in random migration appears to be the result of
self-organising properties. Interestingly, Hoeller and Kay [2007] showed thatDictyostelium lacking all five PI3Ks and PTEN, which are unable to form PtdIns(3,4,5)P3 gradients,
can still undergo effective chemotaxis, although they are severely impaired without a strong gradient.
1.1.2.3 Chemotaxis In The Absence of PtdIns(3,4,5)P3
Genetic screens of cells with inhibited PI3Ks identified phospholipase A2(PLA2) as
independently of PtdIns(3,4,5)P3 at the leading edge by RasC and the RasGEF
aim-less [Kamimura et al., 2008; Charest et al., 2010]. More perplexing is that knocking out PI3Ks, PLA2 and TORC2 pathways still does not obliterate chemotaxis in 7 hour starved cells [Veltman et al., 2008]. Soluble guanylyl cyclase (sGC) locates to the front and interacts with F-actin, driving chemotaxis, while its product, cGMP, re-localises to the rear and directs myosin-II contraction by activation of GbpC [Bosgraaf et al., 2005; Veltman et al., 2008].
Current observations point to parallel pathways in the chemotaxis network, each containing multiple redundant components [Chen et al., 2007]. Lipids act as universal regulators with both specific and non-specific PH domain binding [Balla, 2005]. Signal transducers, like RasGEFs, can have multiple targets, but also bind specifically, as in the case of RasC [Kae et al., 2007], and can act upstream or downstream of lipid regulation, or even completely independently. Furthermore, the motility machinery contains both feedback mechanisms and inherent self-organising properties, allowing dynamic control and random movement [Th´ery et al., 2006; Ji et al., 2008]. Typically, motility mechanisms respond on time scales far in excess of gene regulation and protein turnover, and therefore require complex activation and deactivation of pathways in response to signals. Signals may be chemical or mechanical forces (such as forces generated from fluid flow [Dalous et al., 2008]).
1.1.3 Cellular Blebbing: The Role of Intracellular Pressure
Trinkaus [1973] demonstrated that Fundulus deep cells were able to migrate through the tightly packed tissue of a developing embryo by expanding large, bubble like protru-sions from their surface, structures referred to as blebs. The forces produced by actin polymerisation are considered to be insufficient to overcome the extracellular pressures of resistive environments, resulting in the branched F-actin network becoming deformed as opposed to producing forward motion. It appears that blebbing provides an alter-native mechanism that can overcome these larger resistive forces. As such, blebbing is a key mode of migration forDictyostelium. Dormann and Weijer [2006] showed its im-portance at the multicellular slug stage of theDictyostelium life cycle, where blebbing was significantly increased over other stages.
basic mechanics, namely the induction of intracellular pressure via the contraction of the actomyosin cytoskeleton [Wessels et al., 1988; Chen et al., 1995; Maugis et al., 2010], followed by either rupture of the cortex [Paluch et al., 2005], or breakage of adhesion at the cortex-membrane interface [Dai and Sheetz, 1999].
1.1.4 Blebbing in Dictyostelium
Figure 1.2 shows the typical formation of blebs inDictyostelium migrating under agar (courtesy of Evgeny Zatulovskiy, MRC laboratory, Cambridge). Labelling of F-actin reveals a densely fibrous actin cortex at the rear which is contracted by association with myosin-II [Torgerson and McNiven, 1998; Hagmann et al., 1999], reducing the cell’s volume and increasing intracellular fluid pressure [Janson and Taylor, 1993; Charras and Paluch, 2008]. Pressure is the driving force behind blebbing, similar to the primary method of motility in plants and fungi [Charras et al., 2005], but it is the supporting actin cortex and its adherence to the plasma membrane via lipid binding that provides the structural rigidity to build pressure [Raucher et al., 2000]. The actin cortex may also act as an elastic material, storing energy from myosin contraction [Tinevez et al., 2009].
Blebbing can be inhibited by disrupting the action of myosin-II, for example, by treatment with the myosin-II ATPase blocker, blebbistatin, or disruption of the essential light chain [Cunningham, 1995; Chen et al., 1995; Cheung et al., 2002]. Further to this, Dictyostelium myosin-II knockouts stall in the tip-less mound developmental stage, suggesting that myosin-II has a key role in driving blebs essential for development [Carrin et al., 1996]. (However, some blebs have been shown to form independently of actomyosin contraction; necrotic blebs rely on influx of ions and water, but grow over a slow period of 10 min [Bovellan et al., 2010]).
Pressure within the cell is experienced in its majority by the plasma membrane, rather than the permeable cortex. Pressure on the membrane, coupled with cortex ten-sion acting inwards, creates stress at the cortex-membrane interface. InDictyostelium, at a critical stress level, tethers are broken at a patch of membrane leading to the expansion of a characteristic hemispherical protrusion at the surface [Keller and Eggli, 1998; Yoshida and Inouye, 2001; Keller et al., 2002] (white arrows, Figure 1.2). Bleb nucleation can also result from rupture of the cortex, as demonstrated in L929 cells by Paluch et al. [2005].
Figure 1.2: Two channel fluorescence and DIC sequence of Dictyostelium
induced to bleb. Blebbing is induced by imaging under 1% agarose. The sequence
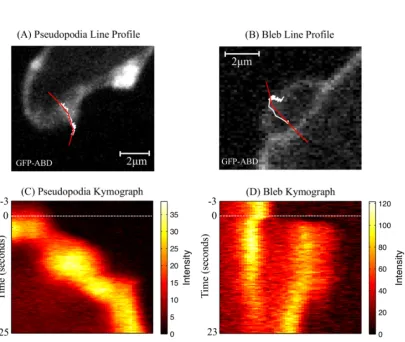
not immediately disassembled, appearing as an actin scar, post bleb, that is visible for several seconds (red arrow, Figure 1.2). The actin scar also appears to act as a barrier to rigid cell components and organelles, preventing them entering a growing bleb. Blebs therefore often appear smoothly textured when viewed with Differential Interference Contrast Microscopy (DIC) (Figure 1.2C). Once expansion ceases, a new cortex is built below the bleb’s surface, re-instating membrane support [Keller and Eggli, 1998; Raucher et al., 2000]. Figure 1.3 compares kymographs of a bleb and actin driven pseudopodia, clearly demonstrating the contrasting characteristics of cortex dynamics. Blebs show rapid expansion and a characteristic gap between scar and newly formed cortex, representing the absence of GFP-ABD. Pseudopodia are filled with actin, and leave no scar, and as such the kymograph shows a more usual pattern of slower, continuous GFP movement.
In Dictyostelium, a bleb will typically expand at a speed of approximately 2µm/sec, as opposed to 0.5µm/sec for pseudopodia. In other cell lines, speeds can vary hugely. Maugis et al. [2010] observed speeds of 10 to 20µm/sec, with extension occurring over a few hundred milliseconds, in Entamoeba histolytica (a parasitic En-tamoeba). In contrast, blebs in M2 cells expand over a period of 10 to 30 seconds [Charras et al., 2006].
It has been proposed that halting expansion is facilitated by a combination of dissipated pressure, increased membrane tension (resulting from increased curvature), and reattachment to the newly assembled cortex [Charras et al., 2006, 2008; Bovellan et al., 2010]. Intuitively, an expanding bleb increases in surface area compared to its base of nucleation, so additional membrane must be supplied, either by unfolding of membrane wrinkles or from lipid flow [Bovellan et al., 2010].
Although blebbing is typically a feature of eukaryotic cells, and is an active pro-cess, it can also be induced in Gram-negative bacteria via treatment with vancomycin, disrupting cross-linking in the peptidoglycan cell wall [Daly et al., 2011]. This suggests that all cells that possess a supported plasma-membrane have the necessary mechanics for blebbing, but eukaryotic cells show the ability to actively exploited it, including during chemotaxis.
1.1.5 Cross-links Between Blebbing and Signalling to the Cytoskele-ton
hence how migration by blebbing is polarised. The components and mechanism of detachment are also unclear [Charras and Paluch, 2008].
Just as localised PtdIns(3,4,5)P3 production at the leading edge can induce
Arp2/3 nucleation of filaments via NFPs, a mechanism must also exist to localise detachment of the cortex from the membrane, in order to form blebs advanced in the gradient. The ERM proteins (ezrin-radixin-moesin) have shown to be essential in teth-ering the membrane to the cortex by directly binding F-actin and integral membrane proteins [Bretscher et al., 2002; Charras et al., 2006]. The presence of ERM proteins, particularly ezrin, can have a marked impact on blebbing; cells expressing constitutively an active mutant of ezrin show marked decrease in blebbing; the ezrin-rich uropod-like structures of melanoma cells show inhibited blebbing [Lorentzen et al., 2011]. Inter-estingly, Hao et al. [2009] showed that PtdIns(4,5)P2 plays a key role in mediating the
ERM proteins, acting as a docking molecule for proteins with lipid-binding domains [Balla, 2005]. Controlling the quantities of PtdIns(4,5)P2 at the leading edge therefore
provides a mechanism by which tethering by ERM proteins can be manipulated to in-duce blebs. However, the density of the cortex is also suspected to play a role, possibly altering tethering, as drug-induced depolymerisation of the cortex can induce blebs, as can creating actin cytoskeleton mutants [DesMarais et al., 2004; Delorme et al., 2007; Kay et al., 2008].
Work completed at Robert Kay’s group (MRC Laboratory of Molecular Biol-ogy, Cambridge), has yielded criteria for defining blebs as visualised inDictyostelium, and demonstrated that the site of bleb formation can be controlled by a chemotactic gradient. Importantly, it has been established using blebbing assays under agarose, that blebbing becomes the dominant form of protrusion in resistive environments. By increasing the agarose concentration, and therefore the magnitude of resistance, Dic-tyostelium can be made to shift its mechanism of protrusion towards the much better suited blebbing. However, blebbing inDictyostelium is yet to be well characterised in terms of, for example, their distribution of speeds, displacements, and frequency.
1.2
Motivation: Seeking Quantitative Data From Images
a systems level view of motility.
Blebbing provides a fitting example, requiring activation in resistive environ-ments, polarisation in chemical gradients, induction of mechanical stress, and ordered recruitment of proteins for both assembly and disassembly of the cortex. To elucidate the mechanics we not only need data on spatial and temporal patterns of protein local-isation and of cell membrane deformation, but be able to compare data across multiple experiments and between perturbed systems. Statistical descriptors are needed which can only be built using quantitative, normalised data.
Inherent redundancy of motility components, as shown by Veltman et al. [2008] and others, makes quantitative data even more important as mutants will generally show only small perturbations in phenotype. Distribution of the SCAR complex, for example, can subtly reduce protrusion persistence [Bear et al., 1998]. That said, any mutant that completely lacks the ability to migrate provides very little insight, par-ticularly as these mutants often prove to be unhealthy and fail to undergo particular stages of development, for exampletalB−Dictyosteliumcells arrest at the tight-mound stage, making them difficult to grow and study [Tsujioka et al., 2008]. Being able to identify subtle phenotypes is therefore key in screening for defective mutants.
1.3
Challenges and Tools for Extracting Numbers From
Images
Unravelling cell motility requires analysis of time series images to capture the spatial-temporal pattern and changes in morphology. These are attained in two or three dimensional, and often in multiple channels. Microscopy images consist of a 2D grid of integer values (pixels) representative of the brightness of the image at any one lo-cation (greyscale). Intensity may be representative of fluorescence emission (confocal microscopy), or interaction of light with passing through a sample (DIC).
The first challenge is ensuring that the measured pixel intensities are compa-rable both within the same image sequence and across experiments. Images may be pre-processed to normalise values, for example, removal of uneven backgrounds. De-scriptors can then be extracted, and in general, the following tasks must be tackled: 1) Segmentation of an image into background pixels and cell body pixels, the bound-aries forming cell outlines; 2) Tracking of cells, or particles, through a sequence by identifying its associated segmentation in each image; 3) Mapping associated outlines to measure local deformations (as performed by ECMM, and reviewed by [Xiong and Iglesias, 2010]).
In the ideal case, images would be captured at very small frame intervals to min-imise displacement between frames, but imaging technology, detrimental response to light, and fluorescence bleaching forces compromises on frame rate in order to maintain image quality (particularly when imaging z-stacks). Analysis tools therefore need to adapt to image noise and missing data.
Developing automated, high-throughput tools is imperative because of the vast quantities of data available, possibly thousands of images per sequence. Many pro-cesses, such as pseudopodia, appear highly stochastic [Xiong et al., 2010], so analysing large numbers of cells is unavoidable if we want meaningful statistics. Results from manual analysis are prone to error, time consuming, and inconsistent, making compar-ison of data between labs impossible (even affecting analysis by the same person at different times of day).
Wessels et al., 1996], and later also tracked nuclei, although this required manual seg-mentation [Wessels et al., 1998].
This work has led to the development of new methods for extracting richer data with greater automation. Techniques are frequently borrowed from the fields of ma-chine learning and computer vision, and applied to a variety of biological problems. For example, image-based chemical compound screening [Xia et al., 2010], classifica-tion of cancer tissues using support vector machines [Wei et al., 2005], and applicaclassifica-tion of clustering, graph cut, and neural networks for tissue segmentation in medical imag-ing [Shen et al., 2005; Vicente et al., 2008]. Commercial software for these approaches is very expensive, but free software is available. CellProfiler can perform cell segmen-tation, but also supervised machine learning for high-throughput identification of cell phenotypes [Carpenter et al., 2006; Jones et al., 2009]. The Danuser Lab also provides a number of programs for image analysis, such as the new plusTipTracker [Applegate et al., 2011].
1.4
Segmentation and Tracking
The simplest approach to automated segmentation is thresholding, whereby pixels are classified by some local measure (e.g. local intensity variance), which is often coupled with pre-processing techniques to reduce noise, and post-processing to filter anoma-lies (reviewed by Miura [2005]). Tracking can then be performed by computing the most probable links between object outlines based upon a range of measures, such as distance, size, or intensity [Al-Kofahi et al., 2006; Downey et al., 2011], with possible improvements derived from graph theory [Bollobas, 1998; Vallotton et al., 2003] (for a review of cell tracking see Meijering et al. [2009]).
In the context of biological images, thresholding often fails to produce an accurate result because of poor signal to noise, faint boundaries, or uneven fluctuations in signal across a cell due to protein turnover or localisation (prominent in cell motility processes) [Wu et al., 1995a]. Cells in contact can easily become merged when boundaries between them are too fait.
for segmentation of medical and biological images because of their robustness to noise, ability to transverse gaps in boundaries, and inherent tracking [Dormann et al., 2002; Zimmer et al., 2002; Ray et al., 2002; Debeir et al., 2004; Huang and Helmke, 2011] . Below, we briefly outline the ideas behind the deformable model, first proposed by Kass et al. [1988], in preparation for describing segmentation and tracking in QuimP.
1.4.1 The Deformable Model
A closed contour, or snake, is initialised around an object andevolved as a Lagrangian system in the form of a gradient descent algorithm, as to minimise the snake’s total energy,Esnake
Esnake=Eint+Eext, (1.1)
whereEint results from internal forces acting to enforce smoothness constraints,
while Eextis composed of image derived forces designed to guide the snake to features
of interest. For example, the forces contributing toEext may be computed from image
intensities at any one pixel position, δI(x, y), or the local image gradient, allowing the detection of edges. Smoothness constraints preventleakage through gaps in image features, but can hinder its ability to converge into concavities (similar to plasma mem-brane tension being curvature dependent, affecting bleb growth [Tinevez et al., 2009]). As the snake is evolved the energy in the system is minimised as forces equilibrate. Once a solution is obtained, snakes can be used for initialisation at subsequent frames, hence active contours contain an inherent tracking (provided objects overlap previous solutions).
Adapted active contours have since been proposed to improve concavity detec-tion, and to expand the limited capture range of image features normally requiring close initialisation. For example, the Gradient Vector Flow snake [Xu and Prince, 1998] and the Force Field Analysis snake [Hou and Han, 2005].
1.5
Tools for Mapping Cell Deformation
Global measures can be easily computed from a sequence of cell outlines. Veltman et al. [2008] used centroid trajectories to compute speed and persistence measures, demon-strating chemotaxis deficiency in PLA2 and sGC mutants. Li et al. [2011] demonstrated that if such data has great enough resolution, then wobbling of the perimeter centroid (which is sensitive to extension of pseudopodia) can reveal cyclic pseudopodia splitting in Dictyostelium. They were than able to successfully model this behaviour using a stochastic approach. However, global parameters lack the necessary detail regarding local membrane deformation, and an appropriate co-ordinate system for tracking and describing fluorescence distributions.
One approach is to overlay outlines at successive time points, and subdivide them into segments according to the points of intersection. The area of these segments will be representative of the amount of extension or retraction, as used in the DIAS sys-tem. Other methods use similar approaches, such as Edge Evolution Tracking (EET), although EET extends this concept by linking segments through time [Tsukada et al., 2008]. However, this provides only very low resolution data, justified only for very simple deformations.
Xiong et al. [2010] proposed a skeletonisation method to directly locate and track emerging pseudopodia. Skeletonisation is a form of morphological operation that describes a shape in terms of its main lines of axis, represented by connected lines. Extending pseudopodia produce new lines of axis, that connect to previous lines, producing an effective means to follow pseudopodia and splitting. However, the process does require branch pruning to remove false axes, does not (to date) include a co-ordinate system for intensity sampling, and is likely to fail in the case of small de novo pseudopodia or blebs, which are often small and susceptible to pruning.
Another classic approach is to use kymographs to measure rates of deformation, for example the membrane activity in human epidermal keratinocytes [Libotte et al., 2001], but such analysis is limited to single regions. Nevertheless, kymographs can be used to visualise spatial-temporal protein distribution by coupling them with an appropriate co-ordinate system. Arai et al. [2010] mapped positions on cell outlines (intensity sampling points) to angles in the plane, centred at an arbitrary position that remained fixed over the length of a sequence. The resulting maps revealed the spontaneous self organising waves of PtdIns(3,4,5)P3 as zig-zag patterns.
fluorescence maps to investigate how intensity is influencing shape change. Although simple to implement, the use of an angular co-ordinate system breaks down when dealing with cell shapes containing concavities, which are very common inDictyostelium during chemotaxis, and can only measure deformation in the direction of the centroid (which is not fixed over the sequence). In the case of Arai et al. [2010], treatment of cells with latrunculin and caffeine inhibited actin polymerisation and cAMP production respectively so cells were comparatively stationary and rounded, hence compliant for analysis.
We would prefer a co-ordinate system that evolves with deformation, and hence has the inherent properties of tracking points in the outline throughout a sequence. This requires a one-to-one mapping of any chosen position (or marker) on an outline at timet, (Γt), to a corresponding position on the preceding outline, Γt+1. Furthermore,
we require a simulated marker path (as if mapped via missing intermediate data) to compute distance of marker travel, and hence local speed. Any such method would need to be computable in real time to be viable for high through-put approaches.
Mapping curves in this way is referred to as parameterisation of the curve. In the same way that a globe can be projected onto a flat surface, maintaining 90 degree angles between lines of longitude and latitude, the Riemann Mapping Theorem states that for any simply-connect domain there exists a conformal (angle-preserving) pa-rameterisation into any other simply-connected domain [Riemann and Wilkins, 1851]. We discussed the use of Riemann mapping in Tyson et al. [2009], concluding that implementation is complex and computationally too expensive.
Spherical harmonics, another focus of surface parameterisation, has been success-fully applied to 3D images of cells [Shen et al., 2009]. However, computing membrane deformation is non-trivial when deformations are large, and registration of subsequent frames difficult.
Alternatively, we can employ boundary propagation techniques, the most promi-nent being the Level Set Method (LSM) [Osher and Sethian, 1988]. By computing intermediate boundaries, markers can be mapped via normals towards Γt+1
(demon-strated in Figure 1.4). Briefly, LSM evolves a boundary in the normal direction at all locations, which is controlled by speed functions. As such, LSM has been used in implicit implementations of active contours, as mentioned above. We detail LSM in Section 2.2 for the purpose of comparison with our own method, LSM being the main contender.
strong deformation. In the related problem of motility simulation, LSM is also used to propagate the cell boundary by coupling it to mechanical, or PDE based, models by defining speed functions [Yang et al., 2008; Neilson et al., 2010a]. LSM has several drawbacks for mapping and modelling, experienced by Machacek and Danuser [2006] and demonstrated in Chapter 3, centred around computational cost and achieving even marker distribution.
Unlike skeletonisation, LSM provides no inherent way to track cell extension or retraction from the mappings it produces, and to our knowledge no one has combined LSM with any such algorithm. However, previous iterations of QuimP, as outlined in the next section, include this functionality, but holds its own limitations.
1.6
Quantitative Imaging of Membrane Proteins (QuimP)
The QuimP software package was first conceived by Till Bretschneider and Thorsten Libotte in 2002 [Dormann et al., 2002], and implements an active contour method to automatically track cell position and shape over time, but crucially, to track local regions of interest during movement for correlation of sampled fluorescence with local deformations.
The QuimP active contour model implements a form of Kass snake, adapted to improve detection of weak boundaries and concave regions. A virtual, closed chain of points (nodes) are connected by contractive forces, but are also acted upon by an additional inward force, pushing nodes into concavities. Together, these forces contract the snake towards objects within the snakes boundaries. An opposing, outward force is calculated from pixel intensities within a bounding box around each node (orientated normal to the snake’s surface), and is referred to as the image force. The gradient in the box determines the size of the image force, and halts nodes at edges.
Because nodes keep their positions relative to their neighbours from frame to frame, the key approach was to utilise them as a reference co-ordinate system for constructing spatio-temporal polar plots, and capturing the dynamics of membrane fluorescence as cells move. Fluorescence was measured by shrinking nodes inwards over the cortex, and recording maximal values. The resulting inner outline is then used to define the cell interior and calculate relative membrane fluorescence in the form of a ratio. This accounts for differences in expression level, photobleaching, and varying illumination between experiments.
Legendre-Ellipses). Furthermore, a quantitative difference was observable in the rate of association and dissociation between the two proteins, as well as periodic CRAC translocation.
Since conception, QuimP has been the analysis tool in numerous publications. The study of acto-myosin dynamics in Dictyostelium in response to cAMP addition, or mechanical stimulation, revealed the well knowncringe response. F-actin is seen to rise sharply and then fall, while myosin-II accumulates only after this response [Etzrodt et al., 2006]. The reversal of polarity that occurs when switching fluid flow is char-acterised by global reduction in F-actin, in contrast to myosin-II which continuously redistributes [Dalous et al., 2008]. Bosgraaf et al. [2005] used myosin-II-GFP to demon-strate deficient polarisation in Dictyostelium mutants. QuimP has also been used to analyse the results of FRAP experiments, determining the average exchange rates of cell-cortex bound coronin to and from the cytoplasm [Bretschneider et al., 2002].
QuimP has been instrumental in studying PtdIns(4,5)P2 and PtdIns(3,4,5)P3
lo-calisation in cAMP gradients. Using GFP tagged, PH domain containing proteins as reporters, Dormann et al. [2004] studied PtdIns localisation and degradation during phagocytosis and chemotaxis, revealing that different PH domains gave distinct spatio-temporal patterns in response to the same PtdIns(3,4,5)P3 signal, enabling varied
re-sponses. Similarly, Ferguson et al. [2007] observed that PtdIns accumulation is PI3K dependent in mouse neutrophils. Bosgraaf et al. [2008] showed strong PtdIns(3,4,5)P3
localisation in steep gradients, enhanced speed, and that PI3K mutants were poor at chemotaxing.
Although providing novel methods for studying protein dynamics, QuimP was unsuitable for quantifying local membrane deformation. QuimP2 [Bosgraaf et al., 2009] introduced the notion of signed area change to quantify membrane deformation between frames. Snake nodes are assigned unique tracking numbers, which are maintained over time. The area increase/decrease resulting from a nodes displacement quantifies deformation local to a node (this minimises the contribution of tangential movement, as opposed to using absolute distance). Data on membrane deformation could then be assembled into spatio-temporal plots, alongside fluorescence data, for the purpose of correlation.
filaments block extension, and that interaction between myosin and F-actin determines both the start and end periods of an extension.
Bosgraaf and Haastert [2009c] used the output of QuimP2 to develop an auto-mated pseudopodia tracking algorithm. By combining information on node area change and curvature, they were able to detect the start and end points of pseudopodia in Dic-tyostelium, producing data on size, lifetime, frequency, and direction. Analysis showed
pseudopodia to extend normal to the surface, rather than directly towards a chemoat-tractant source [Haastert and Bosgraaf, 2009b], and that disruption of cGMP-mediated signalling produces a 3 times reduction in de novo pseudopodia nucleation [Bosgraaf and Haastert, 2009a] (due to myosin filament formation at the cell’s sides [Bosgraaf et al., 2002]). Furthermore, the pseudopod tracking suggests a skating pattern of left/right splitting pseudopodia to amplify response to shallow gradients [Bosgraaf and Haastert, 2009b], and a step-turn strategy used for finding food [Haastert and Bosgraaf, 2009a]. These results have informed a stochastic model by Haastert [2010] which cor-rectly predicted hindered chemotaxis in mutants incapable of pseudopodia splitting, and a feedback-based model by Neilson et al. [2011] where pseudopodia are driven by peaks in local activators, which then feedback to stimulate the production of inhibitors.
1.7
Limitations of the QuimP2 Software
Labelling nodes of an active contour combines segmentation and tracking of local defor-mations into a one step process, and as such is a significant advantage over implement-ing and computimplement-ing additional, slower mappimplement-ing techniques, like LSM. But, although nodes can be retained between frames, changes in local surface area require nodes to be added or removed to maintain node resolution, which subsequently interrupts track-ing lineages and leaves gaps in deformation data. As an example, ustrack-ing 170 nodes to segment a cell over 160 frames will typically introduce over 2,000 new nodes, none of which are traceable to previous frames. Removal of nodes is particularly frequent as concave regions become convex, again breaking lineages. Furthermore, the positions of nodes are determined by parameters chosen to obtain a good segmentation, rather than achieve constant tracking, and do not represent a unique solution. Similarly, the resolution of the tracking is limited by the speed and numerical stability of the active contour method.
pro-vide new means for automated protrusion tracking algorithms that can be applied to cells exhibiting complex patterns of protrusions, including high speed blebbing.
Mapping aside, the segmentation plug-in provided by QuimP2, although effec-tive, is relatively slow (due to implementation), non-parallel, and suffers from instabil-ity. Most importantly however, users are required to pre-set parameters and can not interact with the segmentation process. Therefore, parameter setting requires a certain amount of guess work, and corrections cannot be made manually, making segmentation somewhat laborious. QuimP2 also lacks tools for further analysis, which is a significant problem for free software intended for the benefit of the scientific community, who in general, require the flexibility to extract specific measures of interest.
1.8
Project Aim
Pseudopod formation is generally viewed in the literature as the primary mechanism of movement inDictyostelium. The polymerisation of actin monomers generates force, acting to push forward the plasma membrane. It is becoming increasingly clear that this is not the sole means of locomotion, particularly in resistive environments [Kay et al., 2008]. Blebbing exploits intracellular hydrostatic pressure to drive forwards patches of membrane, producing distinct hemispherical protrusions that extend quickly, at high speed, and leave actin scars.
To study these mechanisms of motility we require new high-throughput tech-niques capable of quantifying both deformation and fluorescence of large, slowly ex-tending pseudopodia, but also rapidly exex-tending blebs, which are often comparatively small, short lived, and result in complex changes to membrane curvature. Hand-in-hand with this aim is the need to update the current QuimP software to Hand-in-handle these kinds of problems, and eliminate the limitations outline in the previous section.
To this end, we want to integrate into QuimP a new, high resolution, mem-brane tracking method, which does not suffer from dilation of markers (as LSM does), while being efficient enough for high-throughput analysis. We can use this method to implement an automated protrusion tracking algorithm capable of tracking blebbs. Furthermore, we aim to be able to validate the membrane tracking performedin silico with that of real membrane deformation inDictyostelium. In collaboration with Rob Kay’s group, we aim to then apply QuimP to extract quantitative data on the nature of pseudopodia and blebs inDictyostelium migrating under agar.
documentation and analysis tools.
Materials and Methods
2.1
Software Development Tools
QuimP was written in the Java programming language as plug-ins for ImageJ1, im-age analysis software based in the Java languim-age (created by Wayne Rasband at the National Institute of Mental Health) [Abr`amoff et al., 2004].
ImageJ includes inbuilt image processing algorithms and allows cross platform distribution. QuimP was developed within Mac OSx 10.6.8 using Netbeans IDE 6.9.1, Java development kit 5, and ImageJ source code 1.45g [Computer spec: 2.4GHz Intel Core i5, 4 GB 1067 MHz DDR3 memory].
Image-preprocessing and analysis (including the use of QuimP) was performed on the Warwick Systems Biology Image Server (Linux OS) [spec: Dual Quad-Core AMD Opteron Processor 2350 2 GHz , 32 GB memory]. Fiji (1.45b), an expanded version of ImageJ (http://fiji.sc/wiki/index.php/Fiji#) was used for scripting ImageJ macros for image pre-processing and manipulation. Prototyping of ECMM, ECMM-APT, and analysis of QuimP output was performed using MATLAB2 version
7.10.0.499 (R2010a). This included the use of the MATLAB products Image Processing Toolbox, Statistics Toolbox, and Curve Fitting Toolbox.
2.2
Marker Mapping Using the Level Set Method
This section describes a level set method for tracking local membrane deformations, as previously implemented by Machacek and Danuser [2006], and as overviewed by Tyson et al. [2009].
1
http://rsbweb.nih.gov/ij/
We propagate the cell outline ΓT to ΓT+1, and extract a series of intermediate
boundaries, Γt, where tis an evolutionary time step.
First, ΓT is defined on a two dimensional cartesian grid (ΓT(x, y)∈R2). The grid is transformed into a three dimensional surface, φT, called the level set, by applying a
signed distance function (Figure 2.1A, B, C). The function definesz values onφT(x, y)
equal to the distance between (x, y) and the closest point on ΓT. The outline ΓT is
therefore defined by the zero level set
ΓT ={(x, y)|φT(x, y) = 0}. (2.1)
ΓT can be evolved uniformly by adding a constant to the signed distance function,
effectively displacingφT in the z axis (Figure 2.1D). A new zero level set can then be
extracted.
Similarly, φT can be propagated onto φT+1 by controlling the speed of level set
evolution via the evolution equation
∂φ(x, y, t)
∂t +F(φt, t)|∇φt(x, y, t)|= 0, (2.2)
φ(x,y,t=0) =φ(x,y,T), (2.3)
whereF (the speed function) controls the speed at which the surface gradient ofφt is
followed (Figure 2.2). The MATLAB add-on toolbox implementing Level Set Methods [Mitchell, 2008] was used to provide the functionality for evolving level sets. Critically, the speed function influences the characteristics of the intermediate boundaries, and hence the propagation of normals. The simplest speed function, Fd, will move ΓT at
speeds proportional to its distance from ΓT+1:
Fd=φt−φT+1. (2.4)
During evolution, intermediate contours, Γt, are extracted as zero level sets (as
in equation (2.1)). A set of virtual markers are then propagated successively between intermediate boundaries in a direction defined by the normal at the location of the marker on Γt, until ΓT+1is reached. The computational expense of propagating markers
is independent from the computation of the intermediate outlines.


![Figure 3.1: Defining quantities for a line charge. Adapted from Rowley [2006].](https://thumb-us.123doks.com/thumbv2/123dok_us/9685291.469981/59.595.225.405.548.645/figure-dening-quantities-line-charge-adapted-rowley.webp)